


 |
市場調查報告書
商品編碼
2035098
廢棄物管理:市場佔有率分析、行業趨勢和統計數據、成長預測(2026-2031 年)Waste Management - Market Share Analysis, Industry Trends & Statistics, Growth Forecasts (2026 - 2031) |
||||||

※ 本網頁內容可能與最新版本有所差異。詳細情況請與我們聯繫。
據估計,2026 年廢棄物管理市場價值為 1.52 兆美元,預計在預測期(2026-2031 年)內將以 6.58% 的複合年成長率成長,到 2031 年達到 2.09 兆美元。
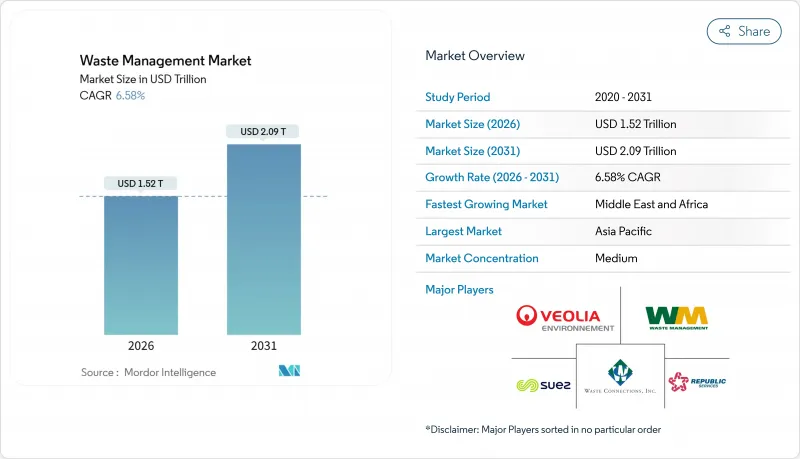
從以廢棄物管理為中心的營運模式向資源回收的轉變,是支撐這一市場規模和成長軌跡的根本原因。歐盟和美國部分州強制要求回收材料含量、亞太地區推行生產者延伸責任制(EPR)以及與企業科學目標掛鉤的範圍3廢棄物報告,都在加速資本流入先進的分揀、化學回收和垃圾焚化發電基礎設施。儘管掩埋服務仍然是重要的收入來源,但隨著回收和資源回收業務以每年6.80%的速度成長,營運商正在轉變其關注重點。這主要得益於人工智慧(AI)驅動的機器人技術,該技術在資源回收設施中實現了99%的純度。亞太地區仍是收入中心,但中東和非洲地區的複合年成長率(CAGR)最高(9.1%),這主要得益於政府對垃圾焚化發電計畫的資助。隨著大型能源公司和數位化分類新創公司推動現有營運商提供涵蓋收集、處理和可再生燃料生產的綜合服務,競爭壓力正在加劇。
全球廢棄物管理市場趨勢及洞察
歐盟、美國等國家製定了關於塑膠包裝中再生材料比例的法律。
歐盟《包裝和包裝廢棄物法規》(2025/40)和加州參議院第54號法案等法律法規要求品牌所有者在所有初級包裝中摻入指定比例的消費後塑膠,從而促進與機械和化學回收商簽訂多年期回收協議。這些法規提高了品質標準,鼓勵升級光學分類生產線,並投資於能夠生產食品級產品的解聚設備。國際能源總署 (IEA) 估計,假設回收系統能夠跟上步伐,到2030年,實現這些法律目標每年可防止1500萬噸塑膠掩埋。雖然擁有ISO 9001和ISO 14001認證的大規模回收商能夠承擔合規成本,但缺乏可追溯性工具的小規模企業卻難以業務永續營運。違規日益嚴厲,採購團隊也越來越重視能夠提供純度保證和長期加工能力的供應商。
擴大亞太地區紡織和電子產品領域的生產者責任延伸制度
新加坡、香港和印度在2024年至2025年間擴大了生產者延伸責任制(EPR)框架,將廢棄物收集和處理成本轉移給了產品製造商。新加坡對違規行為的罰款高達7.4萬美元,而印度修訂後的目標是到2027年實現70%的回收率,這增強了企業在設計產品時考慮可拆解性的經濟獎勵。在亞洲許多地區,正規回收率仍低於20%,迫使品牌所有者共同投資興建市政回收點和逆向物流中心,以符合相關規定。這些政策促使私人資本流入電子產品拆解中心和高產能紡織品切碎機,拓展了包裝產業以外的收入來源。產業分析師預計,隨著掩埋容量日益緊張以及非正規回收受到監管審查,未來將有更多地區實施生產者延伸責任制。
高利率削弱了PPP模式對回收工廠的資金籌措。
全球貨幣緊縮導致2024年公私合營(PPP)廢棄物項目數量下降25%,投資金額因債務收入比惡化而降至68億美元。南非取消競標以及印尼垃圾處理廠建設延期表明,不斷上漲的資本成本正阻礙專案發起人簽訂長期特許經營協議。缺乏信用強化措施的市政當局被迫提供更高的入場費擔保以降低設施延期的風險,這可能會延長掩埋的使用壽命,並阻礙廢棄物再利用目標的實現。此外,資金籌措緊張也阻礙了依賴企劃案融資擴大業務的中小型技術供應商的發展。除非利率有所回落,否則新興市場的許多回收項目將不得不依賴優惠貸款和混合融資機制。
細分市場分析
儘管到2025年,生活廢棄物仍將佔銷售額的46.54%,繼續保持其在廢棄物管理市場中的最大佔有率,但工業廢棄物的重要性正在日益提升。該領域8.3%的複合年成長率主要歸功於製造商在現場安裝中和設備,以滿足更嚴格的職業安全法規,例如修訂後的OSHA 2024危險物質通訊標準。許多工廠目前透過將閉迴路水循環系統與危險廢棄物預處理相結合,減少了運往廠外的廢物量,並降低了許可證獲取成本。馬來西亞和越南的電子組裝製造商在2025年安裝了酸洗反應器,以符合歐洲進口審計的要求。這反映了下游買家對上游廢棄物處理方式的影響。一家墨西哥汽車零件供應商安裝了一套溶劑回收蒸餾裝置,可回收95%的異丙醇,從而降低了材料成本,並避免了易燃廢棄物的額外費用。這些案例表明,合規方面的投資與成本降低密切相關,這種組合有助於即使在產品價格下降的情況下也能維持該領域的成長。
在預測期內,工業運營商預計將簽訂多年期「淨零廢棄物」服務契約,其中包含基於績效的條款,而非簡單的基於噸位的定價。這種模式已在亞利桑那州和新加坡的半導體工廠進行試驗。因此,擁有ISO 14001認證的專業危險廢棄物處理公司在競標中勝過缺乏實驗室檢測和清單追蹤軟體的普通運輸商。資本投資的增加促使一些小規模電鍍廠組成合作社,共用現場處理設施,類似印度紡織工業叢集採用的公共污水處理設施。在廢棄物管理市場,模組化移動分離器的引入正成為一種趨勢,該分離器可在源頭碼頭處理乳化油,從而消除道路運輸及其相關責任。此外,隨著貸款機構擴大將與廢棄物相關的指標納入ESG貸款協議,不願揭露廢棄物減量進展的製造商將不得不支付更高的利差,這將進一步加速該領域對認證供應商的使用。
這份《廢棄物管理市場報告》按來源(家庭、商業設施[零售、辦公室等]、工業設施等)、服務類型(收集、運輸、分類/分離、處置/處理)、廢棄物類型(生活廢棄物、電子廢棄物等)和地區(北美、歐洲等)進行細分。本報告提供了上述所有細分市場的規模和預測(價值:美元)。
區域分析
預計到2025年,亞太地區將佔全球收入的56%,佔據廢棄物管理市場最大的區域佔有率,並成為處理量成長的核心驅動力。中國修訂後的《固態廢棄物法》規定,非法傾倒垃圾將被處以14萬美元的罰款,這加快了對光學分類機和垃圾焚化發電發電廠的投資,以應對日益成長的都市區廢棄物量。印度的「清潔印度2.0」計畫已撥款17億美元,用於在4700個城市推廣源頭分類和堆肥。同時,在日本,各市政府在強制回收紡織品和智慧型手機的支援下,正共同努力,力爭2030年最終處置量減少50%。一家新加坡私募股權基金收購了馬來西亞一家回收公司的少數股權,預期該公司將建立一個區域物流中心,在將高價值塑膠運往當地化學解聚工廠之前進行集中處理。出口到歐洲的公司越來越依賴越南和泰國的許可公司頒發的合規召回證書,這正在成為同時擁有歐盟 REACH 法規和當地許可證的公司的新收入來源。
中東和非洲是成長最快的地區,預計到2031年將以9.1%的複合年成長率成長,主權財富基金正在共同出資建設綜合廢棄物管理設施。沙烏地阿拉伯與Averda公司投資18億美元的合資企業就是一個典型的例子,它體現了公共資金如何與其在2030年實現70%廢棄物回收的政策目標相契合。阿拉伯聯合大公國(阿拉伯聯合大公國)已於2024年禁止使用一次性塑膠製品,目前正為在阿布達比KEZAD經濟特區建設先進資源回收設施的業者提供費用減免。埃及正利用世界銀行貸款維修垃圾掩埋場,並在開羅建造一條堆肥生產線,將食物廢棄物加工成農業肥料,並透過有保障的回收合約進行銷售。南非的「生產者延伸責任制 (EPR)」法規於 2024 年實施,在營運的第一年就產生了 9000 萬美元的合規費用,這些費用被用於資助服務不足的城鎮的收集合作社。
北美和歐洲的技術已經相當成熟,但它們絕對不會因此而自滿。加州和華盛頓州已通過了關於再生材料含量的不同立法,並鼓勵品牌所有者通過簽訂十年期合約來確保供應,這些合約優先考慮採用基於區塊鏈的可追溯性技術的美國回收商。德國和荷蘭的市政當局正在透過引入競標系統來調整獎勵,使其與循環經濟目標相符,企業競標的是廢棄物再利用率,而不是入場費折扣。巴西、智利和哥倫比亞在正規基礎設施建設方面落後於其他國家,但它們正在發行與永續發展掛鉤的債券來彌補差距,這些債券用於津貼車輛現代化改造和物料回收設施(MRF)的維修。隨著限制廢棄物出口的立法不斷擴大,跨境廢棄物流動正在減少,這增強了當地的自給自足能力,並迫使企業最佳化國內處理能力。
其他好處:
- Excel格式的市場預測(ME)表
- 3個月的分析師支持
目錄
第1章:引言
- 分析範圍
第2章 分析方法
第3章執行摘要
第4章 市場狀況
- 市場促進因素
- 塑膠包裝中強制再生材料含量(歐盟、美國)
- 在亞太地區紡織和電子產業擴大生產者延伸責任制(EPR)
- 針對需要進行範圍 3廢棄物報告的公司,制定基於科學的目標。
- 透過與永續發展掛鉤的債券為新興市場的廢棄物基礎設施資金籌措。
- 利用城市垃圾作為原料的綠色氫能項目
- AI驅動的機器人實現了MRF物料99%的純度,降低了分類成本。
- 市場限制因素
- 經合組織國家勞動力短缺推高了薪資水準。
- 高利率正在削弱官民合作關係(PPP)模式對回收工廠的資金籌措。
- 禁止進口固態廢棄物(例如來自中國的廢棄物)減少了可用的處置選擇。
- 缺乏針對再生碳纖維的「廢棄物處理」法規阻礙了其廣泛應用。
- 價值/供應鏈分析
- 監理展望
- 技術展望
- 創業生態系分析
- 主要新興趨勢
- 地緣政治衝擊的影響
- 產業吸引力:五力分析
- 新進入者的威脅
- 買方的議價能力
- 供應商議價能力
- 替代品的威脅
- 競爭公司之間的競爭關係
第5章 市場規模及成長預測(單位:十億美元)
- 來源
- 家
- 商業設施(零售、辦公室等)
- 工業設施
- 醫療設施(醫療保健和製藥)
- 建設與拆除
- 其他(組織、農業等)
- 按服務類型
- 收集、運送、分類、分類
- 處置和處理
- 掩埋土地
- 回收和資源回收
- 焚燒和垃圾焚化發電
- 其他(化學處理、堆肥等)
- 其他服務(諮詢、審計、訓練等)
- 按廢棄物類型分類
- 都市固態廢棄物
- 工業用危險廢棄物
- 電子廢棄物
- 塑膠廢棄物
- 醫療廢棄物
- 建築和拆除廢棄物
- 農業廢棄物
- 其他特殊廢棄物(例如放射性廢棄物)
- 按地區
- 北美洲
- 美國
- 加拿大
- 墨西哥
- 南美洲
- 巴西
- 阿根廷
- 南美洲其他地區
- 亞太地區
- 中國
- 日本
- 印度
- 韓國
- 東協(印尼、泰國、菲律賓、馬來西亞、越南)
- 澳洲
- 亞太其他地區
- 歐洲
- 英國
- 德國
- 法國
- 義大利
- 西班牙
- 俄羅斯
- 比荷盧經濟聯盟(比利時、荷蘭、盧森堡)
- 北歐國家(丹麥、芬蘭、冰島、挪威、瑞典)
- 其他歐洲國家
- 中東和非洲
- 沙烏地阿拉伯
- 阿拉伯聯合大公國
- 卡達
- 土耳其
- 南非
- 埃及
- 奈及利亞
- 其他中東和非洲地區
- 北美洲
第6章 競爭情勢
- 策略趨勢
- 市佔率分析
- 公司簡介
- Veolia Environment SA
- Waste Management Inc.
- Suez SA
- Republic Services Inc.
- Waste Connections Inc.
- Clean Harbors Inc.
- Covanta Holding Corporation
- Biffa Group
- Remondis SE & Co. KG
- Stericycle Inc.
- GFL Environmental Inc.
- FCC Environment
- Cleanaway Waste Management Ltd
- Hitachi Zosen Inova AG
- Sims Limited
- Renewi PLC
- Averda
- Daiseki Co. Ltd
- Tatweer Environmental Services
- Waste Pro USA
- Recology
第7章 市場機會與未來展望
The Waste Management Market size is estimated at USD 1.52 trillion in 2026, and is expected to reach USD 2.09 trillion by 2031, at a CAGR of 6.58% during the forecast period (2026-2031).
The opening shift from disposal-centric operations toward resource recovery underscores this market size and growth trajectory. Mandatory recycled-content laws in the European Union and several U.S. states, broader extended-producer-responsibility (EPR) mandates across Asia-Pacific, and Scope-3 waste reporting tied to corporate science-based targets are accelerating capital flows into advanced sorting, chemical recycling, and waste-to-energy infrastructure. Landfill services still anchor revenue, yet operators are pivoting as recycling and resource-recovery lines attract 6.80% annual growth, supported by artificial-intelligence robotics that deliver 99% purity at material-recovery facilities. Asia-Pacific remains the revenue epicenter, but sovereign-wealth-fund financing of waste-to-energy projects is lifting the Middle East and Africa to the fastest regional CAGR (9.1%). Competitive pressure is intensifying as energy majors and digital-sorting start-ups push incumbents to bundle collection, treatment, and renewable-fuel production within integrated offerings.
Global Waste Management Market Trends and Insights
Mandatory Recycled-Content Laws for Plastic Packaging (EU, US)
Legislation such as the European Union's Packaging and Packaging Waste Regulation 2025/40 and California's Senate Bill 54 compels brand owners to integrate defined shares of post-consumer resin in all primary packaging, driving multi-year offtake contracts with mechanical and chemical recyclers. These statutes tighten quality standards, prompting upgrades in optical-sorter lines and investment in depolymerization units capable of food-grade outputs. The International Energy Agency estimates that meeting statutory targets could divert 15 million metric tons of plastic from landfills annually by 2030, provided collection systems keep pace. Larger recyclers equipped with ISO 9001 and ISO 14001 certifications are absorbing compliance premiums, while smaller facilities lacking traceability tools struggle to remain viable. Penalties for non-compliance escalate, and procurement teams increasingly reward operators offering guaranteed purity and long-term capacity.
EPR Expansion to Textiles & Electronics Across APAC
Singapore, Hong Kong, and India broadened EPR frameworks during 2024-2025, shifting waste-collection and treatment costs upstream to product manufacturers. Penalties now reach USD 74,000 per violation in Singapore, and India's revised targets demand 70% take-back volumes by 2027, sharpening financial incentives for design-for-disassembly. Formal collection remains below 20% in much of Asia, so compliance pushes brand owners to co-fund municipal drop-off points and reverse-logistics hubs. These policies channel private capital into electronics-dismantling centers and high-throughput textile shredders, expanding addressable revenue pools beyond packaging. Industry analysts expect more jurisdictions to replicate EPR schemes as landfill capacity tightens and informal recycling draws regulatory scrutiny.
High Interest Rates Weakening PPP Financing for Recycling Plants
Global monetary tightening pushed public-private partnership (PPP) waste projects down 25% in 2024, with investment falling to USD 6.8 billion as debt-service ratios worsened. Canceled tenders in South Africa and postponed treatment plants in Indonesia illustrate how higher capital costs deter sponsors from long-tenor concessions. Municipalities lacking credit enhancements must now offer higher gate-fee guarantees or risk facility delays, extending landfill lifespans and undermining diversion targets. The financing squeeze also raises barriers for small technology providers that rely on project finance for scale-up. Unless interest rates ease, many emerging-market recycling projects will hinge on concessional or blended-finance structures.
Other drivers and restraints analyzed in the detailed report include:
- Corporate Science-Based Targets Requiring Waste Scope-3 Reporting
- Sustainability-Linked Bonds Financing Waste Infrastructure in Emerging Markets
- Labor Shortages Inflating Collection Wages in OECD Countries
For complete list of drivers and restraints, kindly check the Table Of Contents.
Segment Analysis
Industrial streams are gaining prominence even though residential waste still accounted for 46.54% of revenue in 2025, the largest share within the Waste Management market share landscape. The segment's faster 8.3% CAGR stems from manufacturers installing on-site neutralization units to satisfy stricter occupational-safety rules such as OSHA's 2024 Hazard Communication Standard revision. Many plants now couple closed-loop water systems with hazardous-waste pretreatment, reducing off-site hauling volumes and permitting costs. Electronics assemblers in Malaysia and Vietnam added acid-scrubbing reactors in 2025 to comply with European import audits, illustrating how downstream buyers dictate upstream waste behavior. Automotive suppliers in Mexico deployed solvent-recovery stills that recaptured 95% of isopropanol, cutting material expense and avoiding flammable-waste surcharges. These examples show that compliance investments are lining up with cost avoidance, a combination that sustains segment growth even when commodity prices dip.
Over the forecast horizon, industrial operators will sign multi-year "net-zero waste" service contracts that embed pay-for-performance clauses rather than simple tonnage fees, a structure already piloted by semiconductor fabs in Arizona and Singapore. Specialized hazardous-waste firms displaying ISO 14001 credentials are therefore winning bids over generalist haulers that lack laboratory testing and manifest-tracking software. Rising capital expenditure pushes some smaller electroplating shops to form cooperatives that share on-site treatment units, echoing pooled effluent plants adopted by Indian textile clusters. The Waste Management market is responding with modular mobile separators that treat emulsified oils at the generator's dock, eliminating road transport and the liability it entails. As credit providers increasingly incorporate waste metrics into ESG loan covenants, industrial producers unwilling to disclose diversion progress are paying higher interest spreads, reinforcing the segment's push toward certified vendors.
The Waste Management Market Report is Segmented by Source (Residential, Commercial [Retail, Office, Etc. ], Industrial and More), by Service Type (Collection, Transportation, Sorting & Segregation and Disposal/Treatment), by Waste Type (Municipal Solid Waste, E-Waste and More), and by Geography (North America, Europe and More). The Report Offers Market Size and Forecasts in Value (USD) for all the Above Segments.
Geography Analysis
Asia-Pacific held 56% of 2025 global revenue, giving it the largest regional slice of the Waste Management market share and positioning it as the anchor for volume growth. China's revised Solid Waste Law imposes fines of USD 140,000 for illegal dumping, accelerating investment in optical sorters and waste-to-energy boilers that handle rising urban tonnage. India's Swachh Bharat Mission 2.0 disbursed USD 1.7 billion across 4,700 cities to scale source segregation and composting, while Japanese municipalities collectively target a 50% cut in final disposal by 2030, supported by mandatory take-back for textiles and smartphones. Private equity funds in Singapore are buying minority stakes in Malaysian recyclers, betting on regional logistics hubs that consolidate high-value plastics before shipment to local chemical depolymerization plants. Corporations exporting into Europe increasingly depend on compliant recovery certificates issued by licensed operators in Vietnam and Thailand, creating new revenue channels for firms that obtain both EU REACH and local permits.
The Middle East and Africa are the fastest-growing territories, expanding at a 9.1% CAGR to 2031 as sovereign wealth funds co-finance integrated waste campuses. Saudi Arabia's USD 1.8 billion joint venture with Averda exemplifies how public capital aligns with policy mandates targeting 70% diversion by 2030. The United Arab Emirates banned single-use plastics in 2024 and now grants fee holidays to operators installing advanced material-recovery facilities in Abu Dhabi's KEZAD zone. Egypt leverages World Bank loans to rehabilitate landfill cells and establish composting lines that process Cairo's food waste into agricultural amendments sold under guaranteed off-take agreements. South Africa's extended producer responsibility regulations, effective 2024, generated USD 90 million in compliance fees during their first full year, financing collection cooperatives in underserved townships.
North America and Europe remain technologically mature yet far from complacent. California and Washington State passed patchwork recycled-content statutes, prompting brand owners to lock in supply via 10-year contracts that favor U.S. recyclers offering blockchain-verified traceability. German and Dutch municipalities launched auction mechanisms where operators bid diversion percentages instead of gate-fee discounts, aligning incentives with circular-economy goals. Brazil, Chile, and Colombia trail in formal infrastructure but are closing gaps through sustainability-linked bond issuances, which subsidize fleet modernization and MRF upgrades. As legislation restricting waste exports widens, cross-border movements shrink, reinforcing regional self-sufficiency and pushing operators to optimize domestic treatment capacity.
- Veolia Environment SA
- Waste Management Inc.
- Suez SA
- Republic Services Inc.
- Waste Connections Inc.
- Clean Harbors Inc.
- Covanta Holding Corporation
- Biffa Group
- Remondis SE & Co. KG
- Stericycle Inc.
- GFL Environmental Inc.
- FCC Environment
- Cleanaway Waste Management Ltd
- Hitachi Zosen Inova AG
- Sims Limited
- Renewi PLC
- Averda
- Daiseki Co. Ltd
- Tatweer Environmental Services
- Waste Pro USA
- Recology
Additional Benefits:
- The market estimate (ME) sheet in Excel format
- 3 months of analyst support
TABLE OF CONTENTS
1 Introduction
- 1.1 Scope of the Study
2 Research Methodology
3 Executive Summary
4 Market Landscape
- 4.1 Market Drivers
- 4.1.1 Mandatory Recycled-Content Laws for Plastic Packaging (EU, US)
- 4.1.2 EPR Expansion to Textiles & Electronics Across APAC
- 4.1.3 Corporate Science-Based-Targets Requiring Waste Scope-3 Reporting
- 4.1.4 Sustainability-Linked Bonds Financing Waste Infrastructure in Emerging Markets
- 4.1.5 Green-Hydrogen Projects Using MSW Feedstock
- 4.1.6 AI-Driven Robotics Achieving 99 % MRF Purity, Cutting Sorting Costs
- 4.2 Market Restraints
- 4.2.1 Labour Shortages Inflating Collection Wages in OECD Countries
- 4.2.2 High Interest Rates Weakening PPP Financing for Recycling Plants
- 4.2.3 Import Bans on Solid Waste (e.g., China) Shrinking Disposal Options
- 4.2.4 Absence of End-of-Waste Rules for Recycled Carbon Fibre Limiting Adoption
- 4.3 Value / Supply-Chain Analysis
- 4.4 Regulatory Outlook
- 4.5 Technological Outlook
- 4.6 Startup Ecosystem Analysis
- 4.7 Key Emerging Trends
- 4.8 Impact of Geopolitical Shocks
- 4.9 Industry Attractiveness - Porter's Five Forces
- 4.9.1 Threat of New Entrants
- 4.9.2 Bargaining Power of Buyers
- 4.9.3 Bargaining Power of Suppliers
- 4.9.4 Threat of Substitute Products
- 4.9.5 Intensity of Competitive Rivalry
5 Market Size & Growth Forecasts (Value, In USD Billion)
- 5.1 By Source
- 5.1.1 Residential
- 5.1.2 Commercial (retail, office, etc.)
- 5.1.3 Industrial
- 5.1.4 Medical (Health and Pharmaceutical)
- 5.1.5 Construction & Demolition
- 5.1.6 Others (institutional, agricultural, etc)
- 5.2 By Service Type
- 5.2.1 Collection, Transportation, Sorting & Segregation
- 5.2.2 Disposal / Treatment
- 5.2.2.1 Landfill
- 5.2.2.2 Recycling & Resource Recovery
- 5.2.2.3 Incineration & Waste-to-Energy
- 5.2.2.4 Others (Chemical Treatment, Composting, etc.)
- 5.2.3 Others (Consulting, Audit & Training, etc.)
- 5.3 By Waste Type
- 5.3.1 Municipal Solid Waste
- 5.3.2 Industrial Hazardous Waste
- 5.3.3 E-waste
- 5.3.4 Plastic Waste
- 5.3.5 Biomedical Waste
- 5.3.6 Construction & Demolition Waste
- 5.3.7 Agricultural Waste
- 5.3.8 Other Specialized Waste (radio active, etc)
- 5.4 By Geography
- 5.4.1 North America
- 5.4.1.1 United States
- 5.4.1.2 Canada
- 5.4.1.3 Mexico
- 5.4.2 South America
- 5.4.2.1 Brazil
- 5.4.2.2 Argentina
- 5.4.2.3 Rest of South America
- 5.4.3 Asia-Pacific
- 5.4.3.1 China
- 5.4.3.2 Japan
- 5.4.3.3 India
- 5.4.3.4 South Korea
- 5.4.3.5 ASEAN (Indonesia, Thailand, Philippines, Malaysia, Vietnam)
- 5.4.3.6 Australia
- 5.4.3.7 Rest of Asia-Pacific
- 5.4.4 Europe
- 5.4.4.1 United Kingdom
- 5.4.4.2 Germany
- 5.4.4.3 France
- 5.4.4.4 Italy
- 5.4.4.5 Spain
- 5.4.4.6 Russia
- 5.4.4.7 BENELUX (Belgium, Netherlands, and Luxembourg)
- 5.4.4.8 NORDICS (Denmark, Finland, Iceland, Norway, and Sweden)
- 5.4.4.9 Rest of Europe
- 5.4.5 Middle East and Africa
- 5.4.5.1 Saudi Arabia
- 5.4.5.2 United Arab Emirates
- 5.4.5.3 Qatar
- 5.4.5.4 Turkey
- 5.4.5.5 South Africa
- 5.4.5.6 Egypt
- 5.4.5.7 Nigeria
- 5.4.5.8 Rest of Middle East and Africa
- 5.4.1 North America
6 Competitive Landscape
- 6.1 Strategic Moves
- 6.2 Market Share Analysis
- 6.3 Company Profiles {(includes Global level Overview, Market level overview, Core Segments, Financials as available, Strategic Information, Products & Services, and Recent Developments)}
- 6.3.1 Veolia Environment SA
- 6.3.2 Waste Management Inc.
- 6.3.3 Suez SA
- 6.3.4 Republic Services Inc.
- 6.3.5 Waste Connections Inc.
- 6.3.6 Clean Harbors Inc.
- 6.3.7 Covanta Holding Corporation
- 6.3.8 Biffa Group
- 6.3.9 Remondis SE & Co. KG
- 6.3.10 Stericycle Inc.
- 6.3.11 GFL Environmental Inc.
- 6.3.12 FCC Environment
- 6.3.13 Cleanaway Waste Management Ltd
- 6.3.14 Hitachi Zosen Inova AG
- 6.3.15 Sims Limited
- 6.3.16 Renewi PLC
- 6.3.17 Averda
- 6.3.18 Daiseki Co. Ltd
- 6.3.19 Tatweer Environmental Services
- 6.3.20 Waste Pro USA
- 6.3.21 Recology
7 Market Opportunities & Future Outlook

 零廢棄物解決方案市場預測至2034年-全球分析(按解決方案類型、材料類型、應用、最終用戶、目標廢棄物、分銷管道和地區分類)
 廢棄物管理市場:依服務類型、廢棄物類型、處理技術和最終用戶分類-2026-2032年全球市場預測智慧廢棄物管理市場預測至2034年-全球分析(按組件、廢棄物類型、解決方案類型、技術、最終用戶和地區分類)
 全球 PFAS廢棄物管理市場:按處理技術、服務類型、最終用途產業和地區分類 - 預測(至 2031 年)
 2026年全球多氟烷基物質(PFAS)廢棄物管理市場報告2026年全球廢棄物管理與回收服務市場報告2026年全球紡織廢棄物管理市場報告2026年全球廢棄物管理軟體市場報告2026年全球放射性廢棄物管理系統市場報告
 全球廢棄物管理軟體市場規模、佔有率、趨勢和成長分析報告(2026-2034年)