


 |
市場調查報告書
商品編碼
2035084
汽車線束:市場佔有率分析、產業趨勢與統計、成長預測(2026-2031)Automotive Wiring Harness - Market Share Analysis, Industry Trends & Statistics, Growth Forecasts (2026 - 2031) |
||||||
※ 本網頁內容可能與最新版本有所差異。詳細情況請與我們聯繫。
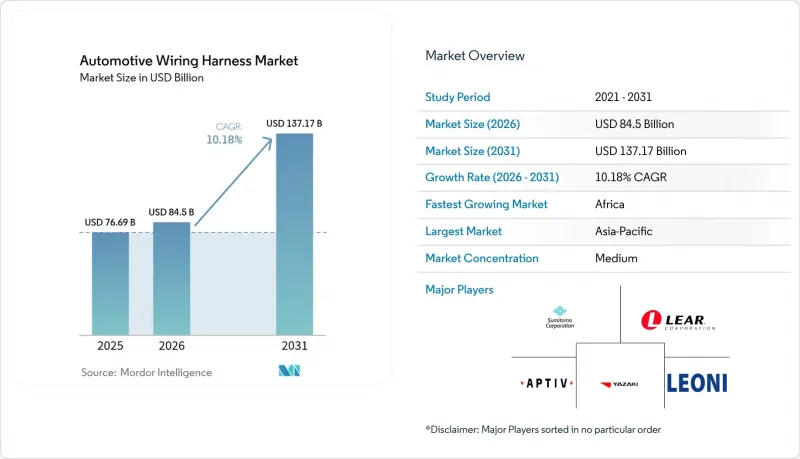
預計到 2026 年,汽車線束市場規模將達到 845 億美元,高於 2025 年的 766.9 億美元,預計到 2031 年將達到 1,371.7 億美元。
預計從 2026 年到 2031 年,其複合年成長率將達到 10.18%。
儘管由於每輛車電子元件數量的增加,市場正在穩步擴張,但在這種表面成長的背後卻隱藏著兩種相互矛盾的趨勢。用於電池式電動車(BEV)的高壓線束需求正以兩位數的速度成長,而用於傳統低壓內燃機(ICE)的線束價格卻在不斷下降。從區域來看,亞洲仍然是生產和消費中心,而非洲則憑藉其有利的勞動成本和在地採購法規,正在吸引新的產能。同時,北美和歐洲等成熟市場正轉向分區電氣架構,這種架構可以縮短電纜佈線距離,同時提高每條剩餘電纜的價值。
全球汽車線束市場趨勢及洞察
電氣化導致高壓線束需求激增。
隨著電池組電壓升至 800V 甚至 1000V,需要一種新型電纜組件,它既能承受更大的熱負荷,又能滿足嚴格的電磁相容性 (EMC) 標準。許多中國品牌目前在其主驅動線中指定使用鋁基導體,而材料創新與電動車成本的降低直接相關。由於鋁材需要新的連接技術,供應商正以五年前前所未有的速度投資摩擦焊接和雷射焊接設備。由此產生的一個新觀點是,焊接技術可能很快就會比銅材採購更重要,成為一項重要的競爭障礙。
原始設備製造商正在推廣輕量化鋁製和光纖線束。
汽車製造商持續追求極致輕量化,甚至精確到克,在豪華車中,僅線束的重量就可能超過20公斤。鋁導體不僅比銅導體輕約60%,還能降低銅價波動帶來的風險。雖然鋁導體的導電性較低,但多芯設計和雙金屬端子能夠將接觸電阻控制在規格範圍內,彌補了這一不足。隨著連接技術的日益成熟,一些原始設備製造商(OEM)正在推出混合導體線束,將鋁製電源線與光纖數據傳輸線相結合,這表明未來的發展方向並非單一金屬解決方案,而是混合複合線束。
銅和樹脂價格波動導致利潤率承壓
在傳統線束中,銅佔組件成本的一半以上,而近期的價格波動正在擠壓供應商的毛利率。雖然大多數Line-Fit合約都包含價格轉嫁條款,但汽車製造商越來越不願意在生產週期中期接受價格上漲。因此,供應商正透過在商品交易所進行避險或轉向鋁材等方式分散風險。這種情況凸顯出,在確保盈利,精密的財務設計和籌資策略與核心工程技術同等重要。
細分市場分析
預計到2025年,汽車線束市場規模中,車身、照明和座艙舒適系統將佔最大佔有率,達到35.35%。 LED燈、電動尾門和多區域自動空調模組的高普及率是推動這項持續需求的主要因素。值得注意的是,這些舒適性配置在提升銷售量的同時,也增加了車輛最終組裝的複雜性,因此汽車製造商需要預先配置的子線束,以便直接插入儀表板或車門面板。
預計到2031年,充電和電源系統線束的複合年成長率將達到25.44%,成為成長最快的市場。隨著電動車車型在經銷商的普及,預計該市場將維持15%左右的成長率。由於這些線束必須承受電池組周圍溫度的快速升高和機械振動,高性能絕緣材料正逐漸成為主流。掌握液冷套管和超薄屏蔽技術的供應商將能夠以更高的價格銷售產品。未來,高壓佈線的專業知識可望為交叉銷售電池管理系統奠定基礎。
銅憑藉其無與倫比的導電性和百年製造經驗,仍佔據汽車線束市場約93.45%的佔有率。然而,其高密度和價格波動正迫使OEM採購部門尋找替代材料。一種新的趨勢正在引起關注:將銅數據線對和鋁電源線芯捆綁在同一主幹線束中,以在不影響訊號完整性的前提下減輕重量。
預計到2031年,鋁的複合年成長率將達到11.95%,輕鬆超過汽車線束產業的整體成長速度。耐腐蝕端子和摩擦焊接連接技術的進步緩解了以往的可靠性擔憂。由於鋁的價格比銅更穩定,財務部門擴大將其用作對沖工具。這種轉變表明,在主要供應商中,材料科學的選擇正與財務風險管理策略直接掛鉤。
區域分析
亞太地區約佔汽車線束市場佔有率的48.40%,且銷售成長速度最快。中國憑藉其龐大的輕型汽車產量和強大的電動車供應鏈,在該地區扮演著核心角色;而日本和韓國則在數據和高壓應用領域貢獻了先進的研發能力。印度和東南亞各國政府對電氣化的獎勵表明,即使全球經濟成長趨於正常化,該地區的需求仍將保持強勁。值得注意的是,多家中國汽車製造商正向歐洲出口電動車,這些車輛需要符合歐盟監管標準的統一線束規範,因此,亞洲供應商也必須符合全球合規標準。
預計2026年至2031年間,非洲將以11.79%的複合年成長率(CAGR)達到最高水準。具競爭力的人事費用、透過與歐盟的貿易協定所獲得的市場准入以及政府的產業園區政策,正吸引新的線束投資。多家歐洲一級企業正在將勞動密集型子組裝生產線設在該地區,使其能夠專注於本地工廠的自動化流程。針對當地工人的電纜壓接和品質檢驗技能提升項目正在湧現,這表明人力資本策略與區域成長密切相關。
儘管北美和歐洲的成長速度較慢,但它們仍然處於技術前沿。以區域為基礎的架構先導計畫主要集中在德國豪華品牌和北美電動車新創公司,慕尼黑、斯圖加特和矽谷的設計中心成為下一代線束概念的研發樞紐。這一趨勢表明,智慧財產權的創造正逐漸與勞動密集型生產脫鉤。這進一步加劇了「世界兩極化」的局面,研發叢集在汽車製造商總部附近形成,而大規模生產組裝流程則轉移到成本最優的地區。
其他好處:
- Excel格式的市場預測(ME)表
- 3個月的分析師支持
目錄
第1章:引言
- 調查範圍
第2章:調查方法
第3章執行摘要
第4章 市場狀況
- 市場促進因素
- 亞洲地區電氣化進程帶動高壓線束需求激增
- 原始設備製造商正在推廣輕量化鋁製和光纖線束。
- 豪華車向集中式電子電氣架構過渡(歐盟)
- 美國、日本關於ADAS佈線冗餘的監管要求
- 提高在地採購率將促進本地線束生產(印度、墨西哥)。
- 自動駕駛汽車的發展推動了冗餘電路架構的發展。
- 市場限制因素
- 銅和樹脂價格波動導致利潤率承壓
- 電動車特有的熱設計和電磁相容性挑戰正在推高檢驗成本。
- 設計複雜性與熟練勞動力供應之間的不匹配(東協)
- 製造自動化技術的限制限制了生產效率的提升。
- 價值/供應鏈分析
- 監管和技術展望
- 波特五力模型
- 供應商的議價能力
- 買方的議價能力
- 新進入者的威脅
- 替代品的威脅
- 競爭公司之間的競爭
第5章 市場規模與成長預測
- 透過使用
- 點火器系統
- 充電和電源系統
- 傳動系統和動力傳動系統(內燃機)
- 高壓牽引線束(xEV)
- 資訊娛樂系統、駕駛座、車載資訊系統
- ADAS和安全控制
- 車身、照明、座艙舒適性
- 按導體材料
- 銅
- 鋁
- 按額定電壓
- 低電壓(低於 60 伏特)
- 高壓(60-1000伏特)
- 依推進類型
- 內燃機車
- 電池式電動車
- 插電式混合動力汽車和混合動力汽車
- 車輛類型
- 搭乘用車
- 輕型商用車
- 大型卡車和巴士
- 按銷售管道
- OEM
- 售後市場
- 按地區
- 北美洲
- 美國
- 加拿大
- 北美其他地區
- 歐洲
- 德國
- 英國
- 法國
- 西班牙
- 俄羅斯
- 其他歐洲地區
- 亞太地區
- 中國
- 日本
- 印度
- 韓國
- 亞太其他地區
- 中東
- GCC
- 土耳其
- 其他中東國家
- 非洲
- 南非
- 埃及
- 其他非洲地區
- 南美洲
- 巴西
- 阿根廷
- 南美洲其他地區
- 北美洲
第6章 競爭情勢
- 策略舉措
- 市佔率分析
- 公司簡介
- Yazaki Corporation
- Sumitomo Electric Industries Ltd.
- LEONI AG
- Lear Corporation
- Motherson Wiring Harness Ltd.
- Furukawa Electric Co. Ltd.
- Fujikura Ltd.
- Kyungshin Corporation
- Draexlmaier Group
- Kromberg & Schubert
- Nexans Autoelectric
- PKC Group(Motherson)
- Coroplast Fritz Muller GmbH & Co.
- THB Group
- Prestolite Wire LLC
- Lear Yangzhou(China)
- Guangdong Hivolt Wiring Harness
- BizLink Holding Inc.
- Shanghai Shenglong Automotive Harness
- Samvardhana Motherson Reydel
- Korea Electric Terminal Co.
第7章 市場機會與未來展望
Automotive Wiring Harness Market size in 2026 is estimated at USD 84.5 billion, growing from 2025 value of USD 76.69 billion with 2031 projections showing USD 137.17 billion, growing at 10.18% CAGR over 2026-2031.
The market is expanding steadily on the back of rising electronic content per vehicle, but the headline growth masks two contrasting currents: demand for high-voltage harnesses used in battery-electric vehicles is rising at a double-digit pace, while traditional low-voltage ICE looms are seeing price compression. Regionally, Asia remains the production and consumption hub, Africa is attracting new capacity thanks to favorable labor economics and local-content rules, and mature markets in North America and Europe are pivoting toward zonal electrical architectures that shorten cable runs yet increase the value of each remaining line.
Global Automotive Wiring Harness Market Trends and Insights
Electrification-Driven Surge in High-Voltage Harness Demand
Rising battery pack voltages to 800 V and even 1000 V are spurring a new class of cable assemblies that carry greater thermal loads while meeting tight electromagnetic-compatibility (EMC) targets. Many Chinese brands now specify aluminum-based conductors for main traction lines, directly linking material innovation to EV cost reduction. Because aluminum requires revised joining techniques, suppliers are investing in friction and laser welding cells at a pace unseen five years ago. An emerging inference is that welding know-how may soon overshadow raw copper sourcing as the key competitive barrier.
OEM Push for Lightweight Aluminum and Optical Harnesses
Automakers continue to chase every gram of weight saving, and wiring can account for more than 20 kg in premium cars. Aluminum conductors slash mass by roughly 60% relative to copper and also cut exposure to copper-price swings. The downside-lower conductivity-is being offset through multi-strand designs and bimetal terminals that keep contact resistance within specification. As connection technology matures, several OEMs have introduced mixed conductor looms that pair aluminum power lines with optical fibres for data, hinting that the next frontier will lie in hybrid composite bundles rather than single-metal solutions.
Margin Pressure from Volatile Copper and Resin Prices
Copper accounts for well over half of total bill-of-materials cost in a conventional loom, so recent price gyrations have compressed supplier gross margin. Although most line-fit contracts include pass-through clauses, automakers are increasingly reluctant to accept mid-cycle price increases. Suppliers are therefore hedging on commodity exchanges and diversifying into aluminum as a risk-spreading measure. The situation underscores that financial engineering and procurement sophistication are becoming as important as core engineering in safeguarding profitability.
Other drivers and restraints analyzed in the detailed report include:
- Shift Toward Centralized Zonal E/E Architectures in Premium Cars
- Regulatory Mandates for ADAS Wiring Redundancy
- EV-Specific Thermal and EMC Challenges Raising Validation Costs
For complete list of drivers and restraints, kindly check the Table Of Contents.
Segment Analysis
Body, Lighting, and Cabin Comfort systems command the largest share of the Automotive Wiring Harness market size in 2025, accounting for 35.35% of the market size. High LED adoption, power lift-gates, and multi-zone climate modules explain persistent demand. An interesting observation is that the same comfort features that boost volume also complicate final vehicle assembly, nudging OEMs to request pre-configured sub-looms that snap into dashboards and door panels.
Charging and power supply system harnesses show the fastest forecast CAGR expanding at an 25.44% through 2031, expanding in the mid-teens as more electric models reach showrooms. These harnesses must endure temperature spikes and mechanical vibration around battery packs, so higher-grade insulation materials are becoming mainstream. Suppliers that master liquid-cooling sleeves and low-profile shielding will likely command premium price points. Over time, expertise in high-voltage routing may provide cross-selling entry into battery management systems.
Copper retains around 93.45% of the Automotive Wiring Harness market share today, supported by unmatched conductivity and a century of process know-how. Yet its density and volatile cost profile keep pressure on OEM purchasing departments to pursue alternatives. An emerging pattern is the bundling of copper data pairs with aluminum power cores in the same trunk line, achieving weight reduction without sacrificing signal integrity.
Aluminum's forecast CAGR is 11.95% by 2031, easily outpacing the broader Automotive Wiring Harness industry trajectory. Advances in anti-corrosion terminals and friction-weld splice techniques have removed earlier reliability concerns. Because aluminum is price-stable relative to copper, finance teams increasingly model its use as a hedge. The shift indicates that material science choices now intersect directly with treasury risk management strategies inside large suppliers.
The Automotive Wiring Harness Market Report is Segmented by Application Type (Ignition System, and More), Conductor Material (Copper, and More), Voltage Rating (Low-Voltage [less Than 60V] and More), Propulsion Type (Internal Combustion Engine Vehicles and More), Vehicle Type (Passenger Cars and More), Sales Channel (OEM and More) and Geography. The Market Forecasts are Provided in Terms of Value (USD) and Volume (Units).
Geography Analysis
Asia Pacific holds almost 48.40% Automotive Wiring Harness market share and boasts the fastest absolute revenue expansion. China anchors the region through its vast light-vehicle output and deep EV supply chains, while Japan and South Korea contribute high-grade R&D for data and high-voltage applications. Government incentives for electrification in India and Southeast Asia suggest that regional demand will remain resilient even as global growth normalises. A noteworthy development is that multiple Chinese OEMs are exporting EVs to Europe, requiring harmonised wiring specifications that meet European Union regulatory norms and thus elevating Asia-based suppliers to global compliance standards.
Africa, records the highest CAGR of 11.79% between 2026-2031. Competitive labour costs, trade-agreement access to the European Union, and government industrial-park policies together attract fresh harness investment. Several European tier-1 firms are locating high-labour-content sub-assemblies in the region, freeing up home-market plants for automated processes. Local workforce up-skilling programs in cable crimping and quality inspection are emerging, indicating that human-capital strategy is entwined with regional growth.
North America and Europe grow more modestly but remain technology front-runners. Zonal architecture pilots are concentrated in German luxury brands and North American electric start-ups, so design offices in Munich, Stuttgart, and Silicon Valley serve as nerve centres for next-generation loom concepts. This pattern implies that intellectual property creation is decoupling from labour-intensive production. This reinforces the two-speed global footprint in which R&D clusters near OEM headquarters and large-batch assembly migrate to cost-optimised regions.
- Yazaki Corporation
- Sumitomo Electric Industries Ltd.
- LEONI AG
- Lear Corporation
- Motherson Wiring Harness Ltd.
- Furukawa Electric Co. Ltd.
- Fujikura Ltd.
- Kyungshin Corporation
- Draexlmaier Group
- Kromberg & Schubert
- Nexans Autoelectric
- PKC Group (Motherson)
- Coroplast Fritz Muller GmbH & Co.
- THB Group
- Prestolite Wire LLC
- Lear Yangzhou (China)
- Guangdong Hivolt Wiring Harness
- BizLink Holding Inc.
- Shanghai Shenglong Automotive Harness
- Samvardhana Motherson Reydel
- Korea Electric Terminal Co.
Additional Benefits:
- The market estimate (ME) sheet in Excel format
- 3 months of analyst support
TABLE OF CONTENTS
1 Introduction
- 1.1 Scope of the Study
2 Research Methodology
3 Executive Summary
4 Market Landscape
- 4.1 Market Drivers
- 4.1.1 Electrification-Driven Surge in High-Voltage Harness Demand (Asia)
- 4.1.2 OEM Push for Lightweight Aluminum & Optical Harnesses
- 4.1.3 Shift Toward Centralized Zonal E/E Architectures in Premium Cars (EU)
- 4.1.4 Regulatory Mandates for ADAS Wiring Redundancy (US, Japan)
- 4.1.5 Rising Local Content Rules Fueling Wire-Harness Localization (India, Mexico)
- 4.1.6 Autonomous Vehicle Development Driving Redundant Circuit Architectures
- 4.2 Market Restraints
- 4.2.1 Margin Pressure From Volatile Copper & Resin Prices
- 4.2.2 EV-Specific Thermal & EMC Challenges Raising Validation Costs
- 4.2.3 Mismatch Between Design Complexity & Skilled Labor Availability (ASEAN)
- 4.2.4 Manufacturing Automation Limitations Constraining Productivity Gains
- 4.3 Value / Supply-Chain Analysis
- 4.4 Regulatory & Technological Outlook
- 4.5 Porter's Five Forces
- 4.5.1 Bargaining Power of Suppliers
- 4.5.2 Bargaining Power of Buyers
- 4.5.3 Threat of New Entrants
- 4.5.4 Threat of Substitutes
- 4.5.5 Intensity of Competitive Rivalry
5 Market Size & Growth Forecasts (Value, USD)
- 5.1 By Application
- 5.1.1 Ignition System
- 5.1.2 Charging & Power Supply System
- 5.1.3 Drivetrain & Powertrain (ICE)
- 5.1.4 High-Voltage Traction Harness (xEV)
- 5.1.5 Infotainment, Cockpit & Telematics
- 5.1.6 ADAS & Safety Control
- 5.1.7 Body, Lighting & Cabin Comfort
- 5.2 By Conductor Material
- 5.2.1 Copper
- 5.2.2 Aluminum
- 5.3 By Voltage Rating
- 5.3.1 Low-Voltage (<60 V)
- 5.3.2 High-Voltage (60-1,000 V)
- 5.4 By Propulsion Type
- 5.4.1 Internal Combustion Engine Vehicles
- 5.4.2 Battery Electric Vehicles
- 5.4.3 Plug-in Hybrid & Hybrid Vehicles
- 5.5 By Vehicle Type
- 5.5.1 Passenger Cars
- 5.5.2 Light Commercial Vehicles
- 5.5.3 Heavy-duty Trucks & Buses
- 5.6 By Sales Channel
- 5.6.1 OEM
- 5.6.2 Aftermarket
- 5.7 By Geography
- 5.7.1 North America
- 5.7.1.1 United States
- 5.7.1.2 Canada
- 5.7.1.3 Rest of North America
- 5.7.2 Europe
- 5.7.2.1 Germany
- 5.7.2.2 United Kingdom
- 5.7.2.3 France
- 5.7.2.4 Spain
- 5.7.2.5 Russia
- 5.7.2.6 Rest of Europe
- 5.7.3 Asia Pacific
- 5.7.3.1 China
- 5.7.3.2 Japan
- 5.7.3.3 India
- 5.7.3.4 South Korea
- 5.7.3.5 Rest of Asia Pacific
- 5.7.4 Middle East
- 5.7.4.1 GCC
- 5.7.4.2 Turkey
- 5.7.4.3 Rest of Middle East
- 5.7.5 Africa
- 5.7.5.1 South Africa
- 5.7.5.2 Egypt
- 5.7.5.3 Rest of Africa
- 5.7.6 South America
- 5.7.6.1 Brazil
- 5.7.6.2 Argentina
- 5.7.6.3 Rest of South America
- 5.7.1 North America
6 Competitive Landscape
- 6.1 Strategic Initiatives
- 6.2 Market Share Analysis
- 6.3 Company Profiles
- 6.3.1 Yazaki Corporation
- 6.3.2 Sumitomo Electric Industries Ltd.
- 6.3.3 LEONI AG
- 6.3.4 Lear Corporation
- 6.3.5 Motherson Wiring Harness Ltd.
- 6.3.6 Furukawa Electric Co. Ltd.
- 6.3.7 Fujikura Ltd.
- 6.3.8 Kyungshin Corporation
- 6.3.9 Draexlmaier Group
- 6.3.10 Kromberg & Schubert
- 6.3.11 Nexans Autoelectric
- 6.3.12 PKC Group (Motherson)
- 6.3.13 Coroplast Fritz Muller GmbH & Co.
- 6.3.14 THB Group
- 6.3.15 Prestolite Wire LLC
- 6.3.16 Lear Yangzhou (China)
- 6.3.17 Guangdong Hivolt Wiring Harness
- 6.3.18 BizLink Holding Inc.
- 6.3.19 Shanghai Shenglong Automotive Harness
- 6.3.20 Samvardhana Motherson Reydel
- 6.3.21 Korea Electric Terminal Co.
7 Market Opportunities & Future Outlook
- 7.1 White-space & Unmet-Need Assessment
 汽車線束系統市場規模、佔有率和成長分析:按組件、線束類型、材質、車輛類型、銷售管道和地區分類-2026-2033年產業預測
 汽車二次線束市場:依車輛類型、絕緣材料、導體材料、應用和最終用途分類-2026-2032年全球市場預測
 汽車線束市場規模、佔有率和成長分析:按導體材料、驅動系統、銷售管道、應用和地區分類-2026-2033年產業預測汽車線束市場:按組件、線束類型、材質、電壓、車輛類型、最終用戶產業和最終用戶分類-2026-2032年全球市場預測商用車線束市場:按組件、材質、推進系統、車輛類型、應用和銷售管道分類-2026-2032年全球市場預測
 汽車線束市場:市場規模、佔有率、成長率、全球產業分析、按類型、應用和地區分類的分析以及未來預測(2026-2034 年)
 汽車線束市場規模、佔有率、趨勢和預測:按應用、材質、變速箱類型、車輛類型、類別、組件和地區分類,2026-2034 年2026-2034年全球汽車線束市場規模、佔有率、趨勢和成長分析報告
 2026年全球汽車線束市場報告
 汽車二次線束市場 - 全球產業規模、佔有率、趨勢、機會及預測(按車輛類型、應用、地區和競爭格局分類,2021-2031年)