


 |
市場調查報告書
商品編碼
2035038
資料中心:市場佔有率分析、產業趨勢與統計、成長預測(2026-2031)Data Center - Market Share Analysis, Industry Trends & Statistics, Growth Forecasts (2026 - 2031) |
||||||

※ 本網頁內容可能與最新版本有所差異。詳細情況請與我們聯繫。
2025 年資料中心市場價值為 3,867.1 億美元,預計在預測期(2026-2031 年)內將以 9.98% 的複合年成長率成長,從 2026 年的 4253 億美元成長到 2031 年的 6843.9 億美元。
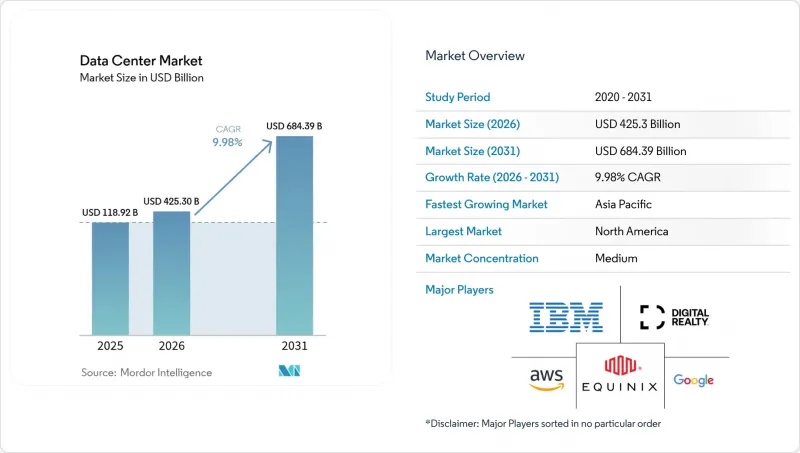
就部署規模而言,預計市場將從2025年的118,920兆瓦成長到2030年的240,050兆瓦,預測期間(2025-2030年)的複合年成長率(CAGR)為15.08%。市場佔有率和預測均以兆瓦(MW)為單位計算和報告。這一成長軌跡反映了人工智慧(AI)工作負載的激增、邊緣節點的快速部署以及資本密集型超大規模園區正在改變數位基礎設施的經濟格局。企業計算正轉向需要液冷的高密度機架,而電力採購正成為選址的決定性因素。能夠獲得大規模低碳電力的營運商正在獲得巨大的市場需求,尤其是來自使用金融服務和生成式人工智慧的租戶。監管機構對資料居住和碳排放報告的日益關注,正推動新增容量流向二線都會區和可再生能源豐富的地區,從而加劇資料中心市場的地域分散。
全球資料中心市場趨勢與洞察
人工智慧和GPU密集型工作負載的爆炸性成長
隨著大規模語言模型訓練叢集的激增,機架密度正從 8-12 千瓦提升至 120 千瓦。營運商正在標準化液冷和浸沒式冷卻技術,安裝專用變電站,並設計可實現千兆瓦級擴展的園區級資料中心。亞馬遜承諾投入 1500 億美元用於人工智慧最佳化容量,這清楚地展現了當前所需的電力和房地產規模。能夠提供低延遲、高密度電力傳輸和容錯冷卻架構相結合的服務的供應商正在獲得競爭優勢,進一步強化了資料中心市場的整合趨勢。
雲端運算和數位轉型的快速普及
企業正從簡單的遷移轉向依賴分散式處理的雲端原生微服務。金融機構正在對其支付和詐欺偵測平台進行現代化改造,持續推動連接多個雲端入口的中立營運商託管服務的需求。新興市場的資料隱私法規正在推動本地設施的擴張,而混合雲端策略則促使託管合約期限延長,以維持資料中心市場的互聯互通。
電力短缺和電費飆升
由於電網限制,在電力容量緊張的地區,併網核准往往延遲三年以上。電力公司正努力加快變電站升級改造,以滿足高耗能園區的需求,而尖峰時段的收費系統也進一步壓縮了營運商的利潤空間。開發商正透過簽訂購電協議(PPA)來應對,採購現場發電、電池儲能、可再生能源和小型模組化反應器(SMR)等設施,但前置作業時間和法規核准仍然是資料中心市場面臨的主要障礙。
細分市場分析
總體而言,儘管大型資料中心在2025年佔據了60.10%的收入佔有率,但在預測期(至2031年)內,容量在10至50兆瓦之間的中型資料中心仍錄得最高的複合年成長率(CAGR),達到12.08%。這些中型資料中心兼顧了人工智慧叢集所需的高密度機架和快速部署,因此對需要可擴充性且靈活面積的雲端服務和金融科技租戶極具吸引力。該細分市場的成長表明,整個資料中心市場正在發生結構性轉變,朝著容量規模合適的節點發展。
這一趨勢因專門設計的園區而進一步增強,這些園區整合了液冷機架、現場電池儲能和可再生能源微電網,使營運商能夠在不犧牲功率密度的前提下實現永續發展目標。隨著超大規模企業透過多元化選址來緩解電網壓力,中型資料中心提供了一種過渡性解決方案,既能縮短資料中心市場的商業化時間,又能保持擴展性。
2025年,三級資料中心支出佔總支出的59.10%,但預計到2031年,四級資料中心的收入將超過三級資料中心,年複合成長率(CAGR)為14.31%。演算法交易、數位銀行和人工智慧模型訓練對零停機時間的要求,使得2N+1冗餘帶來的25%資本支出溢價成為合理之選。這些要求提高了准入門檻,並將需求集中在有能力資金籌措的供應商身上,從而導致資料中心市場規模層級中四級資料中心的市場佔有率發生轉移。
新興經濟體的成長尤其顯著,這主要得益於新規的推動,這些新規要求國家支付系統和主權人工智慧工作負載必須具備容錯能力。早期獲得Tier 4認證的供應商正享有顯著的定價權,並隨著企業將其關鍵業務應用程式遷移到資料中心市場中經過認證的設施,建立起強大的競爭優勢。
本資料中心市場報告按資料中心規模(大型、超大型、中型、巨型、小規模)、層級(Tier 1 和 Tier 2、Tier 3、Tier 4)、資料中心類型(超大規模/本地部署、企業/邊緣、託管)、最終用戶(銀行、金融服務和保險 (BFSI)、IT 和 ITES、電子商務、政府、製造業、媒體和娛樂地區進行。市場預測以 IT 負載容量 (MW) 為單位。
區域分析
北美在2025年仍維持35.10%的市場佔有率,主要得益於維吉尼亞北部、達拉斯和鳳凰城周邊成熟的超大規模資料中心生態系統。儘管包括區域電力公司28.2億美元投資在內的電網升級旨在開闢新的兆瓦級供電能力,但部分子市場的互聯延遲仍超過三年。營運商正將業務拓展至俄亥俄州、密蘇裡州等可再生能源資源豐富的州以及加拿大各省,從而將資料中心市場的未來擴張範圍擴大到更廣闊的地域。
亞太地區預計將實現最高成長率,複合年成長率達11.34%,這主要得益於政府主導的人工智慧計畫、電子商務的蓬勃發展以及數據在地化相關立法。過去18個月,印度的託管資料中心規模加倍,達到約1吉瓦,其中雅加達、吉隆坡和大阪等城市的裝置容量超過300兆瓦。印度優先考慮個人資料國內儲存的國家政策以及對可再生能源採購的獎勵持續吸引外國直接投資,鞏固了該地區作為資料中心市場需求不斷成長的中心地位。
歐洲、中東和非洲的情況各不相同。歐洲主要樞紐城市面臨土地和電力短缺的困境,發展重點正轉向馬德里、米蘭和華沙。同時,阿拉貢等可再生能源資源豐富的地區正吸引著千兆級資料中心園區,其中包括由國際營運商投資的300兆瓦專案。海灣國家正利用低碳電力和數位化政策來確保超大規模資料中心的建設,而非洲主要城市則透過鋪設新的海底光纜來保障容量,逐步將非洲大陸融入全球雲端基礎設施,這將重塑資料中心市場格局。
其他好處:
- Excel格式的市場預測(ME)表
- 3個月的分析師支持
目錄
第1章:引言
- 研究假設和市場定義
- 調查範圍
第2章:調查方法
第3章執行摘要
第4章 市場狀況
- 市場概覽
- 市場促進因素
- 人工智慧和GPU密集型工作負載的爆炸性成長
- 雲端運算和數位轉型的快速普及
- 對邊緣運算和低延遲5G的需求激增
- 擴大海底電纜鋪設範圍,可以釋放沿海次要地區的潛力。
- 現場小型模組化反應器發電購電協議模型
- 新興市場中符合排碳權的維修
- 市場限制因素
- 電力短缺和電費飆升
- 一線城市中心地區的土地徵用和授權瓶頸
- 對先進加速器的出口限制
- 變壓器和開關設備的前置作業時間正在延長。
- 市場展望
- IT負載能力
- 高架地板面積
- 託管收入
- 已安裝機架
- 機架空間利用率
- 海底電纜
- 主要行業趨勢
- 智慧型手機用戶
- 每部智慧型手機的數據流量
- 行動資料通訊速度
- 寬頻資料通訊速度
- 光纖網路
- 法律規範
- 價值鍊和通路分析
- 波特五力分析
- 新進入者的威脅
- 買方的議價能力
- 供應商的議價能力
- 替代品的威脅
- 競爭公司之間的競爭
第5章 市場規模及成長預測(兆瓦)
- 按資料中心規模
- 大規模
- 巨大的
- 中號
- 百萬
- 小規模
- 層級類型
- 一級和二級
- 三級
- 第四級
- 依資料中心類型
- 超大規模/自建
- 企業/邊緣運算
- 搭配
- 未使用
- 使用
- 零售共址
- 批發託管
- 最終用戶
- BFSI
- 資訊科技與資訊科技服務
- 電子商務
- 政府
- 製造業
- 媒體與娛樂
- 溝通
- 其他最終用戶
- 按地區
- 北美洲
- 南美洲
- 歐洲
- 亞太地區
- 中東和非洲
第6章 競爭情勢
- 市場集中度
- 策略趨勢
- 市佔率分析
- 公司簡介
- Amazon Web Services, Inc.
- Google Inc.
- Microsoft Corporation
- Digital Realty Trust, Inc.
- CloudHQ
- CyrusOne
- Digital Bridge(Formely known as Switch)
- Stack Infrastructure
- QTS Realty Trust, LLC
- Quality Technology Services
- Equinix Inc
- Chindata Group Holdings Ltd
- Menlo Equities LLC
- Alibaba Cloud
- IBM Corporation
第7章 市場機會與未來展望
The Data Center Market size was valued at USD 386.71 billion in 2025 and estimated to grow from USD 425.3 billion in 2026 to reach USD 684.39 billion by 2031, at a CAGR of 9.98% during the forecast period (2026-2031).
In terms of installed base, the market is expected to grow from 118.92 thousand megawatt in 2025 to 240.05 thousand megawatt by 2030, at a CAGR of 15.08% during the forecast period (2025-2030). The market segment shares and estimates are calculated and reported in terms of MW. This trajectory reflects surging artificial-intelligence workloads, the rapid build-out of edge nodes, and capital-intensive hyperscale campuses that are transforming digital infrastructure economics. Enterprise computing is migrating toward high-density racks that require liquid cooling, while power procurement is emerging as the decisive site-selection variable. Operators able to secure low-carbon electricity at scale are capturing outsized demand, especially from financial-services and generative-AI tenants. Heightened regulatory focus on data residency and carbon reporting is steering new capacity toward secondary metros and renewable-rich regions, widening geographic dispersion across the data center market.
Global Data Center Market Trends and Insights
AI and GPU-Intensive Workloads Explosion
Rack densities are escalating from 8-12 kW toward 120 kW as training clusters for large-language models proliferate. Operators are standardizing liquid and immersion cooling, installing dedicated substations, and designing campus-scale sites capable of multi-gigawatt expansion. Capital-spending commitments such as Amazon's USD 150 billion, targeted at AI-optimized capacity, illustrate the scale of electricity and real estate now required Competitive advantage accrues to providers that can deliver low-latency, high-density power coupled with fault-tolerant cooling architectures, reinforcing consolidation trends across the data center market.
Rapid Cloud and Digital-Transformation Adoption
Enterprises have shifted from lift-and-shift migrations to cloud-native microservices that rely on distributed processing. Financial institutions are modernizing payment and fraud-detection platforms, generating sustained demand for carrier-neutral colocation connected to multiple cloud on-ramps. Data-privacy mandates in emerging economies are stimulating local build-outs, while hybrid-cloud strategies are lengthening colocation contract terms to preserve interconnection optionality across the data center market.
Grid Power Shortages and Rising Electricity Costs
Transmission constraints are delaying interconnection approvals beyond three years in capacity-congested regions. Utilities struggle to upgrade substations fast enough to serve megawatt-hungry campuses, and peak-hour tariffs are compressing operator margins. Developers are responding with on-site generation, battery storage, and power-purchase agreements for renewable and small-modular-reactor capacity, yet lead times and regulatory certification remain formidable obstacles across the data center market.
Other drivers and restraints analyzed in the detailed report include:
- Edge and 5G Low-Latency Demand Wave
- Submarine-Cable Build-Out Unlocks Secondary Coasts
- Land and Permitting Bottlenecks in Tier-1 Hubs
For complete list of drivers and restraints, kindly check the Table Of Contents.
Segment Analysis
Medium-sized sites, generally 10-50 MW, accounted for the fastest 12.08% CAGR forecast through 2031 even though large campuses maintained 60.10% of 2025 revenue. These facilities balance rapid deployment with the high-density racks demanded by AI clusters, making them attractive to cloud and FinTech tenants that require scalable but flexible footprints. The segment's growth underscores a structural pivot toward right-sized capacity nodes throughout the data center market size landscape.
This momentum is reinforced by purpose-built campuses that integrate liquid-cooled racks, on-site battery storage, and renewable microgrids, enabling operators to meet sustainability targets without sacrificing power density. As hyperscale companies diversify site selection to mitigate grid constraints, medium facilities provide an interim solution that preserves expansion optionality and accelerates time to revenue in the data center market.
Tier 4 revenues are projected to outpace Tier 3 with a 14.31% CAGR to 2031 even though Tier 3 captured 59.10% of 2025 spending. Zero-downtime requirements for algorithmic trading, digital banking, and AI model training justify the 25% capital-expenditure premium associated with 2N+1 redundancy. These specifications lift barriers to entry and concentrate demand among providers capable of financing high-availability builds, thereby shifting share toward Tier 4 within the data center market size hierarchy.
Growth is especially strong in emerging economies where newly issued regulations demand fault-tolerant infrastructure for national payment systems and sovereign-AI workloads. Operators gaining early Tier 4 accreditation enjoy outsized pricing power and establish durable competitive moats as enterprises migrate mission-critical applications to certified facilities inside the data center market.
The Data Center Market Report is Segmented by Data Center Size (Large, Massive, Medium, Mega, and Small), Tier Type (Tier 1 and 2, Tier 3, and Tier 4), Data Center Type (Hyperscale/Self-built, Enterprise/Edge, and Colocation), End User (BFSI, IT and ITES, E-Commerce, Government, Manufacturing, Media and Entertainment, Telecom, and More), and Geography. The Market Forecasts are Provided in Terms of IT Load Capacity (MW).
Geography Analysis
North America preserved 35.10% 2025 share on the strength of mature hyperscale ecosystems around Northern Virginia, Dallas, and Phoenix. Transmission upgrades, such as a USD 2.82 billion commitment by regional utilities, aim to unlock new megawatt blocks, yet interconnection queues still exceed three years in some submarkets. Operators are extending footprints into Ohio, Missouri, and Canadian provinces rich in renewables, thereby spreading future additions across a wider geography within the data center market.
Asia-Pacific exhibits the fastest 11.34% CAGR outlook, fueled by sovereign-AI ambitions, e-commerce adoption, and data-localization statutes. India's colocation footprint doubled to roughly 1 GW over the past 18 months, while Jakarta, Kuala Lumpur, and Osaka each surpassed 300 MW installed. National policies prioritizing domestic storage of personal data and incentives for renewable power procurement continue to draw foreign direct investment, reinforcing the region's position as the epicenter of incremental demand in the data center market.
Europe, Middle East, and Africa display mixed dynamics. Core European hubs confront land and power constraints, redirecting development toward Madrid, Milan, and Warsaw. Simultaneously, renewable-rich regions such as Aragon are attracting giga-scale campuses, including a 300 MW commitment financed by international operators. Gulf states leverage low-carbon power and pro-digital agendas to win hyperscale builds, while African metros secure capacity alongside new submarine cable landings, gradually knitting the continent into global cloud fabrics shaping the data center market.
List of Companies Covered in this Report:
- Amazon Web Services, Inc.
- Google Inc.
- Microsoft Corporation
- Digital Realty Trust, Inc.
- CloudHQ
- CyrusOne
- Digital Bridge (Formely known as Switch)
- Stack Infrastructure
- QTS Realty Trust, LLC
- Quality Technology Services
- Equinix Inc
- Chindata Group Holdings Ltd
- Menlo Equities LLC
- Alibaba Cloud
- IBM Corporation
Additional Benefits:
- The market estimate (ME) sheet in Excel format
- 3 months of analyst support
TABLE OF CONTENTS
1 INTRODUCTION
- 1.1 Study Assumptions and Market Definition
- 1.2 Scope of the Study
2 RESEARCH METHODOLOGY
3 EXECUTIVE SUMMARY
4 MARKET LANDSCAPE
- 4.1 Market Overview
- 4.2 Market Drivers
- 4.2.1 AI and GPU-Intensive Workloads Explosion
- 4.2.2 Rapid Cloud and Digital-Transformation Adoption
- 4.2.3 Edge and 5G Low-Latency Demand Wave
- 4.2.4 Submarine-Cable Build-Out Unlocks Secondary Coasts
- 4.2.5 On-Site SMR Power PPA Models
- 4.2.6 Carbon-Credit Retrofits in Emerging Markets
- 4.3 Market Restraints
- 4.3.1 Grid Power Shortages and Rising Electricity Costs
- 4.3.2 Land and Permitting Bottlenecks in Tier-1 Hubs
- 4.3.3 Export Controls on Advanced Accelerators
- 4.3.4 Transformer and Switchgear Lead-Time Inflation
- 4.4 Market Outlook
- 4.4.1 IT Load Capacity
- 4.4.2 Raised Floor Space
- 4.4.3 Colocation Revenue
- 4.4.4 Installed Racks
- 4.4.5 Rack Space Utilization
- 4.4.6 Submarine Cable
- 4.5 Key Industry Trends
- 4.5.1 Smartphone Users
- 4.5.2 Data Traffic Per Smartphone
- 4.5.3 Mobile Data Speed
- 4.5.4 Broadband Data Speed
- 4.5.5 Fiber Connectivity Network
- 4.5.6 Regulatory Framework
- 4.6 Value Chain and Distribution Channel Analysis
- 4.7 Porter's Five Forces Analysis
- 4.7.1 Threat of New Entrants
- 4.7.2 Bargaining Power of Buyers
- 4.7.3 Bargaining Power of Suppliers
- 4.7.4 Threat of Substitutes
- 4.7.5 Intensity of Competitive Rivalry
5 MARKET SIZE AND GROWTH FORECASTS (MW)
- 5.1 By Data Center Size
- 5.1.1 Large
- 5.1.2 Massive
- 5.1.3 Medium
- 5.1.4 Mega
- 5.1.5 Small
- 5.2 By Tier Type
- 5.2.1 Tier 1 and 2
- 5.2.2 Tier 3
- 5.2.3 Tier 4
- 5.3 By Data Center Type
- 5.3.1 Hyperscale / Self-built
- 5.3.2 Enterprise / Edge
- 5.3.3 Colocation
- 5.3.3.1 Non-Utilized
- 5.3.3.2 Utilized
- 5.3.3.2.1 Retail Colocation
- 5.3.3.2.2 Wholesale Colocation
- 5.4 By End User
- 5.4.1 BFSI
- 5.4.2 IT and ITES
- 5.4.3 E-Commerce
- 5.4.4 Government
- 5.4.5 Manufacturing
- 5.4.6 Media and Entertainment
- 5.4.7 Telecom
- 5.4.8 Other End Users
- 5.5 By Geography
- 5.5.1 North America
- 5.5.2 South America
- 5.5.3 Europe
- 5.5.4 Asia-Pacific
- 5.5.5 Middle East and Africa
6 COMPETITIVE LANDSCAPE
- 6.1 Market Concentration
- 6.2 Strategic Moves
- 6.3 Market Share Analysis
- 6.4 Company Profiles (includes Global level Overview, Market level overview, Core Segments, Financials as available, Strategic Information, Market Rank/Share for key companies, Products and Services, and Recent Developments)
- 6.4.1 Amazon Web Services, Inc.
- 6.4.2 Google Inc.
- 6.4.3 Microsoft Corporation
- 6.4.4 Digital Realty Trust, Inc.
- 6.4.5 CloudHQ
- 6.4.6 CyrusOne
- 6.4.7 Digital Bridge (Formely known as Switch)
- 6.4.8 Stack Infrastructure
- 6.4.9 QTS Realty Trust, LLC
- 6.4.10 Quality Technology Services
- 6.4.11 Equinix Inc
- 6.4.12 Chindata Group Holdings Ltd
- 6.4.13 Menlo Equities LLC
- 6.4.14 Alibaba Cloud
- 6.4.15 IBM Corporation
7 MARKET OPPORTUNITIES AND FUTURE OUTLOOK
- 7.1 White-space and Unmet-Need Assessment

 2026年全球光纖連接服務工具市場報告2026年全球行動雙倍數據速率(DDR)市場報告
 永續資料中心市場預測至2034年-全球分析(按組件、資料中心類型、容量、部署模式、永續發展舉措、冷卻技術、最終用戶和地區分類)
 2026-2030年全球資料中心市場
 全球資料中心市場:市場規模、佔有率、趨勢和成長分析(2026-2034 年)2026年全球智慧客戶資料中心市場報告2026年全球網路資料中心(IDC)市場報告2026年全球資料中心房地產市場報告
 資料中心市場:按組件、資料中心類型、層級、冷卻方式、電源、最終用戶和組織規模分類-2026年至2032年全球市場預測全球在軌資料中心市場預測(至2034年)-按平台、組件、系統、連接類型、應用、最終用戶和地區分類的分析