


 |
市場調查報告書
商品編碼
2035009
可觀測性:市場佔有率分析、產業趨勢與統計、成長預測(2026-2031 年)Observability - Market Share Analysis, Industry Trends & Statistics, Growth Forecasts (2026 - 2031) |
||||||
※ 本網頁內容可能與最新版本有所差異。詳細情況請與我們聯繫。
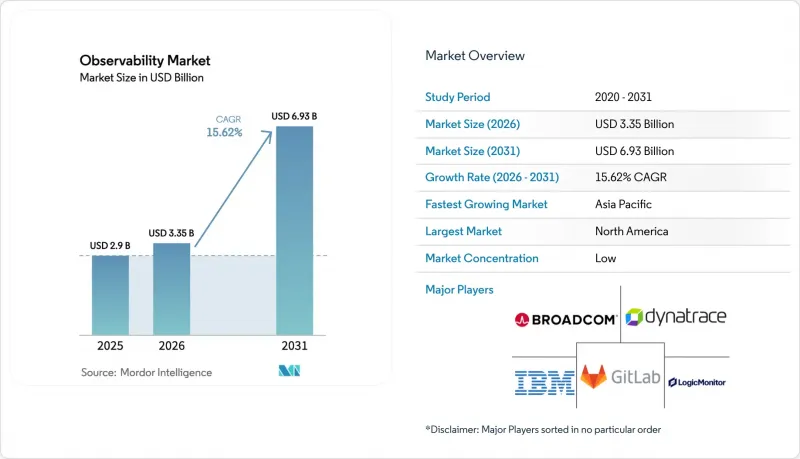
2025 年可觀測性市場價值 29 億美元,預計到 2031 年將達到 69.3 億美元,而 2026 年為 33.5 億美元,預測期(2026-2031 年)複合年成長率為 15.62%。
企業正從被動監控轉向主動可觀測性,以管理雲端原生、AI驅動和邊緣運算的工作負載。生成式AI、雲端快速採用和邊緣運算這三大技術浪潮凸顯,成為推動關鍵需求成長的催化劑。供應商若能將平台藍圖與這些趨勢保持一致,便可實現更高的收入成長,因為買家現在更重視詳細的可追溯性、即時AI模型洞察和延遲感知分析。隨著成熟的應用效能管理(APM)領導企業不斷增加AI可觀測性功能,競爭日益激烈;而新興專家則根據遙測總成本來定價。最後,永續發展法規促使人們更加關注採樣、智慧路由和低碳資料中心,這些都有助於實現基準效能目標。
全球可觀測性市場趨勢與洞察
AI原生測量功能可顯著降低平均修復時間。
自動化根本原因分析可與人工調查相輔相成,將事件解決速度提升高達 90%。 Flip 專注於 DevOps 的 LLM 展示了領域訓練的代理如何對重複出現的警報叢集,從而在級聯故障影響客戶之前進行預測。像 Capital One 這樣的金融機構正在採用 AI 遙測技術來增強詐欺偵測能力,從而將工程洞察與更高的合規性相結合。這些成果促使預算管理者將可觀測性視為一項競爭優勢,而不僅僅是一項不斷下降的營運成本。隨著可觀測性市場的不斷發展,整合基於代理的推理功能的供應商將能夠獲得更長期的契約,因為客戶更傾向於選擇能夠從即時數據中學習並自主解決事件的平台。
向分散式、事件驅動架構過渡
微服務和無伺服器架構產生的遙測資料量是單體系統的 50 到 100 倍,令傳統的監控後端不堪負荷。事件流、訊息佇列和非同步處理造成了資料盲區,迫使企業採用 OpenTelemetry 原生的關聯分析功能,將所有資料跨度與業務交易進行配對。電子商務和銀行業依靠這種可視性來保障收入,即使在尖峰負載下也是如此;而製造商則利用這種可視性來追蹤物聯網感測器和邊緣設備,以進行預測性維護。海量的遙測資料促使人們對管道過濾工具產生興趣,以控制儲存預算。這種架構轉變持續推動可觀測市場的發展,因為新的微服務通常會比它們所取代的元件添加更多的追蹤、日誌和指標。
可觀測資料的儲存成本不斷上升
對某些公司而言,遙測成本已超過主要基礎設施支出,迫使採購方採取積極的抽樣和保留策略。 AWS CloudWatch 使用者透過容器洞察最佳化,實現了高達 96.5% 的日誌成本降低。 90% 的財富 500 強企業中的 FinOps 團隊將可觀測性支出作為一項獨立的關鍵績效指標 (KPI) 進行追蹤。將資料擷取和即時過濾相結合的平台提供商,透過將成本管理作為產品功能,在可觀測性市場中獲得了競爭優勢。
細分市場分析
「服務」類以17.55%的複合年成長率呈現最快成長勢頭,而「解決方案」板塊即使在2025年仍保持71.30%的收入佔有率。這種構成比凸顯了企業需要諮詢和管理方面的專業知識,才能在結合平台軟體時釋放真正的價值。整合團隊負責設計OpenTelemetry管道、最佳化採樣,並將儀錶板與業務KPI保持一致,從而幫助企業超越基礎設施監控,轉向基於結果的分析。
在實踐中,複雜的部署涉及專業服務、持續調優的託管服務,以及將服務等級協定 (SLA) 違約與收入風險關聯起來的諮詢工作。由於企業內部的資料科學家通常不具備操作工具所需的技能,因此當人工智慧可觀測性被納入藍圖時,需求會激增。服務供應商完成建置階段後,客戶通常會透過啟用其他模組來擴展其使用規模,從而在部署後的幾年內推動可觀測性市場的成長。
預計到2025年,雲端/SaaS將佔總支出的68.40%,而混合環境預計將以20.12%的複合年成長率成長,這主要得益於數據居住監管要求的日益嚴格以及邊緣節點的普及。隨著買家尋求能夠將本地隔離與雲端的可擴展性相結合的解決方案來保護個人識別資訊(PII)和商業機密,混合部署中的可觀測性市場正在不斷擴大。
在金融服務業,通常的做法是將儀錶板集中部署在雲端,同時將原始日誌保存在地理位置隔離的叢集。然而,在製造業,為了避免上行鏈路擁塞,可觀測性部署在工廠車間的邊緣閘道器。能夠提供可在任何環境下運行資料擷取器的單一控制平面的供應商,可以在不造成工具重複的情況下滿足這些主權要求,因此,他們正透過提升銷售逐步擴大其在可觀測性市場的佔有率。
區域分析
預計到2025年,北美將佔全球支出的36.65%,這得益於早期採用浪潮、高雲端滲透率以及諸如SOX和HIPAA等強制執行監控要求的框架。金融公司正在對交易流程進行端到端的測量以滿足審計標準,而領先的科技公司則正在培育開放原始碼生態系統,以加速社區培訓。隨著企業最佳化其現有技術堆疊以適應人工智慧工作負載和邊緣擴展,以及可觀測性市場需求的持續強勁,預計成長將保持穩健。
亞太地區預計將以19.62%的複合年成長率成長,成為全球成長最快的地區。由於平均年度停機成本高達1,907萬美元,位居全球最高之列,企業主管被迫增加主動事件預防的投資。各國政府將數位主權置於優先地位,並日益要求採用混合部署模式,這推動了對能夠維護全球儀表板並實現資料在地化的多租戶平台的需求。日本、韓國和新加坡的通訊業者和先進製造工廠正在部署5G和工業4.0技術棧,產生大量遙測數據,為可觀測性市場做出了顯著貢獻。
在歐洲,受GDPR、歐盟人工智慧法規和永續發展政策的推動,市場呈現穩定成長態勢,這些因素促使企業投資於注重隱私權保護且碳效率高的遙測管道。企業傾向於採用混合拓撲結構,將敏感資料集保留在特定區域內。具備資料最小化、靜態加密和碳排放計算功能的供應商在競標脫穎而出,進一步凸顯了合規性在可觀測性市場的重要性。
其他好處:
- Excel格式的市場預測(ME)表
- 3個月的分析師支持
目錄
第1章:引言
- 研究假設和市場定義
- 調查範圍
第2章:調查方法
第3章執行摘要
第4章 市場狀況
- 市場概覽
- 市場促進因素
- AI原生測量功能可顯著降低平均修復時間。
- 向分散式、事件驅動架構過渡
- 用於雲端優先轉型的預算正在增加。
- OpenTelemetry 的標準化實現了與供應商無關的成長。
- 對用於即時模型可觀測性的生成式人工智慧的需求。
- 低延遲、全端可視性對於通訊業者的邊緣部署至關重要。
- 市場限制因素
- 可觀測性資料儲存成本不斷上升
- 工具鏈臃腫和供應商鎖定風險
- 可觀測性工程領域人員短缺
- 為減少遙測技術的碳足跡,永續發展面臨越來越大的壓力。
- 監理情勢
- 技術展望
- 波特五力分析
- 供應商的議價能力
- 買方的議價能力
- 新進入者的威脅
- 替代品的威脅
- 競爭公司之間的競爭
- 宏觀經濟趨勢的影響
第5章 市場規模與成長預測
- 按組件
- 解決方案
- 服務
- 部署模式
- 雲/SaaS
- 現場
- 混合
- 按公司規模
- 小型企業
- 大公司
- 按最終用戶行業分類
- 資訊科技和通訊
- BFSI
- 零售與電子商務
- 製造業
- 醫療保健和生命科學
- 政府/國防
- 其他終端用戶產業
- 透過使用
- DevOps 和 APM
- 基礎設施監控
- 安全與合規
- 數據可觀測性
- 商業分析
- 按地區
- 北美洲
- 美國
- 加拿大
- 墨西哥
- 南美洲
- 巴西
- 阿根廷
- 南美洲其他地區
- 歐洲
- 德國
- 英國
- 法國
- 西班牙
- 義大利
- 其他歐洲地區
- 亞太地區
- 中國
- 日本
- 印度
- 澳洲
- 韓國
- 亞太其他地區
- 中東
- 以色列
- 沙烏地阿拉伯
- 阿拉伯聯合大公國
- 土耳其
- 其他中東國家
- 非洲
- 南非
- 埃及
- 奈及利亞
- 其他非洲地區
- 北美洲
第6章 競爭情勢
- 市場集中度
- 策略趨勢
- 市佔率分析
- 公司簡介
- Splunk Inc.
- Datadog Inc.
- Dynatrace LLC
- Cisco(AppDynamics)
- New Relic Inc.
- Microsoft(Azure Monitor)
- Amazon AWS CloudWatch
- Google Cloud Operations Suite
- Grafana Labs
- Elastic NV
- Honeycomb IO
- Sumo Logic
- SolarWinds
- PagerDuty
- ServiceNow(Lightstep)
- Broadcom(Elastic APM)
- ScienceLogic
- Riverbed Technology
- Gigamon
- Netscout Systems
- Keysight Technologies
第7章 市場機會與未來展望
The observability market size was valued at USD 2.9 billion in 2025 and estimated to grow from USD 3.35 billion in 2026 to reach USD 6.93 billion by 2031, at a CAGR of 15.62% during the forecast period (2026-2031).
Enterprises are shifting from reactive monitoring toward proactive observability to manage cloud-native, AI-driven, and edge-centric workloads, and three technology waves generative AI, rapid cloud adoption, and edge computing stand out as the primary demand catalysts. Vendors that align platform roadmaps to these trends capture higher expansion revenue because buyers now value deep trace correlation, real-time AI model insights, and latency-aware analytics. Competitive intensity is rising as established APM leaders add AI observability while younger specialists position pricing around total telemetry costs. Finally, sustainability mandates are steering attention to sampling, intelligent routing, and carbon-aware data centers that complement baseline performance goals.
Global Observability Market Trends and Insights
AI-native instrumentation slashes MTTR
Up to 90% faster incident resolution is being recorded when automated root-cause analysis augments human investigations. Flip's DevOps-focused LLM shows how domain-trained agents cluster repetitive alerts and predict cascading failures before customer impact. Financial institutions such as Capital One embed AI telemetry to sharpen fraud detection, thereby translating engineering insights into regulatory compliance gains. These results encourage budget owners to position observability as a competitive differentiator, not a sunk operational cost. As the observability market evolves, vendors integrating agentic reasoning capabilities will obtain stickier contracts because customers prefer platforms that learn from live data and close incidents autonomously.
Shift to distributed, event-driven architectures
Microservices and serverless designs generate 50-100 times more telemetry than monoliths, overwhelming legacy monitoring back ends. Event streams, message queues, and asynchronous processing create blind spots that force enterprises to deploy OpenTelemetry-native correlation so every span aligns with a business transaction. E-commerce and banking rely on this visibility to protect revenue at peak loads, while manufacturers track IoT sensors and edge devices for predictive maintenance. High telemetry volumes drive interest in pipeline filtering tools that keep storage budgets under control. This architectural pivot secures a durable tailwind for the observability market because each new microservice typically adds more traces, logs, and metrics than the component it replaces.
Escalating observability data storage costs
Telemetry bills now exceed primary infrastructure spend for some enterprises, forcing buyers to deploy aggressive sampling and retention strategies. AWS CloudWatch users have realized up to 96.5% log cost savings through container insights optimization. FinOps teams created inside 90% of Fortune 50 firms track observability spend as a standalone KPI. Platform providers that couple ingestion with real-time filtering gain an edge in the observability market by turning cost control into a product feature.
Other drivers and restraints analyzed in the detailed report include:
- Cloud-first transformation budgets expand
- OpenTelemetry's standardisation unlocks vendor-agnostic growth
- Tool-chain sprawl and vendor lock-in risk
For complete list of drivers and restraints, kindly check the Table Of Contents.
Segment Analysis
The Services piece represented the fastest growth path with an 17.55% CAGR, whereas Solutions retained a 71.30% revenue share in 2025. This split underscores how enterprises need advisory and managed expertise that pairs with platform software to unlock full value. Integration teams design OpenTelemetry pipelines, optimize sampling, and align dashboards with business KPIs, enabling organizations to move beyond infrastructure monitoring into outcome-based analytics.
In practice, complex rollouts involve professional services for deployment, managed services for ongoing tuning, and consulting engagements that link SLA breaches to revenue risk. Demand spikes when AI observability is on the roadmap because in-house data scientists rarely own operational tooling skills. After service providers complete the build phase, customers often scale usage by activating additional modules, expanding the observability market size across post-implementation years.
Cloud/SaaS consumed 68.40% of spending in 2025, yet Hybrid is forecast for a 20.12% CAGR as regulators tighten residency rules and as edge nodes proliferate. The observability market size for Hybrid deployments advances because buyers want cloud elasticity combined with on-prem isolation for pii and trade secrets.
Financial services rollouts often centralize dashboards in the cloud but keep raw logs inside geo-fenced clusters, while manufacturing sites push observability to plant-floor edge gateways to avoid uplink congestion. Vendors that ship single control planes capable of running collectors in any environment satisfy these sovereignty requirements without duplicating tooling, and thereby accumulate incremental observability market share through upselling.
The Observability Market Report is Segmented by Component (Solution, and Services), Deployment (Cloud, On-Premises, and Hybrid), Enterprise Size (Small and Medium Enterprises {SMEs}, and Large Enterprises), End-User Vertical (IT and Telecom, BFSI, Retail and E-Commerce, Manufacturing, Healthcare and Lifesciences, Government and Defense, and More), and Geography. The Market Forecasts are Provided in Terms of Value (USD).
Geography Analysis
North America held 36.65% of spending in 2025, benefiting from early adoption curves, deep cloud penetration, and frameworks such as SOX and HIPAA that codify monitoring requirements. Financial firms instrument trade flows end-to-end to meet audit thresholds, while tech majors foster open-source ecosystems that accelerate community training. Growth remains steady as enterprises optimize existing stacks for AI workloads and edge extensions, sustaining sizeable demand within the observability market.
Asia-Pacific is projected to grow at a 19.62% CAGR, the fastest worldwide. Median annual outage costs reached USD 19.07 million, the highest globally, pushing executives to invest in proactive incident prevention. Governments prioritizing digital sovereignty often insist on hybrid deployments, which fuels demand for multi-tenant platforms that can localize data while preserving global dashboards. Telecommunications and advanced manufacturing plants in Japan, South Korea, and Singapore deploy 5G and Industry 4.0 stacks, generating rich telemetry that contributes materially to the observability market.
Europe grows steadily amid GDPR, the EU AI Act, and sustainability policies that motivate spend on privacy-aware and carbon-efficient telemetry pipelines. Enterprises often prefer hybrid topologies that keep sensitive datasets in-region. Vendors embedding data minimization, encryption at rest, and carbon calculators win bids, reinforcing the observability market's regulatory alignment narrative.
- Splunk Inc.
- Datadog Inc.
- Dynatrace LLC
- Cisco (AppDynamics)
- New Relic Inc.
- Microsoft (Azure Monitor)
- Amazon AWS CloudWatch
- Google Cloud Operations Suite
- Grafana Labs
- Elastic NV
- Honeycomb IO
- Sumo Logic
- SolarWinds
- PagerDuty
- ServiceNow (Lightstep)
- Broadcom (Elastic APM)
- ScienceLogic
- Riverbed Technology
- Gigamon
- Netscout Systems
- Keysight Technologies
Additional Benefits:
- The market estimate (ME) sheet in Excel format
- 3 months of analyst support
TABLE OF CONTENTS
1 INTRODUCTION
- 1.1 Study Assumptions and Market Definition
- 1.2 Scope of the Study
2 RESEARCH METHODOLOGY
3 EXECUTIVE SUMMARY
4 MARKET LANDSCAPE
- 4.1 Market Overview
- 4.2 Market Drivers
- 4.2.1 AI-native instrumentation slashes MTTR
- 4.2.2 Shift to distributed, event-driven architectures
- 4.2.3 Cloud-first transformation budgets expand
- 4.2.4 OpenTelemetry's standardization unlocks vendor-agnostic growth
- 4.2.5 Gen-AI demand for real-time model observability
- 4.2.6 Telco edge build-outs require low-latency full-stack visibility
- 4.3 Market Restraints
- 4.3.1 Escalating observability data storage costs
- 4.3.2 Tool-chain sprawl and vendor lock-in risk
- 4.3.3 Talent gap in observability engineering
- 4.3.4 Sustainability pressure to curb telemetry carbon footprint
- 4.4 Regulatory Landscape
- 4.5 Technological Outlook
- 4.6 Porter's Five Forces Analysis
- 4.6.1 Bargaining Power of Suppliers
- 4.6.2 Bargaining Power of Buyers
- 4.6.3 Threat of New Entrants
- 4.6.4 Threat of Substitutes
- 4.6.5 Competitive Rivalry
- 4.7 Impact of Macroeconomic Trends
5 MARKET SIZE AND GROWTH FORECASTS (VALUE)
- 5.1 By Component
- 5.1.1 Solutions
- 5.1.2 Services
- 5.2 By Deployment Mode
- 5.2.1 Cloud / SaaS
- 5.2.2 On-Premises
- 5.2.3 Hybrid
- 5.3 By Enterprise Size
- 5.3.1 Small and Medium Enterprises
- 5.3.2 Large Enterprises
- 5.4 By End-user Vertical
- 5.4.1 IT and Telecom
- 5.4.2 BFSI
- 5.4.3 Retail and E-commerce
- 5.4.4 Manufacturing
- 5.4.5 Healthcare and Life Sciences
- 5.4.6 Government and Defense
- 5.4.7 Other End-user Verticals
- 5.5 By Application
- 5.5.1 DevOps and APM
- 5.5.2 Infrastructure Monitoring
- 5.5.3 Security and Compliance
- 5.5.4 Data Observability
- 5.5.5 Business Analytics
- 5.6 By Region
- 5.6.1 North America
- 5.6.1.1 United States
- 5.6.1.2 Canada
- 5.6.1.3 Mexico
- 5.6.2 South America
- 5.6.2.1 Brazil
- 5.6.2.2 Argentina
- 5.6.2.3 Rest of South America
- 5.6.3 Europe
- 5.6.3.1 Germany
- 5.6.3.2 United Kingdom
- 5.6.3.3 France
- 5.6.3.4 Spain
- 5.6.3.5 Italy
- 5.6.3.6 Rest of Europe
- 5.6.4 Asia-Pacific
- 5.6.4.1 China
- 5.6.4.2 Japan
- 5.6.4.3 India
- 5.6.4.4 Australia
- 5.6.4.5 South Korea
- 5.6.4.6 Rest of Asia-Pacific
- 5.6.5 Middle East
- 5.6.5.1 Israel
- 5.6.5.2 Saudi Arabia
- 5.6.5.3 United Arab Emirates
- 5.6.5.4 Turkey
- 5.6.5.5 Rest of Middle East
- 5.6.6 Africa
- 5.6.6.1 South Africa
- 5.6.6.2 Egypt
- 5.6.6.3 Nigeria
- 5.6.6.4 Rest of Africa
- 5.6.1 North America
6 COMPETITIVE LANDSCAPE
- 6.1 Market Concentration
- 6.2 Strategic Moves
- 6.3 Market Share Analysis
- 6.4 Company Profiles (includes Global level Overview, Market level overview, Core Segments, Financials as available, Strategic Information, Market Rank/Share, Products and Services, Recent Developments)
- 6.4.1 Splunk Inc.
- 6.4.2 Datadog Inc.
- 6.4.3 Dynatrace LLC
- 6.4.4 Cisco (AppDynamics)
- 6.4.5 New Relic Inc.
- 6.4.6 Microsoft (Azure Monitor)
- 6.4.7 Amazon AWS CloudWatch
- 6.4.8 Google Cloud Operations Suite
- 6.4.9 Grafana Labs
- 6.4.10 Elastic NV
- 6.4.11 Honeycomb IO
- 6.4.12 Sumo Logic
- 6.4.13 SolarWinds
- 6.4.14 PagerDuty
- 6.4.15 ServiceNow (Lightstep)
- 6.4.16 Broadcom (Elastic APM)
- 6.4.17 ScienceLogic
- 6.4.18 Riverbed Technology
- 6.4.19 Gigamon
- 6.4.20 Netscout Systems
- 6.4.21 Keysight Technologies
7 MARKET OPPORTUNITIES AND FUTURE OUTLOOK
- 7.1 White-space and Unmet-needs Assessment
 2026年全球大規模語言模型(LLM)推理防護措施市場報告2026年全球高效能分析設備(SAP HANA)系統、應用與資料處理諮詢服務市場報告2026年全球大規模語言模式(LLM)觀測平台市場報告2026年全球數據可觀測性市場報告2026年全球可觀測工具與平台市場報告
 2026-2030年全球可觀測性平台市場
 可觀測工具和平台市場分析及預測(至 2035 年):按類型、產品、服務、技術、組件、應用、部署模式、最終用戶、解決方案和模式分類
 可觀測性平台市場規模、佔有率和成長分析(按組件、部署類型、組織規模、垂直產業和地區分類)-2026-2033年產業預測
 全球資料可觀測性市場:預測至 2032 年-按解決方案、服務、部署方法、資料管道類型、使用頻率、最終使用者和地區進行分析全球雲端原生可觀測性工具市場:預測至 2032 年 - 按組件、部署方式、組織規模、最終用戶和地區進行分析