


 |
市場調查報告書
商品編碼
2035004
營運技術(OT)安全:市場佔有率分析、產業趨勢與統計資料、成長預測(2026-2031 年)Operational Technology (OT) Security - Market Share Analysis, Industry Trends & Statistics, Growth Forecasts (2026 - 2031) |
||||||

※ 本網頁內容可能與最新版本有所差異。詳細情況請與我們聯繫。
預計營運技術 (OT) 安全市場將從 2025 年的 221.5 億美元成長到 2026 年的 251.9 億美元,到 2031 年將達到 479.5 億美元,2026 年至 2031 年的複合年成長率為 13.74%。
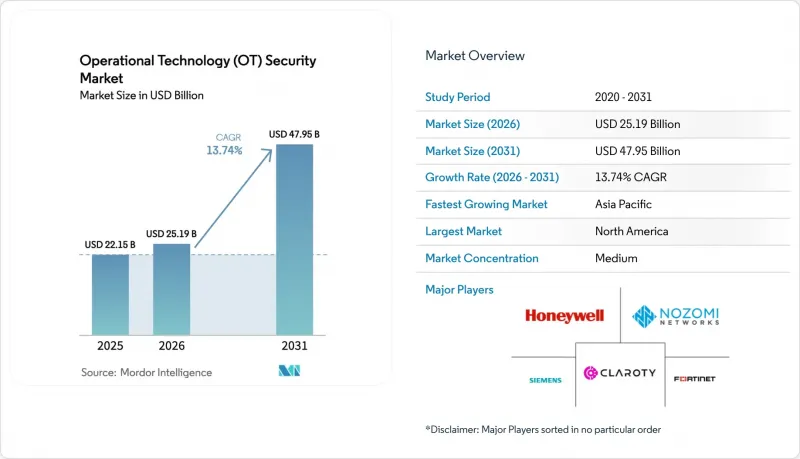
關鍵基礎設施的廣泛數位化使以往孤立的工業控制系統暴露於網路威脅之下,亟需對多層網路防禦進行緊急投資。 2023年至2024年間,製造業佔已通報工業網路安全事件的25.7%,凸顯了該產業易受勒索軟體、擦除型惡意軟體和國家支持的破壞行為攻擊。地緣政治緊張局勢加劇了這一風險;2024年,國家支持的組織對能源、交通和水資源資產的攻擊增加了49%。監管壓力加速了支出;北美管道營運商現在必須在12小時內向美國網路安全和基礎設施安全局(CISA)報告事件,這推動了持續監控平台的普及。歐盟的NIS2指令強制要求在整個供應鏈中採用「最先進」的控制措施,進一步加速了平台整合,促使買家從獨立工具轉向整合解決方案。同時,由於缺乏專門從事營運技術 (OT) 的網路安全人員,許多企業開始採用將 AI 分析與 24/7 事件回應相結合的託管偵測和回應服務。
全球營運技術 (OT) 安全市場趨勢與洞察
針對關鍵基礎設施的網路攻擊激增。
2025 年中,供水事業洩漏了 400 個未受保護的 Web 介面,生動地展現了工業資產安全漏洞的嚴重程度。諸如 IOCONTROL 之類的高階惡意軟體攻擊可程式邏輯控制器 (PLC),從而能夠隱藏地操縱製程變數。基於規則的系統難以辨識異常行為,導致人工智慧驅動的異常檢測工具得到更廣泛的應用。除了運作中斷外,這些攻擊還引發了連鎖的供應鏈中斷,影響了化學和運輸等相關產業。
IT網路和OT網路的融合正在擴大攻擊面。
2024年,80%的製造商在整合企業IT資源和工廠網路後,安全事件數量增加。雖然雲端分析和預測性維護工作負載提高了生產力,但也揭露了缺乏身份驗證功能的傳統協定。因此,融合IT和OT專業知識的混合安全營運中心,輔以網路分段和資產發現引擎(用於維護控制器、感測器和閘道器的即時庫存),已成為一項策略必需。
OT安全平台的高部署成本與生命週期成本
一套全面的營運技術 (OT) 安全方案需要數百萬美元的投入,包括硬體感測器、許可費和多年維護合約。小規模的電力公司依靠一項 2.5 億美元的「地方政府高級網路安全津貼」來支付部署成本。客製化整合和漫長的工廠驗收測試推高了整體擁有成本,並導致了分階段部署,這可能導致關鍵資產在過渡期內處於無保護狀態。
細分市場分析
到2025年,解決方案將佔總收入的62.34%。這是因為資產發現引擎、入侵偵測設備和分段閘道構成了所有OT安全市場項目的基礎。然而,隨著營運商越來越依賴託管偵測、事件回應和合規性審計來彌補網路安全人才的短缺,服務業到2031年將以17.92%的複合年成長率成長。供應商現在提供基於結果的契約,保證平均檢測時間(MTD)閾值,並支援全天候安全營運中心(SOC)監控。
工業企業越來越傾向將網路韌性視為關鍵營運績效指標 (KPI),而非資本投入項目。託管式 OT SOC 服務無需額外人員即可提供可擴展的專業知識,而專業服務團隊則可根據西門子、ABB 和艾默生等不同廠商的異質控制器客製化零信任架構。這種轉變正在推動平台普及,因為持續服務可確保供應商人員駐場,從而減少技術過渡,並在 OT 安全市場中保證穩定、持續的收入。
在部署初期,由於對延遲的敏感度和資料主權法規的限制,本地部署佔據主導地位,預計到2025年將佔市場佔有率的70.42%。然而,隨著超大規模資料中心業者獲得IEC 62443和ISO 27001認證,基於雲端的分析和配置管理正以20.85%的複合年成長率快速成長。中小製造商正在利用基於使用量的收費模式,避免資本投資,同時使用先進的AI威脅關聯引擎。
混合架構正逐漸成為主流,高度敏感的製程變數被保存在工廠的非軍事區 (DMZ) 內,而加密的遙測資料則被傳送到雲端安全營運中心 (SOC),作為行為指標,用於長期趨勢分析、增強威脅情報和取證搜尋。隨著可靠性的提高,營運商正在將歷史備份、韌體庫和漏洞掃描工作負載遷移到雲端,這一趨勢預計將擴大由軟體即服務 (SaaS) 平台驅動的營運技術 (OT) 安全市場規模。
營運技術 (OT) 安全市場按組件(解決方案和服務)、部署模式(本地部署和雲端部署)、最終用戶產業(製造業、石油和天然氣、電力、運輸和物流等)、安全層(網路監控和異常檢測、端點/設備安全等)以及地區(北美、南美、歐洲、亞太地區、中東和非洲)進行細分。
區域分析
北美保持領先地位,預計到2025年將佔全球收入的38.15%。這得歸功於兩黨對關鍵基礎設施防禦的共同投資,而大規模的管道、食品加工廠和地方水主導遭受攻擊的刺激更是加劇了這一趨勢。美國運輸安全局(TSA)的一項指令要求能源管道營運商持續監控SCADA系統流量,並在12小時內報告異常情況。加拿大投資建造了水力發電廠的網路安全框架,而墨西哥的汽車產業走廊則增加了安全營運中心(SOC)外包合約的數量。
亞太地區展現出最高的成長勢頭,營運技術(OT)安全市場在2026年至2031年間的複合年成長率(CAGR)將達到19.75%。中國利用5G連接的感測器對其石化和鐵路系統進行了現代化改造;印度強制要求電廠和智慧城市項目向印度電腦緊急應變小組(CERT-In)報告事故;日本加強了核能發電廠的控制系統,以應對地緣政治動盪。東南亞國協充分利用外國直接投資,並在工程早期階段引入IEC 62443評估,以避免現有設備維修帶來的挑戰。
在歐洲,隨著NIS2指令的實施,合規範圍擴大到數千家中型工業企業,發展動能依然強勁。德國為採用「安全設計」PLC的中小型機械製造商提供政府補貼;英國關鍵國家基礎設施中心(CNIC)發布了安全遠端存取閘道器的採購清單;義大利加快了可再生能源的併網,並要求採用安全的逆變器遙測技術。東歐電力公司優先考慮對傳統變電站進行改造,從而推動了營運技術(OT)安全市場的區域需求。
其他好處:
- Excel格式的市場預測(ME)表
- 3個月的分析師支持
目錄
第1章:引言
- 研究假設和市場定義
- 調查範圍
第2章:調查方法
第3章執行摘要
第4章 市場狀況
- 市場概覽
- 市場促進因素
- 針對關鍵基礎設施的網路攻擊激增。
- IT網路和OT網路的融合擴大了攻擊面。
- 全球和區域層面更嚴格的法規和標準(例如,NIS2、TSA SD02C)
- 流程工業中工業4.0/工業物聯網的快速應用
- 將保險費與營運技術安全措施掛鉤的保險承保要求。
- 工廠級零信任參考架構的出現。
- 市場限制因素
- OT安全平台的高部署成本與生命週期成本
- 舊有系統和協定相容性限制
- 降低中小型工業設施的預算優先順序。
- 網路安全專業人員和專精於營運技術(OT)的現場工程師短缺
- 價值鏈分析
- 監理狀態(IEC 62443、NIS2、TSA、CISA、ISA/IEC-99)
- 技術展望(基於人工智慧的異常檢測、5G校園網、TSN)
- 波特五力分析
- 新進入者的威脅
- 買方的議價能力
- 供應商的議價能力
- 替代品的威脅
- 競爭公司之間的競爭
- 宏觀經濟影響評估
第5章 市場規模與成長預測
- 按組件
- 解決方案
- 服務
- 部署模式
- 現場
- 雲
- 按最終用戶行業分類
- 製造業
- 石油和天然氣
- 電力公司
- 運輸/物流
- 化學品和製藥
- 採礦和金屬
- 安全層
- 網路監控和異常檢測
- 端點/設備安全
- 身分和存取管理
- 安全遠端存取和分段閘道器
- 管治、風險和合規 (GRC) 平台
- 按地區
- 北美洲
- 美國
- 加拿大
- 墨西哥
- 南美洲
- 巴西
- 阿根廷
- 南美洲其他地區
- 歐洲
- 德國
- 英國
- 法國
- 義大利
- 西班牙
- 北歐國家
- 比荷盧經濟聯盟
- 俄羅斯
- 其他歐洲地區
- 亞太地區
- 中國
- 日本
- 印度
- 韓國
- ASEAN
- 亞太其他地區
- 中東和非洲
- 中東
- GCC
- 土耳其
- 以色列
- 其他中東國家
- 非洲
- 南非
- 其他非洲地區
- 中東
- 北美洲
第6章 競爭情勢
- 市場集中度分析
- 策略性舉措和資金籌措趨勢
- 市佔率分析
- 公司簡介
- Fortinet, Inc.
- Nozomi Networks Inc.
- Claroty Ltd.
- Honeywell International Inc.
- Siemens Aktiengesellschaft(Siemens AG)
- Schneider Electric SE
- Rockwell Automation, Inc.
- GE Vernova LLC
- Darktrace Holdings Limited
- Palo Alto Networks, Inc.
- Cisco Systems, Inc.
- International Business Machines Corporation
- Dragos, Inc.
- Tenable, Inc.
- Armis Security Ltd.
- Forescout Technologies, Inc.
- Check Point Software Technologies Ltd.
- Microsoft Corporation
- Waterfall Security Solutions Ltd.
- OPSWAT, Inc.
- Radiflow Ltd.
- Indegy Ltd.(now part of Tenable, Inc.)
- BAE Systems plc
- Tripwire, Inc.
- AO Kaspersky Lab
第7章 市場機會與未來展望
The operational technology security market size is expected to grow from USD 22.15 billion in 2025 to USD 25.19 billion in 2026 and is forecast to reach USD 47.95 billion by 2031 at 13.74% CAGR over 2026-2031.
Widespread digitalization of critical infrastructure exposed formerly isolated industrial control systems to internet-based threats, prompting urgent investment in layered cyber defense. Manufacturing accounted for 25.7% of reported industrial cyber incidents in 2023-2024, highlighting the sector's vulnerability to ransomware, wiper malware, and state-sponsored sabotage. Geopolitical tension compounded risk: state-aligned groups increased attacks on energy, transport, and water assets by 49% during 2024. Regulatory pressure accelerated spending; North American pipeline operators must now report incidents within 12 hours to CISA, driving uptake of continuous-monitoring platforms. Platform consolidation gained momentum because the EU NIS2 Directive requires "state-of-the-art" controls across supply chains, encouraging buyers to shift from point tools to integrated offerings. Simultaneously, the shortage of OT-specific cyber talent pushed many operators toward managed detection and response services that combine AI analytics with 24/7 incident handling.
Global Operational Technology (OT) Security Market Trends and Insights
Surge in Cyber-Attacks on Critical Infrastructure
Water utilities disclosed 400 exposed web interfaces in mid-2025, illustrating the scale of unsecured industrial assets. Sophisticated malware such as IOCONTROL targeted programmable logic controllers to enable covert manipulation of process variables. AI-driven anomaly-detection tools gained traction because rule-based systems struggled to recognize previously unseen behaviours. Beyond operational downtime, attacks produced cascading supply-chain disruption that affected adjacent sectors such as chemicals and transport.
Convergence of IT and OT Networks Expanding Attack Surface
Eighty percent of manufacturers experienced more security incidents after integrating enterprise IT resources with plant networks in 2024. Cloud analytics and predictive-maintenance workloads improved productivity but simultaneously exposed legacy protocols lacking authentication. Hybrid security operations centres that fuse IT and OT expertise became a strategic imperative, supported by network segmentation and asset-discovery engines that maintain real-time inventories of controllers, sensors, and gateways.
High Implementation and Lifecycle Cost of OT Security Platforms
Comprehensive OT security programs require multi-million-dollar outlays spanning hardware sensors, license fees, and multi-year maintenance contracts. Smaller electric utilities relied on the USD 250 million Rural and Municipal Advanced Cybersecurity Grant to offset adoption costs. Custom integration and prolonged factory-acceptance testing inflated the total cost of ownership, encouraging phased rollouts that can leave critical assets unprotected during transition.
Other drivers and restraints analyzed in the detailed report include:
- Stricter Global/Regional Regulations and Standards
- Rapid Industry 4.0 / IIoT Adoption in Process Industries
- Legacy System and Protocol Compatibility Limitations
For complete list of drivers and restraints, kindly check the Table Of Contents.
Segment Analysis
Solutions accounted for 62.34% revenue in 2025 because asset-discovery engines, intrusion-detection appliances, and segmentation gateways form the backbone of any operational technology security market program. However, services are rising at an 17.92% CAGR through 2031 as operators lean on managed detection, incident response, and compliance audits to offset the cyber-talent gap. Vendors now bundle outcome-based contracts that guarantee mean-time-to-detect thresholds and support around-the-clock SOC monitoring.
Industrial firms increasingly treat cyber resilience as an operational key-performance indicator rather than a capital project. Managed OT SOC offerings deliver scalable expertise without inflating headcount, while professional-services teams customize zero-trust architectures across heterogeneous controllers from Siemens, ABB, and Emerson. This shift underpins platform stickiness because continuous services embed vendor staff inside plants, discouraging technology swaps and stabilizing recurring revenue within the operational technology security market.
On-premises deployments dominated early rollouts due to latency sensitivities and data-sovereignty rules, capturing 70.42% share in 2025. Yet cloud-delivered analytics and configuration management are expanding at a 20.85% CAGR as hyperscalers achieve IEC 62443 and ISO 27001 certifications. Smaller manufacturers leverage consumption-based pricing to avoid capital expenditure while accessing advanced AI threat-correlation engines.
Hybrid architectures prevail, sensitive process variables remain inside the plant DMZ, whereas encrypted telemetry feeds behavioural indicators to cloud SOCs for long-term trending, threat-intelligence enrichment, and forensic search. As confidence grows, operators migrate historian backups, firmware repositories, and vulnerability-scanning workloads to the cloud, a trend expected to raise the operational technology security market size attributable to SaaS platforms.
Operational Technology (OT) Security Market is Segmented by Component (Solutions, and Services), Deployment Mode (On-Premise, and Cloud), End-User Industry (Manufacturing, Oil and Gas, Power Utilities, Transportation and Logistics, and More), Security Layer (Network Monitoring and Anomaly Detection, Endpoint/Device Security, and More), and Geography (North America, South America, Europe, Asia-Pacific, and Middle East and Africa).
Geography Analysis
North America retained leadership with 38.15% of 2025 revenue after headline attacks on pipelines, food processors, and local water districts drove bipartisan investment in critical-infrastructure defense. TSA directives obligate energy-pipeline operators to continuously monitor SCADA traffic and report anomalies within 12 hours. Canada invested in cybersecurity frameworks for hydroelectric dams, while Mexican automotive corridors boosted SOC outsourcing agreements.
Asia-Pacific delivered the highest growth trajectory, with the operational technology security market size expanding at a 19.75% CAGR between 2026-2031. China modernized its petrochemical and rail systems with 5 G-connected sensors, India mandated CERT-In incident reporting for power plants and smart-city projects, and Japan reinforced its nuclear-plant control systems against geopolitical disruption. ASEAN countries leveraged foreign direct investment to incorporate IEC 62443 assessments from project inception, sidestepping legacy-retrofit challenges.
Europe maintained steady momentum as the NIS2 Directive widened compliance scope to thousands of medium-sized industrial firms. Germany established state subsidies for SME machine-builders adopting secure-by-design PLCs, the UK's Critical National Infrastructure Centre published procurement checklists for secure remote-access gateways, and Italy accelerated renewables integration, demanding secure inverter telemetry. Eastern European utilities prioritized the segmentation of legacy substations, lifting regional demand within the operational technology security market.
- Fortinet, Inc.
- Nozomi Networks Inc.
- Claroty Ltd.
- Honeywell International Inc.
- Siemens Aktiengesellschaft (Siemens AG)
- Schneider Electric SE
- Rockwell Automation, Inc.
- GE Vernova LLC
- Darktrace Holdings Limited
- Palo Alto Networks, Inc.
- Cisco Systems, Inc.
- International Business Machines Corporation
- Dragos, Inc.
- Tenable, Inc.
- Armis Security Ltd.
- Forescout Technologies, Inc.
- Check Point Software Technologies Ltd.
- Microsoft Corporation
- Waterfall Security Solutions Ltd.
- OPSWAT, Inc.
- Radiflow Ltd.
- Indegy Ltd. (now part of Tenable, Inc.)
- BAE Systems plc
- Tripwire, Inc.
- AO Kaspersky Lab
Additional Benefits:
- The market estimate (ME) sheet in Excel format
- 3 months of analyst support
TABLE OF CONTENTS
1 INTRODUCTION
- 1.1 Study Assumptions and Market Definition
- 1.2 Scope of the Study
2 RESEARCH METHODOLOGY
3 EXECUTIVE SUMMARY
4 MARKET LANDSCAPE
- 4.1 Market Overview
- 4.2 Market Drivers
- 4.2.1 Surge in cyber-attacks on critical infrastructure
- 4.2.2 Convergence of IT and OT networks expanding attack surface
- 4.2.3 Stricter global/regional regulations and standards (e.g., NIS2, TSA SD02C)
- 4.2.4 Rapid Industry 4.0 / IIoT adoption in process industries
- 4.2.5 Insurance underwriting requirements linking premiums to OT-security posture
- 4.2.6 Emergence of plant-level zero-trust reference architectures
- 4.3 Market Restraints
- 4.3.1 High implementation and lifecycle cost of OT security platforms
- 4.3.2 Legacy system and protocol compatibility limitations
- 4.3.3 Budget deprioritisation at small / mid-size industrial sites
- 4.3.4 Shortage of OT-specific cyber-talent and field engineers
- 4.4 Value Chain Analysis
- 4.5 Regulatory Landscape (IEC 62443, NIS2, TSA, CISA, ISA/IEC-99)
- 4.6 Technological Outlook (AI-driven anomaly detection, 5G campus networks, TSN)
- 4.7 Porter's Five Forces Analysis
- 4.7.1 Threat of New Entrants
- 4.7.2 Bargaining Power of Buyers
- 4.7.3 Bargaining Power of Suppliers
- 4.7.4 Threat of Substitutes
- 4.7.5 Intensity of Competitive Rivalry
- 4.8 Macroeconomic Impact Assessment
5 MARKET SIZE AND GROWTH FORECASTS (VALUE)
- 5.1 By Component
- 5.1.1 Solutions
- 5.1.2 Services
- 5.2 By Deployment Mode
- 5.2.1 On-Premises
- 5.2.2 Cloud
- 5.3 By End-User Industry
- 5.3.1 Manufacturing
- 5.3.2 Oil and Gas
- 5.3.3 Power Utilities
- 5.3.4 Transportation and Logistics
- 5.3.5 Chemicals and Pharma
- 5.3.6 Mining and Metals
- 5.4 By Security Layer
- 5.4.1 Network Monitoring and Anomaly Detection
- 5.4.2 Endpoint / Device Security
- 5.4.3 Identity and Access Management
- 5.4.4 Secure Remote Access and Segmentation Gateways
- 5.4.5 Governance, Risk and Compliance Platforms
- 5.5 By Geography
- 5.5.1 North America
- 5.5.1.1 United States
- 5.5.1.2 Canada
- 5.5.1.3 Mexico
- 5.5.2 South America
- 5.5.2.1 Brazil
- 5.5.2.2 Argentina
- 5.5.2.3 Rest of South America
- 5.5.3 Europe
- 5.5.3.1 Germany
- 5.5.3.2 United Kingdom
- 5.5.3.3 France
- 5.5.3.4 Italy
- 5.5.3.5 Spain
- 5.5.3.6 Nordics
- 5.5.3.7 Benelux
- 5.5.3.8 Russia
- 5.5.3.9 Rest of Europe
- 5.5.4 Asia-Pacific
- 5.5.4.1 China
- 5.5.4.2 Japan
- 5.5.4.3 India
- 5.5.4.4 South Korea
- 5.5.4.5 ASEAN
- 5.5.4.6 Rest of Asia-Pacific
- 5.5.5 Middle East and Africa
- 5.5.5.1 Middle East
- 5.5.5.1.1 GCC
- 5.5.5.1.2 Turkey
- 5.5.5.1.3 Israel
- 5.5.5.1.4 Rest of Middle East
- 5.5.5.2 Africa
- 5.5.5.2.1 South Africa
- 5.5.5.2.2 Rest of Africa
- 5.5.5.1 Middle East
- 5.5.1 North America
6 COMPETITIVE LANDSCAPE
- 6.1 Market Concentration Analysis
- 6.2 Strategic Moves and Funding Landscape
- 6.3 Market Share Analysis
- 6.4 Company Profiles (includes Global-level Overview, Market-level Overview, Core Segments, Financials as available, Strategic Information, Market Rank/Share for key companies, Products and Services, and Recent Developments)
- 6.4.1 Fortinet, Inc.
- 6.4.2 Nozomi Networks Inc.
- 6.4.3 Claroty Ltd.
- 6.4.4 Honeywell International Inc.
- 6.4.5 Siemens Aktiengesellschaft (Siemens AG)
- 6.4.6 Schneider Electric SE
- 6.4.7 Rockwell Automation, Inc.
- 6.4.8 GE Vernova LLC
- 6.4.9 Darktrace Holdings Limited
- 6.4.10 Palo Alto Networks, Inc.
- 6.4.11 Cisco Systems, Inc.
- 6.4.12 International Business Machines Corporation
- 6.4.13 Dragos, Inc.
- 6.4.14 Tenable, Inc.
- 6.4.15 Armis Security Ltd.
- 6.4.16 Forescout Technologies, Inc.
- 6.4.17 Check Point Software Technologies Ltd.
- 6.4.18 Microsoft Corporation
- 6.4.19 Waterfall Security Solutions Ltd.
- 6.4.20 OPSWAT, Inc.
- 6.4.21 Radiflow Ltd.
- 6.4.22 Indegy Ltd. (now part of Tenable, Inc.)
- 6.4.23 BAE Systems plc
- 6.4.24 Tripwire, Inc.
- 6.4.25 AO Kaspersky Lab
7 MARKET OPPORTUNITIES AND FUTURE OUTLOOK
- 7.1 White-space and Unmet-need Assessment

 全球營運技術 (OT) 安全市場:機會與策略展望(至 2035 年)
 鄰里安全平台市場預測至2034年-按組件、部署模式、最終用戶和地區分類的全球分析
 營運技術 (OT) 安全市場:按組件、安全類型、部署模式、組織規模和最終用戶產業分類-2026 年至 2030 年全球市場預測
 操作技術(OT) 安全市場分析及預測(至 2035 年):按類型、產品類型、服務、技術、組件、應用、部署類型、最終用戶和解決方案分類
 全球操作技術安全市場規模、佔有率、趨勢和成長分析報告(2026-2034)
 操作技術安全市場 - 全球產業規模、佔有率、趨勢、機會、預測:按組件、部署、組織規模、最終用戶產業、地區和競爭格局分類,2021-2031 年
 2026-2030年全球操作技術(OT)安全市場2032年社區安全技術市場預測:按組件、連接方式、技術、部署方式、最終用戶和地區分類的全球分析全球操作技術安全市場:2032 年預測 - 按組件、部署方法、組織規模、最終用戶和地區進行分析
 運用技術保全的全球市場評估,各提供,各部署模式,各組織規模,各終端用戶產業,各地區,機會及預測,2018年~2032年