


 |
市場調查報告書
商品編碼
1940890
5G基地台市場佔有率分析、產業趨勢與統計、成長預測(2026-2031年)5G Base Station - Market Share Analysis, Industry Trends & Statistics, Growth Forecasts (2026 - 2031) |
||||||
※ 本網頁內容可能與最新版本有所差異。詳細情況請與我們聯繫。
2025年,5G基地台市場價值為374.4億美元,預計到2031年將達到1,639.4億美元,而2026年為478.7億美元。
預計在預測期(2026-2031 年)內,複合年成長率將達到 27.92%。
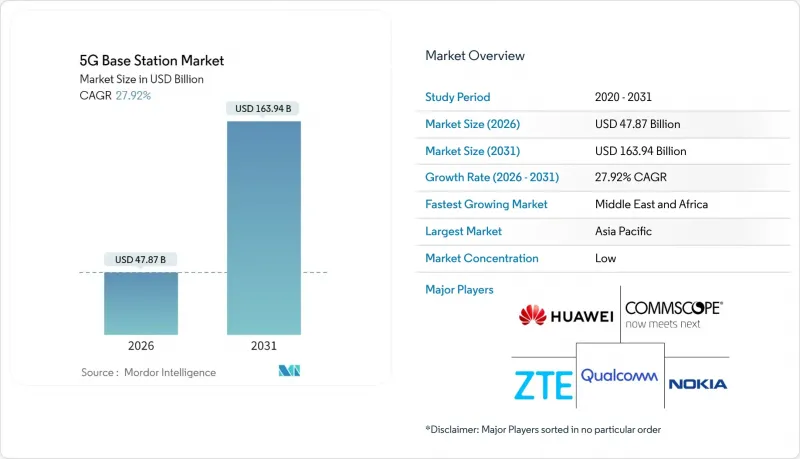
強勁成長的促進因素包括:各國政府將頻譜競標轉化為基礎設施獎勵策略;營運商升級至開放式無線存取網(Open-RAN);以及企業尋求為自動化和公共系統提供超可靠、低延遲的連線。中國目前已擁有超過440萬個運作站點,而美國和歐洲主要市場則強調開放式架構,以降低供應商風險並促進創新。近期半導體短缺促使供應鏈多元化,推動供應商增設區域製造地並採用氮化鎵功率放大器,從而將站點電力成本降低高達50%。智慧工廠、港口和智慧城市走廊對專用網路的需求,進一步加速了小型基地台、大規模MIMO無線電和毫米波節點的密集化部署。
全球5G基地台市場趨勢與洞察
政府頻譜競標和基礎設施獎勵策略
世界各國政府正將頻譜銷售作為政策工具,以擴大網路覆蓋範圍並促進本地製造業發展。美國根據《基礎設施投資和就業創造法案》撥款424.5億美元,用於促進農村寬頻建設,並在尚未覆蓋的地區部署5G網路。印度推出的120億美元生產掛鉤補貼計畫鼓勵無線電設備和天線的國內生產,從而縮短供應鏈並加速農村地區的部署。完善的競標機制和補貼計畫為營運商提供可預測的現金流,從而實現多年投資週期,並刺激大型基地台和小型基地台層面的5G基地台市場發展。
現有設備的開放式無線存取網升級週期
開放式無線接取網路(Open RAN)將無線設備、基頻和軟體解耦,使通訊業者能夠整合各領域的領先供應商,降低採購成本並實現自動更新。沃達豐承諾在2027年將其在英國的2600個站點遷移到Open RAN,目標是降低30%的成本並實現供應商多元化。德國電信正在德國和波蘭擴大多供應商試驗,以提高柔軟性並促進本土創新。儘管系統整合仍然複雜,但早期商業化帶來的效能展示正在影響未來網路密集化階段的採購標準,從而推動5G基地台市場的發展。
高額資本投入和較長的投資回收期
通訊業者面臨數十億美元的部署成本,其投資回收期也比上一代網路更長。 Verizon每年在5G無線電設備和光纖回程傳輸的支出超過100億美元,預計投資回收期為7-10年,而LTE的投資回收期約為5年。農村地區的計劃獲利能力更低,迫使營運商將重點放在人口稠密的都市區,除非有補貼彌補獲利能力差距。融資緊張正在減緩全國範圍內的網路覆蓋速度,並限制低收入國家5G基地台市場的擴張。
細分市場分析
到2025年,大型基地台將佔據5G基地台市場60.62%的佔有率(226.9億美元),提供廣域覆蓋和移動錨點服務。然而,小型基地台預計將以28.85%的複合年成長率成長,到2031年,其在5G基地台市場的佔有率將達到736億美元。通訊業者正在部署數千個街邊節點,以緩解體育場、交通走廊和企業園區等場所的廣域基地台擁塞。光是Verizon一家就已安裝了超過5萬個低功率單元,用於消除室內訊號盲點並實現對稱Gigabit速度。
雖然許可核准和場地限制曾經阻礙了小型基地台的擴張,但聯邦通訊委員會的放鬆管制已將地方政府的核准時間從數月縮短至不到60天。對專用網路的需求也在成長,小型基地台提供專用的本地覆蓋,無需依賴公共頻譜。像Crown Castle這樣的垂直資產所有者報告稱,室內合約簽署量實現了三位數的成長,這證實了網路密集化正在推動全球5G基地台市場的發展。
至2025年,非獨立組網部署佔總部署佔有率的57.95%,通訊業者利用其現有的LTE核心網路實現快速服務上線。然而,獨立組網市場規模將維持快速成長,年複合成長率達29.35%,到2031年將佔5G基地台市場總量的60%以上。 AT&T已為需要確定性延遲的工業客戶運作獨立組網切片,而T-Mobile則已擴展其在全國範圍內的獨立組網覆蓋範圍,以提供差異化的性能水平。
獨立架構能夠實現非獨立架構無法實現的功能,例如網路切片、分散式邊緣運算和進階加密。 DISH Network 避開了傳統基礎設施,建立了一個完全雲端原生的網路,從而降低了營運成本並實現了快速的功能發布週期。雖然核心網路遷移增加了複雜性和技能要求,但通訊業者認知到其帶來的長期收入成長潛力,並正在加快相容無線電設備和核心網路軟體的訂單。
區域分析
到2025年,亞太地區將佔據41.10%的市場佔有率,這主要得益於中國440萬個運作站點以及到2025年實現近乎全國覆蓋的5G網路。日本和韓國在採用獨立網路和邊緣運算方面已取得早期進展,並已將網路切片商業化應用於製造業和媒體服務。印度2024年的頻譜競標吸引了來自Bharti Airtel和Reliance Jio的大量資金,計劃於2025年在23個城市啟動第一階段的5G網路部署,並計劃於2027年擴展到遍遠地區。台灣和韓國的半導體產業叢集正在為5G基地台提供零件供應,從而增強該地區在全球5G基地台市場的影響力。
北美在規模上略顯落後,但在毫米波創新方面卻處於主導。 Verizon 已在 26 個州運作了Gigabit固定無線接入服務,而 AT&T 則專注於面向雲端和邊緣工作負載的企業專用蜂窩業務。在加拿大,頻譜競標正在為農村地區的網路擴張提供資金,而開放接入漫遊政策也進一步推動了對基地台的需求。儘管縣市層級的監管差異在某些地區減緩了核准速度,但獎勵策略資金和鐵塔公司簽訂的建設租賃協議幫助北美在 5G基地台市場保持了穩健的貢獻。
中東和非洲地區成長最快,複合年成長率達29.55%。沙烏地阿拉伯的「2030願景」數位計畫正在資助全國範圍內的5G部署,並將利雅德打造成為阿拉伯語內容傳送的技術中心。阿拉伯聯合大公國已在其人口稠密地區97%的區域部署了5G網路,目前正在進行5G高級服務的試驗。在非洲,肯亞和奈及利亞優先考慮無線而非光纖,以促進寬頻和金融科技的普及,但匯率風險和能源成本推高了計劃預算。因此,多邊銀行和供應商融資機制在實現非洲大陸的5G願景中發揮越來越重要的作用。
其他福利:
- Excel格式的市場預測(ME)表
- 3個月的分析師支持
目錄
第1章 引言
- 研究假設和市場定義
- 調查範圍
第2章調查方法
第3章執行摘要
第4章 市場情勢
- 市場概覽
- 市場促進因素
- 行動數據流量和智慧型手機普及率的成長
- 5G 具有更低的延遲和更高的頻寬優勢。
- 政府頻譜競標和基礎設施獎勵策略
- 現有設備的開放式無線存取網升級週期
- 為工業專用5G部署小型毫米波基地台
- 節能型氮化鎵功率放大器可降低全廠營運成本。
- 市場限制
- 高額資本投入和較長的投資回收期
- 頻譜碎片化和監管延遲
- 射頻前端元件供應瓶頸
- 永續性措施推高了場地成本。
- 價值/供應鏈分析
- 監管環境
- 技術展望
- 波特五力模型
- 供應商的議價能力
- 買方的議價能力
- 新進入者的威脅
- 競爭對手之間的競爭
- 替代品的威脅
- 投資分析
第5章 市場規模與成長預測
- 按類型
- 小型基地台
- 大型基地台
- 建築設計
- 獨立版 (SA)
- 非獨立式(NSA)
- 按頻段
- 6GHz 以下頻段
- 毫米波頻段(24-40 GHz)
- 按額定輸出
- 10瓦或以下
- 10-40 W
- 40瓦或以上
- MIMO技術
- 傳統MIMO
- 大規模 MIMO(64T64R 或更高)
- 最終用戶
- 商業行動通訊業者
- 住宅/消費者 FWA
- 工業專用網路
- 政府/國防
- 智慧城市與公共
- 其他最終用戶
- 按地區
- 北美洲
- 美國
- 加拿大
- 墨西哥
- 南美洲
- 巴西
- 阿根廷
- 智利
- 南美洲其他地區
- 歐洲
- 英國
- 德國
- 法國
- 義大利
- 西班牙
- 俄羅斯
- 其他歐洲地區
- 亞太地區
- 中國
- 印度
- 日本
- 韓國
- 澳洲
- 印尼
- 泰國
- 馬來西亞
- 越南
- 菲律賓
- 亞太其他地區
- 中東和非洲
- 中東
- 沙烏地阿拉伯
- 阿拉伯聯合大公國
- 土耳其
- 以色列
- 卡達
- 其他中東地區
- 非洲
- 南非
- 奈及利亞
- 肯亞
- 埃及
- 其他非洲地區
- 中東
- 北美洲
第6章 競爭情勢
- 市場集中度
- 策略趨勢
- 市佔率分析
- 公司簡介
- Huawei Technologies Co. Ltd
- ZTE Corporation
- Nokia Corporation
- Telefonaktiebolaget LM Ericsson
- Samsung Electronics Co. Ltd
- CommScope Holding Company Inc.
- Qualcomm Incorporated
- Qorvo Inc.
- Alpha Networks Inc.
- NEC Corporation
- Fujitsu Ltd
- Airspan Networks Holdings Inc.
- Mavenir Systems Inc.
- Parallel Wireless Inc.
- Baicells Technologies Co. Ltd
- JMA Wireless
- Comba Telecom Systems Holdings
- Sercomm Corp.
- ACE Technologies Corp.
- NEC Platforms, Ltd.
第7章 市場機會與未來展望
The 5G Base Station Market was valued at USD 37.44 billion in 2025 and estimated to grow from USD 47.87 billion in 2026 to reach USD 163.94 billion by 2031, at a CAGR of 27.92% during the forecast period (2026-2031).
Robust growth stems from governments turning spectrum auctions into infrastructure stimulus, operators upgrading to Open-RAN, and enterprises seeking ultra-reliable low-latency connections for automation and public-safety systems. China already operates more than 4.4 million live sites, while the United States and key European markets emphasize open architectures to cut vendor risk and spur innovation. Supply-chain diversification has become urgent after recent semiconductor shortages, pushing vendors to add regional manufacturing and gallium-nitride power amplifiers that lower energy bills by up to 50% at each site. Demand for private networks in smart factories, ports, and smart-city corridors further accelerates densification with small cells, massive-MIMO radios, and millimeter-wave nodes.
Global 5G Base Station Market Trends and Insights
Government Spectrum Auctions and Infrastructure Stimulus
Governments are turning spectrum sales into policy tools that expand coverage and local manufacturing. The United States allocated USD 42.45 billion under the Infrastructure Investment and Jobs Act, targeting rural broadband and 5G build-outs in underserved counties. India's USD 12 billion Production-Linked Incentive scheme rewards domestic production of radios and antennas, shortening supply chains and accelerating rural rollouts. Stable auction roadmaps and subsidy programs give operators cash-flow visibility that unlocks multi-year investment cycles and lifts the 5G base station market across both macro and small-cell layers.
Open-RAN Driven Brown-Field Upgrade Cycle
Open-RAN disaggregates radios, baseband, and software so carriers can blend best-of-breed vendors, slash procurement cost, and automate updates. Vodafone committed to swapping 2,600 United Kingdom sites to Open-RAN by 2027, targeting 30% cost savings and broader supplier diversity. Deutsche Telekom is extending multivendor trials across Germany and Poland to raise flexibility and spur domestic innovation. Although system integration remains complex, early commercial launches validate performance and are influencing procurement criteria for upcoming densification waves, boosting the 5G base station market.
High CAPEX and Long ROI Horizon
Operators face multi-billion-dollar rollouts with longer payback than prior network generations. Verizon disclosed spending above USD 10 billion per year on 5G radios and fiber backhaul and estimates a seven-to-ten-year return window versus about five years for LTE. Rural projects are even less economical, forcing carriers to focus on dense urban clusters unless subsidies cover viability gaps. The stretched cash cycle tempers the pace of nationwide coverage and limits 5G base station market expansion in lower-income countries.
Other drivers and restraints analyzed in the detailed report include:
- mmWave Small-Cell Roll-Outs for Private Industrial 5G
- Energy-Efficient GaN Power Amplifiers Cutting Total Site OPEX
- RF-Front-End Component Supply Bottlenecks
For complete list of drivers and restraints, kindly check the Table Of Contents.
Segment Analysis
Macro cells represented USD 22.69 billion and 60.62% of the 2025 5G base station market share, providing umbrella coverage and mobility anchor services. Yet small cells are forecast to expand at a 28.85% CAGR, pushing their slice of the 5G base station market size toward USD 73.6 billion by 2031. Carriers deploy thousands of street-level nodes to relieve macro congestion in sports venues, transit corridors, and enterprise campuses. Verizon alone installed more than 50,000 low-power units that fill indoor dead zones and enable symmetrical gigabit rates.
Permitting challenges and aesthetic restrictions once hampered small-cell scaling, but streamlined Federal Communications Commission rulings shortened municipal review from several months to under 60 days. Private networks further lift demand because small cells create dedicated on-premises coverage without relying on public spectrum. Vertical asset owners such as Crown Castle now report triple-digit growth in signed indoor contracts, underscoring how densification underpins the global 5G base station market.
Non-standalone deployments still held 57.95% share in 2025 as operators leveraged existing LTE cores for quick service launches. However the standalone cohort is maintaining a steep 29.35% CAGR, and its share of the 5G base station market size will exceed 60% by 2031. ATandT activated standalone slices for industrial clients needing deterministic latency, while T-Mobile extended nationwide standalone coverage that enables differentiated performance tiers.
Standalone architecture unlocks network slicing, distributed edge computing, and advanced encryption that non-standalone cannot deliver. Dish Network avoided legacy anchors and built an entirely cloud-native network, demonstrating lower operating expenses and rapid feature release cycles. Although core migration raises complexity and skills requirements, operators recognize the long-term revenue upside, accelerating orders for compatible radios and core software.
The 5G Base Station Market Report is Segmented by Type (Small Cell, Macro Cell), Architecture (Stand-Alone SA, Non-Stand-Alone NSA), Frequency Band (Sub-6 GHz, Mmwave 24-40 GHz), Power Rating (<=10 W, 10-40 W, >=40 W), MIMO Technology (Conventional MIMO, Massive MIMO >=64T64R), End User (Commercial Mobile Operators, Residential/Consumer FWA, and More), and Geography. The Market Forecasts are Provided in Terms of Value (USD).
Geography Analysis
Asia-Pacific commanded 41.10% share in 2025 thanks to China's 4.4 million live sites and a national mandate for near-universal coverage by 2025. Japan and South Korea moved early into standalone and edge-computing deployments, commercializing network slicing for manufacturing and media services. India's 2024 spectrum auctions unlocked capital from Bharti Airtel and Reliance Jio, with first-wave deployments in twenty-three cities during 2025 and rural extensions scheduled by 2027. Local semiconductor clusters in Taiwan and South Korea anchor component supply, reinforcing the region's influence on the global 5G base station market.
North America trails only marginally in volume and leads on millimeter-wave innovation. Verizon activated gigabit fixed wireless access in twenty-six states, while ATandT concentrates on enterprise private-cellular projects for cloud and edge workloads. Canada's auctions raised funding for rural expansion and mandated open-access roaming, stimulating incremental base-station demand. Regulatory patchwork at county and city levels slows permitting in some corridors, yet stimulus funds and tower-company build-leases sustain a healthy North American contribution to the 5G base station market.
The Middle-East and Africa region is the fastest-growing at 29.55% CAGR. Saudi Arabia's Vision 2030 digital blueprint finances nationwide 5G and positions Riyadh as a tech-hub for Arabic content delivery. The United Arab Emirates rolled out 5G across 97% of populated areas and now trials 5G-Advanced services. In Africa, Kenya and Nigeria favor wireless over fiber for broadband and fintech inclusion, but currency risk and energy cost inflate project budgets. Multilateral banks and vendor-financing schemes thus play a bigger role in realizing the continent's 5G aspirations.
- Huawei Technologies Co. Ltd
- ZTE Corporation
- Nokia Corporation
- Telefonaktiebolaget LM Ericsson
- Samsung Electronics Co. Ltd
- CommScope Holding Company Inc.
- Qualcomm Incorporated
- Qorvo Inc.
- Alpha Networks Inc.
- NEC Corporation
- Fujitsu Ltd
- Airspan Networks Holdings Inc.
- Mavenir Systems Inc.
- Parallel Wireless Inc.
- Baicells Technologies Co. Ltd
- JMA Wireless
- Comba Telecom Systems Holdings
- Sercomm Corp.
- ACE Technologies Corp.
- NEC Platforms, Ltd.
Additional Benefits:
- The market estimate (ME) sheet in Excel format
- 3 months of analyst support
TABLE OF CONTENTS
1 INTRODUCTION
- 1.1 Study Assumptions and Market Definition
- 1.2 Scope of the Study
2 RESEARCH METHODOLOGY
3 EXECUTIVE SUMMARY
4 MARKET LANDSCAPE
- 4.1 Market Overview
- 4.2 Market Drivers
- 4.2.1 Rising mobile data traffic and smartphone penetration
- 4.2.2 Superior latency and bandwidth advantages of 5G
- 4.2.3 Government spectrum auctions and infrastructure stimulus
- 4.2.4 Open-RAN driven brown-field upgrade cycle
- 4.2.5 mmWave small-cell roll-outs for private industrial 5G
- 4.2.6 Energy-efficient GaN PAs cutting total site OPEX
- 4.3 Market Restraints
- 4.3.1 High CAPEX and long ROI horizon
- 4.3.2 Spectrum fragmentation and regulatory delays
- 4.3.3 RF-front-end component supply bottlenecks
- 4.3.4 Sustainability compliance inflating site costs
- 4.4 Value / Supply-Chain Analysis
- 4.5 Regulatory Landscape
- 4.6 Technological Outlook
- 4.7 Porter's Five Forces
- 4.7.1 Bargaining Power of Suppliers
- 4.7.2 Bargaining Power of Buyers
- 4.7.3 Threat of New Entrants
- 4.7.4 Intensity of Competitive Rivalry
- 4.7.5 Threat of Substitutes
- 4.8 Investment Analysis
5 MARKET SIZE AND GROWTH FORECASTS (VALUE)
- 5.1 By Type
- 5.1.1 Small Cell
- 5.1.2 Macro Cell
- 5.2 By Architecture
- 5.2.1 Stand-Alone (SA)
- 5.2.2 Non-Stand-Alone (NSA)
- 5.3 By Frequency Band
- 5.3.1 Sub-6 GHz
- 5.3.2 mmWave (24-40 GHz)
- 5.4 By Power Rating
- 5.4.1 Less than or equal to 10 W
- 5.4.2 10-40 W
- 5.4.3 More than or equal to 40 W
- 5.5 By MIMO Technology
- 5.5.1 Conventional MIMO
- 5.5.2 Massive MIMO (More than 64T64R)
- 5.6 By End User
- 5.6.1 Commercial Mobile Operators
- 5.6.2 Residential/Consumer FWA
- 5.6.3 Industrial Private Networks
- 5.6.4 Government and Defense
- 5.6.5 Smart Cities and Public Safety
- 5.6.6 Other End Users
- 5.7 By Geography
- 5.7.1 North America
- 5.7.1.1 United States
- 5.7.1.2 Canada
- 5.7.1.3 Mexico
- 5.7.2 South America
- 5.7.2.1 Brazil
- 5.7.2.2 Argentina
- 5.7.2.3 Chile
- 5.7.2.4 Rest of South America
- 5.7.3 Europe
- 5.7.3.1 United Kingdom
- 5.7.3.2 Germany
- 5.7.3.3 France
- 5.7.3.4 Italy
- 5.7.3.5 Spain
- 5.7.3.6 Russia
- 5.7.3.7 Rest of Europe
- 5.7.4 Asia-Pacific
- 5.7.4.1 China
- 5.7.4.2 India
- 5.7.4.3 Japan
- 5.7.4.4 South Korea
- 5.7.4.5 Australia
- 5.7.4.6 Indonesia
- 5.7.4.7 Thailand
- 5.7.4.8 Malaysia
- 5.7.4.9 Vietnam
- 5.7.4.10 Philippines
- 5.7.4.11 Rest of Asia-Pacific
- 5.7.5 Middle East and Africa
- 5.7.5.1 Middle East
- 5.7.5.1.1 Saudi Arabia
- 5.7.5.1.2 United Arab Emirates
- 5.7.5.1.3 Turkey
- 5.7.5.1.4 Israel
- 5.7.5.1.5 Qatar
- 5.7.5.1.6 Rest of Middle East
- 5.7.5.2 Africa
- 5.7.5.2.1 South Africa
- 5.7.5.2.2 Nigeria
- 5.7.5.2.3 Kenya
- 5.7.5.2.4 Egypt
- 5.7.5.2.5 Rest of Africa
- 5.7.5.1 Middle East
- 5.7.1 North America
6 COMPETITIVE LANDSCAPE
- 6.1 Market Concentration
- 6.2 Strategic Moves
- 6.3 Market Share Analysis
- 6.4 Company Profiles (includes Global level Overview, Market level overview, Core Segments, Financials as available, Strategic Information, Market Rank/Share for key companies, Products and Services, and Recent Developments)
- 6.4.1 Huawei Technologies Co. Ltd
- 6.4.2 ZTE Corporation
- 6.4.3 Nokia Corporation
- 6.4.4 Telefonaktiebolaget LM Ericsson
- 6.4.5 Samsung Electronics Co. Ltd
- 6.4.6 CommScope Holding Company Inc.
- 6.4.7 Qualcomm Incorporated
- 6.4.8 Qorvo Inc.
- 6.4.9 Alpha Networks Inc.
- 6.4.10 NEC Corporation
- 6.4.11 Fujitsu Ltd
- 6.4.12 Airspan Networks Holdings Inc.
- 6.4.13 Mavenir Systems Inc.
- 6.4.14 Parallel Wireless Inc.
- 6.4.15 Baicells Technologies Co. Ltd
- 6.4.16 JMA Wireless
- 6.4.17 Comba Telecom Systems Holdings
- 6.4.18 Sercomm Corp.
- 6.4.19 ACE Technologies Corp.
- 6.4.20 NEC Platforms, Ltd.
7 MARKET OPPORTUNITIES AND FUTURE OUTLOOK
- 7.1 White-Space and Unmet-Need Assessment
 2026年5G基地台全球市場報告
 5G基地台市場-全球產業規模、佔有率、趨勢、機會與預測:按類型、網路架構、核心網、工作頻率、最終用戶、地區和競爭格局分類,2021-2031年
 5G基地台市場規模、佔有率和成長分析(按類型、組件、網路架構、運作頻率和地區分類)-產業預測(2026-2033年)
 5G基地台市場,按組件、類型、核心網路技術、頻段、最終用戶、國家和地區 - 2024-2032年產業分析、市場規模、市場佔有率和預測
 5G基地台市場規模、佔有率、趨勢分析報告:按類型、組件、網路架構、核心網路、運作頻率、最終用途、地區、細分市場預測,2024-2030年
 2030 年 5G基地台市場預測:按類型、組件、部署模式、頻段、網路架構、最終用戶和地區進行的全球分析5G基地台市場報告:2030年趨勢、預測與競爭分析
 2030 年亞太地區 5G 基地台市場預測 - 區域分析 - 按組件、頻段、小區類型和最終用戶
 北美 5G 基地台市場預測至 2030 年 - 區域分析 - 按組件、頻段、小區類型和最終用戶
 歐洲 5G 基地台市場預測至 2030 年 - 區域分析 - 按組件、頻段、小區類型和最終用戶