


 |
市場調查報告書
商品編碼
1940881
氣候變遷諮詢:市場佔有率分析、產業趨勢與統計、成長預測(2026-2031)Climate Change Consulting - Market Share Analysis, Industry Trends & Statistics, Growth Forecasts (2026 - 2031) |
||||||
※ 本網頁內容可能與最新版本有所差異。詳細情況請與我們聯繫。
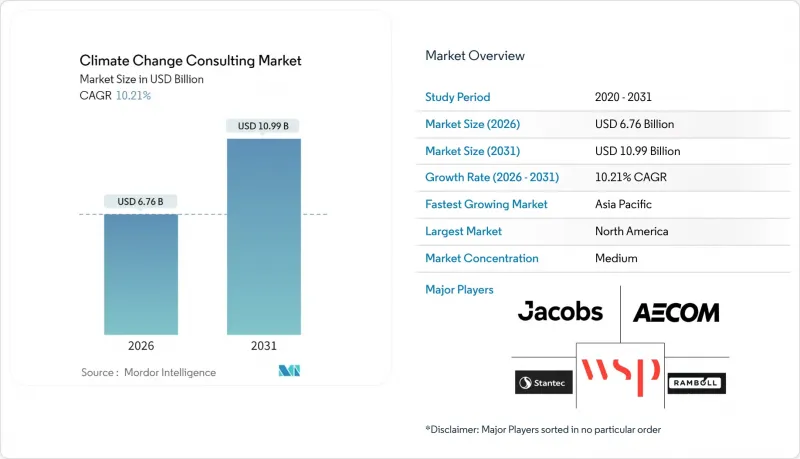
2025年氣候變遷諮詢市場價值為61.3億美元,預計2031年將達到109.9億美元,高於2026年的67.6億美元。
預計在預測期(2026-2031 年)內,複合年成長率將達到 10.21%。
這種加速成長反映了更嚴格的資訊揭露規則、投資者壓力、對永續發展相關融資日益成長的需求,以及人工智慧驅動的風險分析技術的快速發展。歐盟、美國和亞太地區強制性的ESG報告迫使數千家公司尋求外部諮詢,而私募股權所有者和資產管理公司在向投資組合公司放貸前,要求進行詳細的碳排放影子審核。同時,氣候風險建模的突破使諮詢顧問能夠以前所未有的精度量化轉型風險和實際風險,從而擴大了他們的目標基本客群。原始設備製造商(OEM)強制性的供應鏈脫碳正在為中小企業開闢新的收入來源,而數位化交付模式正在擴大地域覆蓋範圍,同時避免大量差旅對環境的影響。
全球氣候變遷諮詢市場趨勢與洞察
加強全球ESG資訊揭露義務
新的資訊揭露制度,例如歐洲企業永續性報告指令(CSRD),涵蓋了歐洲約5萬家公司,其中許多公司依賴外部顧問來解讀雙重重要性規則。新加坡、香港、馬來西亞和台灣已採納國際永續發展標準理事會(ISSB)的標準,這些標準將從2025年起分階段實施,從而擴大合規範圍。在美國,儘管美國證券交易委員會(SEC)的規則制定尚未完成,但情境分析和排放報告的準備工作已經展開。企業將合規視為創造價值的工具,而非成本中心,因此持續投入諮詢服務。將監管解讀與技術平台結合的顧問公司正在贏得多年合約。
投資者主導的碳影子審核
貝萊德等資產管理公司要求在分配資金前對範圍 1、2 和 3 的排放進行詳細檢驗,這推動了永續性實質審查工作的日益嚴格。私募股權買家正在將脫碳里程碑納入股東協議,從而產生以追蹤進度為中心的經常性諮詢收入。在轉型風險突出的能源、材料和交通運輸產業,碳影子審核的需求激增。提供符合審核要求的數據通訊協定和第三方檢驗的諮詢公司正逐漸成為機構投資者的首選供應商。這一趨勢也蔓延至中端市場交易,貸款機構正在將有關碳排放的合約條款納入貸款協議。
缺乏檢驗的範圍 3 數據
儘管價值鏈排放佔企業總排放的90%之多,但數據異質性和供應商參與度不足阻礙了準確計量。顧問公司往往依賴替代指標,削弱了投資者和監管機構的信心。新興經濟體的中小供應商缺乏監測工具,進一步限制了資訊揭露的可靠性。檢驗延遲導致保證聲明的發布延遲,並限制了諮詢業務的周轉率。因此,市場參與企業呼籲建立可互通的資料標準和第三方檢驗服務,以實現規模化發展。
細分市場分析
到2025年,風險評估和情境分析將佔氣候變遷諮詢市場佔有率的22.95%,顯示企業對符合氣候相關財務資訊揭露工作小組(TCFD)要求的前瞻性氣候模式有著強勁的需求。推動該領域成長的主要是銀行、保險公司和能源公司,它們希望獲得關於自身轉型風險和物理風險敞口的量化分析。永續金融和ESG獎勵雖然規模較小,但預計其成長速度將超過其他任何類別,到2031年複合年成長率將達到14.10%,因為融資定價激勵措施取決於能否實現可信的目標。諮詢顧問將分析和諮詢結合,提供整合情境輸入、KPI設計和外部檢驗的解決方案。
溫室氣體會計和報告的需求保持穩定,為下游策略提供了數據基礎。氣候適應和韌性規劃在面臨洪水和熱浪等重大自然威脅的基礎設施所有者中日益受到重視。碳抵銷交易諮詢的需求因自願市場價格波動和品質標準監管的明朗化而出現暫時性激增。自然解決方案諮詢和循環經濟設計等新興領域可作為現有投資組合的補充,並為能夠快速擴展其框架的早期採用者提供可選價值。
受獎勵策略推動的脫碳計劃和國家資訊揭露要求的驅動,公共部門在2025年將佔氣候變遷諮詢市場規模的18.75%。然而,金融服務業顯然是成長最快的產業,年增率達12.85%,這主要得益於監理機關將氣候風險納入資本監理。銀行需要先進的情境模型來對其投資組合進行壓力測試,而資產管理公司則希望獲得盡責管理藍圖,以便與被投資公司進行對話。
能源和電力客戶在轉型規劃方面投入龐大,因為他們的淨零排放藍圖涉及複雜的資產退役和可再生能源整合決策。製造商正在投資範圍3脫碳項目以維持原始設備製造商(OEM)契約,而礦業和金屬公司則在尋求節能策略以確保資金籌措到位。資訊通訊技術(ICT)供應商專注於資料中心效率和硬體輪調計劃,而農業和食品公司則致力於減少甲烷排放和推廣再生農業實踐。運輸公司正在探索能夠平衡成本、續航里程和基礎設施風險的車輛電氣化方案。
區域分析
北美在氣候變遷諮詢領域繼續保持領先地位,預計到2025年將佔據29.85%的市場佔有率,這得益於美國證券交易委員會(SEC)擬議的規則以及強勁的投資者活動。紐約和多倫多等主要金融中心叢集了高水準人才,四大審核事務所和專業精品顧問公司在此並存。該地區在採用基於人工智慧的氣候風險分析方面也處於主導,企業正利用數位雙胞胎加速資產韌性檢驗。
歐洲市場依然強勁,企業永續發展報告指令 (CSRD)、歐盟分類法和碳邊境調節措施等法規將適用範圍擴大至約 5 萬家公司。德國、英國和法國引領交易潮流,西班牙和義大利正透過其能源轉型獎勵策略迎頭趕上。由於各成員國的監管細節不盡相同,擁有泛歐交付網路和多語言團隊的顧問公司更具優勢。
亞太地區將以11.05%的複合年成長率(CAGR)實現最快成長,直至2031年。中國2060年淨零排放承諾、印度大規模部署可再生能源以及東南亞地區對基礎設施安全系統(ISSB)的採用,共同催生了前所未有的諮詢需求。日本和韓國需要先進的情境規劃來應對歐盟碳關稅帶來的出口風險。澳洲則優先考慮為基礎設施規劃中實施基於自然的碳移除和調適策略提供諮詢支援。
南美和中東/非洲地區是新興但波動較大的市場。早期催化劑包括巴西的森林砍伐資訊揭露規則、阿根廷的可再生能源競標以及哥倫比亞的綠色債券交易。在中東,沙烏地阿拉伯和阿拉伯聯合大公國正尋求擺脫對油氣資源的依賴,推動氫能藍圖和綠色金融措施的實施。非洲的需求受到金融能力和數據匱乏的限制,南非的碳排放稅合規問題以及肯亞的氣候適應農業舉措都構成了一定的限制。顧問公司若能將全球最佳實踐應用於該地區,雖然計劃利潤率可能會降低,但卻能為未來的擴張奠定策略基礎。
其他福利:
- Excel格式的市場預測(ME)表
- 3個月的分析師支持
目錄
第1章 引言
- 研究假設和市場定義
- 調查範圍
第2章調查方法
第3章執行摘要
第4章 市場情勢
- 市場概覽
- 市場促進因素
- 加強全球環境、社會及公司治理(ESG)資訊揭露要求
- 投資者要求對公司進行碳排放影子審核。
- 與永續發展相關的金融產品快速擴張
- 來自原始設備製造商的壓力,要求其供應鏈脫碳
- 人工智慧驅動的氣候風險分析取得突破
- 對基於自然的碳清除諮詢服務的需求日益成長
- 市場限制
- 缺乏檢驗的範圍 3排放數據
- 氣候科學與金融交叉領域的人才短缺
- 各地區碳定價機制不一致
- 由於擔心面臨「漂綠」訴訟,抑制採納相關建議
- 產業價值鏈分析
- 監管環境
- 技術展望
- 波特五力分析
- 供應商的議價能力
- 買方的議價能力
- 新進入者的威脅
- 替代品的威脅
- 競爭對手之間的競爭
- 服務趨勢分析
第5章 市場規模與成長預測
- 按服務類型
- 風險評估與情境分析
- 溫室氣體(GHG)會計與報告
- 脫碳策略和藍圖制定
- 氣候變遷調適與韌性規劃
- 碳抵銷與排放權交易諮詢服務
- 永續金融與ESG整合
- 其他服務
- 按最終用戶行業分類
- 能源與電力
- 採礦和金屬
- 公共部門
- 製造業
- 金融服務
- 資訊和通訊技術(ICT)和電訊
- 農業和食品
- 運輸/物流
- 其他行業
- 按組織規模
- 主要企業
- 小型企業
- 依諮詢類型
- 多學科工程公司
- 專注於永續發展的獨立顧問公司
- 四大審核公司
- 管理顧問公司
- 智庫和非政府組織(NGO)
- 按配送方式
- 現場諮詢
- 遠端/虛擬諮詢
- 混合式參與
- 按地區
- 北美洲
- 美國
- 加拿大
- 墨西哥
- 歐洲
- 德國
- 英國
- 法國
- 西班牙
- 義大利
- 其他歐洲地區
- 亞太地區
- 中國
- 日本
- 印度
- 韓國
- 亞太其他地區
- 南美洲
- 巴西
- 阿根廷
- 南美洲其他地區
- 中東和非洲
- 中東
- 以色列
- 沙烏地阿拉伯
- 阿拉伯聯合大公國
- 土耳其
- 其他中東地區
- 非洲
- 南非
- 埃及
- 其他非洲地區
- 中東
- 北美洲
第6章 競爭情勢
- 市場集中度
- 策略趨勢
- 市佔率分析
- 公司簡介
- Jacobs Solutions Inc.
- AECOM
- WSP Global Inc.
- Stantec Inc.
- Ramboll Group A/S
- Tetra Tech Inc.
- ERM International Group Ltd.
- Arup Group Ltd.
- GHD Group Pty Ltd.
- Sweco AB
- Deloitte Touche Tohmatsu Ltd.
- PricewaterhouseCoopers International Ltd.
- KPMG International Ltd.
- Ernst and Young Global Ltd.
- McKinsey and Company
- Boston Consulting Group Inc.
- ICF International Inc.
- South Pole Holding AG
- Carbon Trust Advisory Ltd.
- Sustainalytics
第7章 市場機會與未來展望
The climate change consulting market was valued at USD 6.13 billion in 2025 and estimated to grow from USD 6.76 billion in 2026 to reach USD 10.99 billion by 2031, at a CAGR of 10.21% during the forecast period (2026-2031).
This acceleration reflects tighter disclosure rules, investor pressure, growing demand for sustainability-linked finance, and rapid advances in AI-enabled risk analytics. Mandatory ESG reporting across the European Union, the United States, and Asia-Pacific is forcing thousands of companies to seek external advice, while private-equity owners and asset managers expect detailed carbon-shadow audits before financing portfolio firms. At the same time, breakthroughs in climate-risk modeling allow consultants to quantify transition and physical hazards with unprecedented granularity, expanding the addressable client base. Supply-chain decarbonization mandates imposed by original equipment manufacturers (OEMs) are opening new revenue pools among small and medium enterprises (SMEs), and digital delivery models are widening geographic reach without heavy travel footprints.
Global Climate Change Consulting Market Trends and Insights
Mandatory ESG disclosures tightening worldwide
New disclosure regimes such as the Corporate Sustainability Reporting Directive (CSRD) cover roughly 50,000 European companies, and many are turning to external advisors to interpret double-materiality rules. Singapore, Hong Kong, Malaysia, and Taiwan have adopted International Sustainability Standards Board (ISSB) baselines that phase in from 2025, widening the compliance net. In the United States, pending Securities and Exchange Commission rules have already spurred preparatory scenario analysis and emissions reporting exercises. Enterprises view compliance as a value-creation lever rather than a cost center, which underpins sustained spending on advisory services. Consultants who combine regulatory interpretation with technology platforms are winning multiyear mandates.
Investor-led carbon-shadow audits
Asset managers such as BlackRock demand granular verification of Scope 1, 2, and 3 emissions before allocating capital, elevating the rigour of sustainability due diligence workstreams. Private-equity buyers now embed decarbonization milestones in shareholder agreements, creating recurring advisory revenue around progress tracking. Carbon-shadow audits have proliferated in energy, materials, and transport portfolios where transition risk is pronounced. Consultants offering audit-ready data protocols and third-party verification gain preferred-supplier status with institutional investors. This trend cascades into middle-market deals as lenders embed emissions covenants in credit facilities.
Scarcity of verifiable Scope 3 data
Supply-chain emissions account for as much as 90% of a corporation's footprint, yet data heterogeneity and lack of supplier engagement impede accurate measurement. Consultants often rely on proxy values, which erode confidence among investors and regulators. Smaller suppliers in emerging economies lack monitoring tools, further constraining disclosure reliability. Verification backlogs delay assurance statements, limiting advisory turnover. Market participants, therefore, demand interoperable data standards and third-party validation services to unlock scale.
Other drivers and restraints analyzed in the detailed report include:
- Sustainability-linked finance boom
- OEM-driven supply-chain decarbonization
- Talent shortage at climate-finance interface
For complete list of drivers and restraints, kindly check the Table Of Contents.
Segment Analysis
Risk Assessment and Scenario Analysis accounted for 22.95% of the climate change consulting market share in 2025, underscoring corporate appetite for forward-looking climate models that meet Task Force on Climate-related Financial Disclosures requirements. The segment's growth is propelled by banks, insurers, and energy companies seeking quantitative insights into transition and physical risk exposure. Sustainable Finance and ESG Integration, while smaller, is outpacing every other category with a 14.10% CAGR to 2031 as loan-pricing incentives hinge on credible targets. Consultants are packaging analytics with advisory to create integrated solutions that bundle scenario inputs, KPI design, and external verification.
Demand for GHG Accounting and Reporting remains steady because it provides the data foundation for downstream strategy. Climate Adaptation and Resilience Planning gains traction among infrastructure owners that face material physical threats such as flooding and heat stress. Carbon Offset and Trading Advisory sees episodic volume spikes linked to voluntary-market price swings and regulatory clarity on quality standards. Emerging niches such as nature-based solutions advisory and circular-economy design round out the portfolio, representing option value for early movers that can scale frameworks quickly.
The Public Sector commanded 18.75% of the climate change consulting market size in 2025, thanks to stimulus-funded decarbonization projects and sovereign-level disclosure obligations. Yet Financial Services is the clear momentum leader, expanding at 12.85% per year as prudential supervisors embed climate risk into capital frameworks. Banks require sophisticated scenario models to stress-test portfolios, while asset managers seek stewardship roadmaps to engage investee firms.
Energy and Power clients remain large spenders on transition planning because net-zero roadmaps involve complex asset-retirement and renewable-integration decisions. Manufacturing industries invest in Scope 3 decarbonization programs to keep OEM contracts, while Mining and Metals firms pursue nature-positive strategies to secure financing. ICT providers focus on data-center efficiency and circular-hardware programs, whereas Agriculture and Food players tackle methane reduction and regenerative practices. Transport companies look for fleet electrification blueprints that balance cost, range, and infrastructure risk.
The Climate Change Consulting Market Report is Segmented by Service Type (Risk Assessment and Scenario Analysis, and More), End-User Industry (Energy and Power, and More), Organization Size (Large Enterprises, and More), Consultancy Type (Multidisciplinary Engineering Firms, and More), Delivery Mode (On-Site Advisory, and More), and Geography (North America, and More). The Market Forecasts are Provided in Terms of Value (USD).
Geography Analysis
North America retained leadership with 29.85% climate change consulting market share in 2025 on the back of Securities and Exchange Commission draft rules and robust investor activism. Major financial centers such as New York and Toronto host both Big Four hubs and pure-play boutiques, creating dense talent clusters. The region also leads AI-based climate-risk analytics adoption as enterprises pilot digital twins to test asset resilience.
Europe remains a powerhouse thanks to the CSRD, EU taxonomy, and carbon-border adjustment rules that collectively expand the compliance universe to roughly 50,000 firms. Germany, the United Kingdom, and France drive deal flow, while Spain and Italy catch up via energy-transition stimulus. Consultants with pan-European delivery networks and multilingual teams enjoy an advantaged positioning because regulatory nuances differ among member states.
Asia-Pacific records the fastest growth at 11.05% CAGR through 2031 as China's 2060 net-zero pledge, India's massive renewable roll-out, and Southeast Asia's ISSB adoption converge to create unprecedented advisory demand. Japan and South Korea require advanced scenario planning to manage export exposure to EU carbon tariffs. Australia leans on consulting support to implement nature-based carbon removal and adaptation strategies in infrastructure planning.
South America and the Middle East & Africa represent emerging but volatile markets. Brazil's deforestation-related disclosure rules, Argentina's renewable auctions, and Colombia's green-bond pipeline are early catalysts. In the Middle East, Saudi Arabia and the United Arab Emirates seek diversification from hydrocarbons, generating mandates in hydrogen road-mapping and green-finance structuring. Africa's demand is concentrated in South Africa's carbon-tax compliance and Kenya's climate-resilient agriculture initiatives, albeit constrained by fiscal capacity and data gaps. Consultants that package global best practices with localized delivery endure lower project margins but gain strategic footholds for future expansion.
- Jacobs Solutions Inc.
- AECOM
- WSP Global Inc.
- Stantec Inc.
- Ramboll Group A/S
- Tetra Tech Inc.
- ERM International Group Ltd.
- Arup Group Ltd.
- GHD Group Pty Ltd.
- Sweco AB
- Deloitte Touche Tohmatsu Ltd.
- PricewaterhouseCoopers International Ltd.
- KPMG International Ltd.
- Ernst and Young Global Ltd.
- McKinsey and Company
- Boston Consulting Group Inc.
- ICF International Inc.
- South Pole Holding AG
- Carbon Trust Advisory Ltd.
- Sustainalytics
Additional Benefits:
- The market estimate (ME) sheet in Excel format
- 3 months of analyst support
TABLE OF CONTENTS
1 INTRODUCTION
- 1.1 Study Assumptions and Market Definition
- 1.2 Scope of the Study
2 RESEARCH METHODOLOGY
3 EXECUTIVE SUMMARY
4 MARKET LANDSCAPE
- 4.1 Market Overview
- 4.2 Market Drivers
- 4.2.1 Mandatory ESG disclosures tightening worldwide
- 4.2.2 Corporate carbon-shadow audits demanded by investors
- 4.2.3 Rapid scaling of sustainability-linked finance instruments
- 4.2.4 Supply-chain decarbonisation pressures from OEMs
- 4.2.5 Breakthroughs in AI-driven climate-risk analytics
- 4.2.6 Growing demand for nature-based carbon removal advisory
- 4.3 Market Restraints
- 4.3.1 Scarcity of verifiable Scope 3 emissions data
- 4.3.2 Talent shortage in climate science and finance interface
- 4.3.3 Inconsistent regional carbon-pricing mechanisms
- 4.3.4 Green-washing litigation risk discouraging advisory uptake
- 4.4 Industry Value Chain Analysis
- 4.5 Regulatory Landscape
- 4.6 Technological Outlook
- 4.7 Porter's Five Forces Analysis
- 4.7.1 Bargaining Power of Suppliers
- 4.7.2 Bargaining Power of Buyers
- 4.7.3 Threat of New Entrants
- 4.7.4 Threat of Substitutes
- 4.7.5 Competitive Rivalry
- 4.8 Service Trend Analysis
5 MARKET SIZE AND GROWTH FORECASTS (VALUE)
- 5.1 By Service Type
- 5.1.1 Risk Assessment and Scenario Analysis
- 5.1.2 GHG Accounting and Reporting
- 5.1.3 Decarbonisation Strategy and Road-mapping
- 5.1.4 Climate Adaptation and Resilience Planning
- 5.1.5 Carbon Offset and Trading Advisory
- 5.1.6 Sustainable Finance and ESG Integration
- 5.1.7 Other Services
- 5.2 By End-User Industry
- 5.2.1 Energy and Power
- 5.2.2 Mining and Metals
- 5.2.3 Public Sector
- 5.2.4 Manufacturing
- 5.2.5 Financial Services
- 5.2.6 ICT and Telecom
- 5.2.7 Agriculture and Food
- 5.2.8 Transportation and Logistics
- 5.2.9 Other Industries
- 5.3 By Organization Size
- 5.3.1 Large Enterprises
- 5.3.2 Small and Medium Enterprises
- 5.4 By Consultancy Type
- 5.4.1 Multidisciplinary Engineering Firms
- 5.4.2 Pure-play Sustainability Boutiques
- 5.4.3 Big Four Accounting Firms
- 5.4.4 Management Consulting Firms
- 5.4.5 Think Tanks and NGOs
- 5.5 By Delivery Mode
- 5.5.1 On-site Advisory
- 5.5.2 Remote / Virtual Advisory
- 5.5.3 Hybrid Engagements
- 5.6 By Geography
- 5.6.1 North America
- 5.6.1.1 United States
- 5.6.1.2 Canada
- 5.6.1.3 Mexico
- 5.6.2 Europe
- 5.6.2.1 Germany
- 5.6.2.2 United Kingdom
- 5.6.2.3 France
- 5.6.2.4 Spain
- 5.6.2.5 Italy
- 5.6.2.6 Rest of Europe
- 5.6.3 Asia-Pacific
- 5.6.3.1 China
- 5.6.3.2 Japan
- 5.6.3.3 India
- 5.6.3.4 South Korea
- 5.6.3.5 Rest of Asia-Pacific
- 5.6.4 South America
- 5.6.4.1 Brazil
- 5.6.4.2 Argentina
- 5.6.4.3 Rest of South America
- 5.6.5 Middle East and Africa
- 5.6.5.1 Middle East
- 5.6.5.1.1 Israel
- 5.6.5.1.2 Saudi Arabia
- 5.6.5.1.3 United Arab Emirates
- 5.6.5.1.4 Turkey
- 5.6.5.1.5 Rest of Middle East
- 5.6.5.2 Africa
- 5.6.5.2.1 South Africa
- 5.6.5.2.2 Egypt
- 5.6.5.2.3 Rest of Africa
- 5.6.5.1 Middle East
- 5.6.1 North America
6 COMPETITIVE LANDSCAPE
- 6.1 Market Concentration
- 6.2 Strategic Moves
- 6.3 Market Share Analysis
- 6.4 Company Profiles (includes Global level Overview, Market level overview, Core Segments, Financials as available, Strategic Information, Market Rank/Share for key companies, Products and Services, and Recent Developments)
- 6.4.1 Jacobs Solutions Inc.
- 6.4.2 AECOM
- 6.4.3 WSP Global Inc.
- 6.4.4 Stantec Inc.
- 6.4.5 Ramboll Group A/S
- 6.4.6 Tetra Tech Inc.
- 6.4.7 ERM International Group Ltd.
- 6.4.8 Arup Group Ltd.
- 6.4.9 GHD Group Pty Ltd.
- 6.4.10 Sweco AB
- 6.4.11 Deloitte Touche Tohmatsu Ltd.
- 6.4.12 PricewaterhouseCoopers International Ltd.
- 6.4.13 KPMG International Ltd.
- 6.4.14 Ernst and Young Global Ltd.
- 6.4.15 McKinsey and Company
- 6.4.16 Boston Consulting Group Inc.
- 6.4.17 ICF International Inc.
- 6.4.18 South Pole Holding AG
- 6.4.19 Carbon Trust Advisory Ltd.
- 6.4.20 Sustainalytics
7 MARKET OPPORTUNITIES AND FUTURE OUTLOOK
- 7.1 White-space and Unmet-need Assessment
 2026年全球天基氣候工程市場報告2026年全球氣候變遷諮詢市場報告
 城市噪音映射市場預測至2034年-按組件、部署模式、噪音類型、應用、最終用戶和地區分類的全球分析
 2026-2030年全球氣候風險分析平台市場
 氣候適應建築材料市場分析與預測(至2035年):類型、產品、技術、應用、材料類型、最終用戶、功能、安裝類型、解決方案氣候風險分析市場分析及預測(至2035年):依類型、產品類型、服務、技術、組件、應用、部署類型、最終用戶及解決方案分類氣候風險分析市場預測至2032年:按組件、風險類型、部署類型、組織規模、應用、最終用戶和地區分類的全球分析
 氣候變遷諮詢市場規模、佔有率和成長分析(按服務類型、客戶類型、最終用戶和地區分類)—2026-2033年產業預測全球氣候風險諮詢市場:預測至 2032 年-按服務類型、組織規模、部署方式、最終使用者和地區分類的分析氣候風險市場預測至2032年:按服務類型、部署類型、技術、最終用戶和地區分類的全球分析