


 |
市場調查報告書
商品編碼
1940858
交流/直流電源適配器:市場佔有率分析、產業趨勢與統計、成長預測(2026-2031)AC DC Power Adapters - Market Share Analysis, Industry Trends & Statistics, Growth Forecasts (2026 - 2031) |
||||||
※ 本網頁內容可能與最新版本有所差異。詳細情況請與我們聯繫。
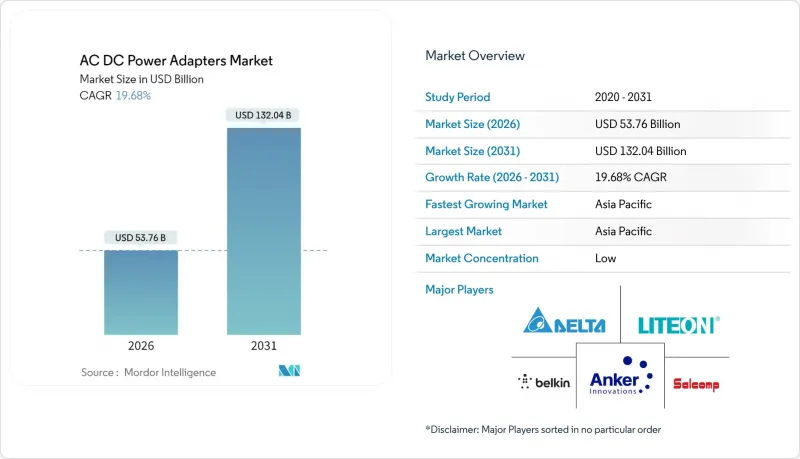
2025年,AC/DC電源供應器市值為449.2億美元,預計2031年將達到1,320.4億美元,而2026年為537.6億美元。
預測期(2026-2031 年)的複合年成長率預計為 19.68%。
USB-C 電源傳輸標準的製定、GaN 技術的快速普及以及對監管效率的需求,共同推動了這一成長趨勢。製造商受益於更高的功率/重量比,從而能夠實現緊湊的多設備充電設計。隨著企業硬體和電動車基礎設施對擴充性解決方案的需求不斷成長,高功率(>100W)市場將擴大其收入基礎。永續性目標正在加速模組化適配器和回收計劃的推廣,將合規成本轉化為在 AC-DC 電源適配器市場關鍵全部區域實現品牌差異化的手段。
全球AC-DC電源供應器市場趨勢與洞察
USB-C 電源傳輸 (PD) 標準的日益普及
USB-C PD 3.1 支援高達 240W 的功率,可實現高性能筆記型電腦和工業設備的單線充電。歐盟 USB-C 強制法規將於 2024 年 12 月生效,屆時將促使原始設備製造商 (OEM) 實現連接埠標準化,從而推動售後市場對獨立充電器的需求。同時,IEC 62368-1 等安全標準也不斷發展完善,確保即使功率提升也能維持低故障率。線纜整合使企業能夠受益於更整潔的工作空間和更低的庫存成本。這一趨勢也正在擴展到工業控制設備、銷售終端和醫療推車等領域,從而將 AC-DC 電源適配器市場納入跨產業的電源生態系統。
家用電子電器的普及
十年前,一般家庭平均擁有7-10台需要充電的設備,現在只有3-4台。混合辦公環境需要桌面電源轉接器,能夠為筆記型電腦提供100W或更高的功率,同時還能支援平板電腦和穿戴式裝置。蘋果在iPhone 15和16系列中採用USB-C介面,開啟了配件更新換代的周期,使AC/DC電源轉接器市場的所有廠商都從中受益。人工智慧筆記型電腦的出現提高了其穩定電力消耗,使得140W適配器從小眾產品變成了主流選擇。廠商們隨即推出了GaN充電器,兼顧了散熱和便攜性,延長了產品壽命,並緩解了電子廢棄物問題。
嚴格的全球安全和EMI/EMC認證成本
EN61204-3 和 FCC B 類認證要求高達 30kW 的輻射和傳導發射測試,這會佔用中小企業高達 25% 的研發預算。醫療適配器還必須符合 IEC/EN60601-1 的漏電流和絕緣要求,這將使每個產品系列的成本增加超過 5 萬美元。在供應中斷期間頻繁更換零件需要進行完整的重新測試,從而造成庫存風險。知名品牌正在建立自己的實驗室以加快研發進度,這進一步加劇了 AC-DC 電源供應器市場的資源缺口。
細分市場分析
到2025年,行動裝置和平板電腦細分市場將貢獻30.78%的最大收入,這主要得益於智慧型手機和平板電腦普及率的不斷提高。然而,預計到2031年,電動車充電適配器細分市場的複合年成長率將達到22.50%,在所有行業中位居榜首。這一快速成長反映了全球範圍內的充電樁安裝補貼以及汽車製造商之間互通性舉措。鐵路車輛段採用800V架構,需要配備碳化矽整流器的高功率直流-直流適配器,這在交流-直流電源適配器市場催生了一個高階價格區間。升級到人工智慧筆記型電腦的需求也將推動收入成長,但成長要素是單一設備功率的提升,而非個人電腦流通數量的增加。
汽車和消費品設計的相互影響正在加速車載資訊娛樂主機採用 USB-C PD 介面。隨著里程焦慮的緩解,駕駛者希望能夠同時為車載設備、筆記型電腦、 VR頭戴裝置和車載冰箱等設備充電,從而推動了對多連接埠轉接器的需求。雖然工業自動化領域目前規模仍然小規模,但全天候運作技術正在為可靠的 24V 適配器帶來穩定的售後服務收入。能夠使其產品藍圖檢驗週期與汽車製造商認證計劃保持一致的供應商,將能夠在 AC-DC 電源適配器市場獲得永續的佔有率。
預計到2025年,16-45W功率等級的電源轉接器將佔總收入的26.39%,主要得益於智慧型手機和平板電腦的出貨量成長。然而,101-240W功率等級的電源轉接器預計將以21.95%的複合年成長率成長,主要由工作站筆記型電腦、桌上型電腦替代充電器和掌上遊戲機等產品推動。氮化鎵(GaN)開關元件帶來的250%功率密度提升,不僅縮小了面積,還提供了高效的散熱性能,使廠商能夠在不增加尺寸的情況下收取更高的價格。隨著功率預算的增加,最佳化電感設計和閘極驅動將成為AC-DC電源供應器市場的關鍵差異化因素。
由於無線充電的普及和高效SoC的廣泛應用,15W以下功率的電源適配器市場營收成長放緩。 46-100W功率的電源適配器仍然是主流筆記型電腦生態系統的核心,但其市場佔有率正受到能夠同時為智慧型手機、平板電腦和筆記型電腦充電的高功率適配器的蠶食。企業IT負責人越來越傾向於選擇整合式240W擴充塢,這種擴充座可以減少桌面雜亂,並簡化多年的裝置更新週期。這使得寬能能隙晶片從尖端創新轉變為AC-DC電源適配器市場的基本配置。
區域分析
預計到2025年,亞太地區將佔全球營收佔有率的44.80%,並在2031年之前以22.35%的複合年成長率成長。中國垂直整合的供應鏈有效降低了零件成本,而台灣晶圓代工廠則供應為全球創新提供動力的氮化鎵外延晶圓。韓國智慧型手機OEM製造商和日本精密設備製造商構成了強大的價值鏈,鞏固了主導地位。
北美市場的發展動力主要來自企業對100W以上桌上型充電器日益成長的需求,以及加州和東北部各州積極推動的電動車基礎設施建設。美國能源局(DoE)的六級能源效率標準正在推動節能型拓樸結構的早期應用,並影響財富500強企業的採購政策。這使得北美成為AC-DC電源供應器市場中高價值、高利潤設計方案的試驗場。
在歐洲,嚴格的監管與對永續性的重視相結合。通用充電器指令加速了USB-C介面在整個地區的普及,並刺激了對符合PD標準的充電器的售後市場需求。二級CoC能源效率標準正在推動向寬能能隙的過渡,而循環經濟法案則鼓勵模組化適配器和回收計劃的實施。東歐契約製造憑藉其具有成本競爭力的產品,正在贏得市場佔有率,成為亞洲產品的有力競爭者,從而分散了全球AC-DC電源適配器市場的風險。
儘管絕對收入較低,但中東、非洲和南美洲的新興經濟體仍實現了兩位數的成長率。巴西和阿根廷透過家用電子電器進口和可再生能源併網,為南美洲的經濟成長提供支持,而這離不開工業級適配器。波灣合作理事會(GCC)的基礎設施建設以及非洲以行動優先的技術生態系統,都需要能夠承受電網不穩定的可靠充電器。供應商根據當地電壓標準和價格敏感度客製化產品,正在推動交流/直流電源適配器市場的新需求。
其他福利:
- Excel格式的市場預測(ME)表
- 3個月的分析師支持
目錄
第1章 引言
- 研究假設和市場定義
- 調查範圍
第2章調查方法
第3章執行摘要
第4章 市場情勢
- 市場概覽
- 市場促進因素
- USB-C 電源傳輸 (PD) 標準的廣泛應用
- 消費性電子設備(智慧型手機、筆記型電腦、平板電腦)的普及
- 汽車配件和售後電動汽車適配器的快速電氣化
- 加強能源效率法規(美國能源局第六級,歐盟碳排放交易體系第五版)
- 整合氮化鎵和碳化矽半導體以提高每瓦效率
- OEM廠商對模組化適配器以適應循環經濟的興趣日益濃厚。
- 市場限制
- 嚴格的全球安全標準和EMI/EMC認證成本
- 原料(銅、鐵氧體磁芯)價格波動
- 消費者擴大轉向無線充電板
- OEM廠商將適配器整合到設備定價中
- 產業價值鏈分析
- 監管環境
- 技術展望
- 宏觀經濟因素如何影響市場
- 波特五力分析
- 供應商的議價能力
- 買方的議價能力
- 新進入者的威脅
- 替代品的威脅
- 競爭對手之間的競爭
第5章 市場規模與成長預測
- 按最終用戶行業分類
- 消費者
- 個人電腦
- 筆記型電腦
- 行動裝置
- 其他消費品
- 車
- 電動車充電適配器
- 車載資訊娛樂系統及配件
- 產業
- 消費者
- 額定功率
- ≤15 瓦
- 16-45 W
- 46-100 W
- 101-240 W
- 按連接埠類型
- 單埠
- 多埠(2至4個連接埠)
- 超多埠(5 個或更多連接埠/GaN 擴充座)
- 按外形規格
- 牆壁插座(固定插銷)
- 可拆式插頭(可更換)
- 桌上型電腦(Brick)
- 嵌入式/基板安裝
- 按地區
- 北美洲
- 美國
- 加拿大
- 墨西哥
- 南美洲
- 巴西
- 阿根廷
- 其他南美洲
- 歐洲
- 德國
- 英國
- 法國
- 俄羅斯
- 其他歐洲地區
- 亞太地區
- 中國
- 日本
- 印度
- 韓國
- 東南亞
- 亞太其他地區
- 中東和非洲
- 中東
- 沙烏地阿拉伯
- 阿拉伯聯合大公國
- 其他中東地區
- 非洲
- 南非
- 埃及
- 其他非洲地區
- 中東
- 北美洲
第6章 競爭情勢
- 市場集中度
- 策略趨勢
- 市佔率分析
- 公司簡介
- Delta Electronics, Inc.
- Lite-On Technology Corporation
- Belkin International, Inc.(a Foxconn subsidiary)
- Anker Innovations Technology Co., Ltd.
- Shenzhen Huntkey Electric Co., Ltd.
- Salcomp PLC
- Flex Ltd.
- Mean Well Enterprises Co., Ltd.
- Phihong Technology Co., Ltd.
- TDK-Lambda Corporation
- Chicony Power Technology Co., Ltd.
- FSP Group
- Guangzhou Shengyang Electronics Co., Ltd.
- Momax Technology(HK)Ltd.
- Alphatec, Inc.(Aukey)
- RAVPower(Shenzhen Sunvalley)
- Mophie LLC(ZAGG Inc.)
- Ugreen Group Ltd.
- PNY Technologies, Inc.
- Samsung Electronics Co., Ltd.(Power Adapter Division)
- Apple Inc.(Power Adapter Engineering Group)
- Xiaomi Inc.(Accessory Business Unit)
- Oppo Electronics Corp.(SuperVOOC Chargers)
第7章 市場機會與未來展望
The AC DC power adapters market was valued at USD 44.92 billion in 2025 and estimated to grow from USD 53.76 billion in 2026 to reach USD 132.04 billion by 2031, at a CAGR of 19.68% during the forecast period (2026-2031).
Standardization around USB-C Power Delivery, rapid GaN adoption, and regulatory efficiency mandates collectively drive this trajectory. Manufacturers benefit from higher watt-per-gram ratios that allow compact, multi-device charging designs. High-power segments above 100 W widen profit pools as enterprise hardware and EV infrastructure demand scalable solutions. Sustainability targets accelerate modular adapters and take-back programs, turning compliance costs into brand differentiation levers across every major region of the AC-DC power adapters market.
Global AC DC Power Adapters Market Trends and Insights
Growing Adoption of USB-C Power Delivery (PD) Standards
USB-C PD 3.1 now supports up to 240 W, enabling single-cable charging for high-performance laptops and industrial equipment. Mandatory USB-C rules in the EU, effective since December 2024, compel OEMs to unify ports, which widens aftermarket demand for standalone chargers. Safety frameworks, such as IEC 62368-1, evolve in parallel, keeping failure rates low even as wattage increases. Enterprises benefit from cable consolidation that reduces workspace clutter and lowers inventory costs. The trend permeates industrial controls, point-of-sale kiosks, and medical carts, entrenching the AC DC power adapters market in cross-sector power-delivery ecosystems.
Proliferation of Consumer Electronics
Households now manage 7-10 charge-dependent devices, up from 3-4 a decade ago. Hybrid work environments require desktop hubs that allocate 100 W or more to laptops while sustaining tablets and wearables. Apple's transition to USB-C across the iPhone 15 and 16 families unlocked accessory refresh cycles that benefit every vendor in the AC DC power adapters market. AI-capable laptops increase steady-state power draw, making 140 W bricks a mainstream option instead of a niche one. Manufacturers respond by releasing GaN chargers that balance thermal load and portability, thereby extending product life and alleviating electronic waste concerns.
Stringent Global Safety and EMI/EMC Certification Costs
EN61204-3 and FCC Class B compliance demand exhaustive radiated and conducted emission tests up to 30 kW, absorbing as much as 25% of engineering budgets for smaller firms. Medical adapters must also satisfy IEC/EN60601-1 leakage and isolation clauses, adding USD 50,000 or more per product family. Component substitutions common during supply disruptions trigger full retest cycles, creating inventory risk. Larger brands internalize labs to shorten schedules, widening the resource gap in the AC-DC power adapters market.
Other drivers and restraints analyzed in the detailed report include:
- Rapid Electrification of Automotive Accessories and Aftermarket EV Adapters
- Rising Energy-Efficiency Regulations
- Volatility in Raw-Material Prices
For complete list of drivers and restraints, kindly check the Table Of Contents.
Segment Analysis
The mobile devices and tablets segment generated the largest revenue in 2025, at 30.78%, driven by the ubiquity of smartphones and rising tablet penetration. Still, the EV charging-adapter category is forecast to register a 22.50% CAGR to 2031, the highest among all industries. This leap mirrors global charger-installation subsidies and automaker interoperability initiatives. Fleet depots adopt 800 V architectures that require robust DC-to-DC adapters with SiC rectifiers, creating premium price tiers within the AC DC power adapters market size. Consumers upgrading to AI-ready laptops also add revenue, yet growth stems more from higher wattage per unit than from additional PCs entering circulation.
Cross-pollination between automotive and consumer designs accelerates the deployment of USB-C PD in in-vehicle infotainment consoles. As range anxiety diminishes, drivers expect cabin devices, laptops, VR headsets, and refrigeration units to charge concurrently, elevating multi-port demand. Industrial automation remains a smaller slice, but round-the-clock robotics creates sticky after-sales revenue for high-reliability 24 V adapters. Vendors that align road-map validation cycles with automaker qualification timelines gain a durable share in the AC-DC power adapters market.
The 16-45 W class held 26.39% of 2025 revenue, supported by smartphone and tablet shipments. However, the 101-240 W bracket is projected to clock a 21.95% CAGR, propelled by workstation laptops, desktop replacement chargers, and portable gaming consoles. The 250% power-density gain from GaN switching elements compresses the footprint while dissipating heat effectively, allowing vendors to charge price premiums without incurring size penalties. As power budgets increase, inductor design and gate-drive optimization become key differentiation points in the AC-DC power adapter market.
Below 15 W, wireless substitution and power-efficient SoCs slow revenue expansion. The 46-100 W segment remains core to mainstream laptop ecosystems but faces cannibalization from high-power bricks that simultaneously support phones, tablets, and laptops. Enterprise IT buyers tend to gravitate toward unified 240 W docks, which reduce desk clutter and spark multi-year refresh cycles. Wide-bandgap chips thus transition from a flagship novelty to a baseline requirement in the AC-DC power adapter market.
The AC DC Power Adapters Market Report is Segmented by End-User Industry (Consumer Personal Computers, Laptops, Mobile Devices, and More), Output Power Rating (<=15W, 16-45W, 46-100W, and More), Port Type (Single-Port, and More), Form Factor (Wall Plug Fixed-Pin, Detachable Plug Interchangeable, and More), and Geography (North America, South America, Europe, and More). The Market Forecasts are Provided in Terms of Value (USD).
Geography Analysis
Asia-Pacific held a 44.80% revenue share in 2025 and is forecast to post a 22.35% CAGR through 2031. China's vertically integrated supply chain keeps component costs low, while Taiwan's foundries supply GaN epi-wafers that underpin global innovation. South Korea's smartphone OEMs and Japan's precision engineering firms round out a robust value chain that anchors leadership in the AC-DC power adapter market.
North America follows with strong enterprise uptake of 100 W-plus desktop chargers and aggressive EV infrastructure rollouts in California and northeastern states. DoE Level VI rules push early adoption of energy-efficient topologies that ripple through the procurement policies of Fortune 500 firms. The region thus serves as a proving ground for premium, high-margin designs inside the AC-DC power adapters market.
Europe combines regulatory heft with sustainability orientation. The common-charger directive accelerated the ubiquity of USB-C across the bloc and catalyzed aftermarket demand for PD-compliant chargers. Tier 2 CoC efficiency regulations stimulate wide-bandgap migration, while circular-economy legislation rewards modular adapters and take-back schemes. Eastern European contract manufacturers are gaining market share as cost-competitive alternatives to Asian sources, thereby diversifying risk across the global AC-DC power adapters market.
Emerging economies in the Middle East, Africa, and South America contribute smaller absolute revenue but deliver double-digit growth. Brazil and Argentina anchor South American expansion through consumer electronics imports and renewable energy integrations that rely on industrial-grade adapters. Gulf Cooperation Council infrastructure upgrades and Africa's mobile-first tech ecosystems require ruggedized chargers that withstand grid instability. Vendors tailoring products to local voltage norms and price sensitivities add incremental volume to the AC-DC power adapters market.
- Delta Electronics, Inc.
- Lite-On Technology Corporation
- Belkin International, Inc. (a Foxconn subsidiary)
- Anker Innovations Technology Co., Ltd.
- Shenzhen Huntkey Electric Co., Ltd.
- Salcomp PLC
- Flex Ltd.
- Mean Well Enterprises Co., Ltd.
- Phihong Technology Co., Ltd.
- TDK-Lambda Corporation
- Chicony Power Technology Co., Ltd.
- FSP Group
- Guangzhou Shengyang Electronics Co., Ltd.
- Momax Technology (HK) Ltd.
- Alphatec, Inc. (Aukey)
- RAVPower (Shenzhen Sunvalley)
- Mophie LLC (ZAGG Inc.)
- Ugreen Group Ltd.
- PNY Technologies, Inc.
- Samsung Electronics Co., Ltd. (Power Adapter Division)
- Apple Inc. (Power Adapter Engineering Group)
- Xiaomi Inc. (Accessory Business Unit)
- Oppo Electronics Corp. (SuperVOOC Chargers)
Additional Benefits:
- The market estimate (ME) sheet in Excel format
- 3 months of analyst support
TABLE OF CONTENTS
1 INTRODUCTION
- 1.1 Study Assumptions and Market Definition
- 1.2 Scope of the Study
2 RESEARCH METHODOLOGY
3 EXECUTIVE SUMMARY
4 MARKET LANDSCAPE
- 4.1 Market Overview
- 4.2 Market Drivers
- 4.2.1 Growing adoption of USB-C Power Delivery (PD) standards
- 4.2.2 Proliferation of consumer electronics (smartphones, laptops, tablets)
- 4.2.3 Rapid electrification of automotive accessories and aftermarket EV adapters
- 4.2.4 Rising energy-efficiency regulations (DoE Level VI, EU CoC V5)
- 4.2.5 Integration of GaN and SiC semiconductors boosting watt-per-gram ratio
- 4.2.6 OEM interest in adapter modularity for circular-economy compliance
- 4.3 Market Restraints
- 4.3.1 Stringent global safety and EMI/EMC certification costs
- 4.3.2 Volatility in raw-material (copper, ferrite core) prices
- 4.3.3 Growing consumer shift toward wireless charging pads
- 4.3.4 OEM consolidation of adapters into device price
- 4.4 Industry Value Chain Analysis
- 4.5 Regulatory Landscape
- 4.6 Technological Outlook
- 4.7 Impact of Macroeconomic Factors on the Market
- 4.8 Porter's Five Forces Analysis
- 4.8.1 Bargaining Power of Suppliers
- 4.8.2 Bargaining Power of Buyers
- 4.8.3 Threat of New Entrants
- 4.8.4 Threat of Substitutes
- 4.8.5 Intensity of Competitive Rivalry
5 MARKET SIZE AND GROWTH FORECASTS (VALUE)
- 5.1 By End-user Industry
- 5.1.1 Consumer
- 5.1.1.1 Personal Computers
- 5.1.1.2 Laptops
- 5.1.1.3 Mobile Devices
- 5.1.1.4 Other Consumer
- 5.1.2 Automotive
- 5.1.2.1 EV Charging Adapters
- 5.1.2.2 In-vehicle Infotainment and Accessories
- 5.1.3 Industrial
- 5.1.1 Consumer
- 5.2 By Output Power Rating
- 5.2.1 <= 15 W
- 5.2.2 16-45 W
- 5.2.3 46-100 W
- 5.2.4 101-240 W
- 5.3 By Port Type
- 5.3.1 Single-Port
- 5.3.2 Multi-Port (2-4 Ports)
- 5.3.3 Ultra-Multi-Port (>= 5 Ports / GaN Docks)
- 5.4 By Form Factor
- 5.4.1 Wall Plug (Fixed-Pin)
- 5.4.2 Detachable Plug (Interchangeable)
- 5.4.3 Desktop (Brick)
- 5.4.4 Embedded / Board-Mount
- 5.5 By Geography
- 5.5.1 North America
- 5.5.1.1 United States
- 5.5.1.2 Canada
- 5.5.1.3 Mexico
- 5.5.2 South America
- 5.5.2.1 Brazil
- 5.5.2.2 Argentina
- 5.5.2.3 Rest of South America
- 5.5.3 Europe
- 5.5.3.1 Germany
- 5.5.3.2 United Kingdom
- 5.5.3.3 France
- 5.5.3.4 Russia
- 5.5.3.5 Rest of Europe
- 5.5.4 Asia-Pacific
- 5.5.4.1 China
- 5.5.4.2 Japan
- 5.5.4.3 India
- 5.5.4.4 South Korea
- 5.5.4.5 South-East Asia
- 5.5.4.6 Rest of Asia-Pacific
- 5.5.5 Middle East and Africa
- 5.5.5.1 Middle East
- 5.5.5.1.1 Saudi Arabia
- 5.5.5.1.2 United Arab Emirates
- 5.5.5.1.3 Rest of Middle East
- 5.5.5.2 Africa
- 5.5.5.2.1 South Africa
- 5.5.5.2.2 Egypt
- 5.5.5.2.3 Rest of Africa
- 5.5.5.1 Middle East
- 5.5.1 North America
6 COMPETITIVE LANDSCAPE
- 6.1 Market Concentration
- 6.2 Strategic Moves
- 6.3 Market Share Analysis
- 6.4 Company Profiles (includes Global level Overview, Market level overview, Core Segments, Financials as available, Strategic Information, Market Rank/Share for key companies, Products and Services, and Recent Developments)
- 6.4.1 Delta Electronics, Inc.
- 6.4.2 Lite-On Technology Corporation
- 6.4.3 Belkin International, Inc. (a Foxconn subsidiary)
- 6.4.4 Anker Innovations Technology Co., Ltd.
- 6.4.5 Shenzhen Huntkey Electric Co., Ltd.
- 6.4.6 Salcomp PLC
- 6.4.7 Flex Ltd.
- 6.4.8 Mean Well Enterprises Co., Ltd.
- 6.4.9 Phihong Technology Co., Ltd.
- 6.4.10 TDK-Lambda Corporation
- 6.4.11 Chicony Power Technology Co., Ltd.
- 6.4.12 FSP Group
- 6.4.13 Guangzhou Shengyang Electronics Co., Ltd.
- 6.4.14 Momax Technology (HK) Ltd.
- 6.4.15 Alphatec, Inc. (Aukey)
- 6.4.16 RAVPower (Shenzhen Sunvalley)
- 6.4.17 Mophie LLC (ZAGG Inc.)
- 6.4.18 Ugreen Group Ltd.
- 6.4.19 PNY Technologies, Inc.
- 6.4.20 Samsung Electronics Co., Ltd. (Power Adapter Division)
- 6.4.21 Apple Inc. (Power Adapter Engineering Group)
- 6.4.22 Xiaomi Inc. (Accessory Business Unit)
- 6.4.23 Oppo Electronics Corp. (SuperVOOC Chargers)
7 MARKET OPPORTUNITIES AND FUTURE OUTLOOK
- 7.1 White-space and Unmet-need Assessment
 雙向可程式設計直流測試電源市場(按功率等級、輸出電壓、應用、最終用戶、分銷管道和功能分類),全球預測,2026-2032年
 返馳式轉換器市場 - 2026-2031 年預測三相模組化不間斷電源 (UPS) 市場規模、佔有率、成長及全球產業分析:依類型、應用和地區劃分的洞察與預測 (2024-2032)
 2025-2029年全球ACDC電源市場
 實驗室級和桌上型直流電源市場報告:2031 年趨勢、預測和競爭分析
 2030 年桌上型電源市場預測:按類型、輸出類型、電流類型、應用、最終用戶和地區進行全球分析返馳式轉換器市場報告:2030 年趨勢、預測與競爭分析
 AC-DC 電源供應器:市場佔有率分析、產業趨勢/統計、成長預測 (2024-2029)