


 |
市場調查報告書
商品編碼
1940799
冷卻器:市場佔有率分析、產業趨勢與統計、成長預測(2026-2031)Chiller - Market Share Analysis, Industry Trends & Statistics, Growth Forecasts (2026 - 2031) |
||||||
※ 本網頁內容可能與最新版本有所差異。詳細情況請與我們聯繫。
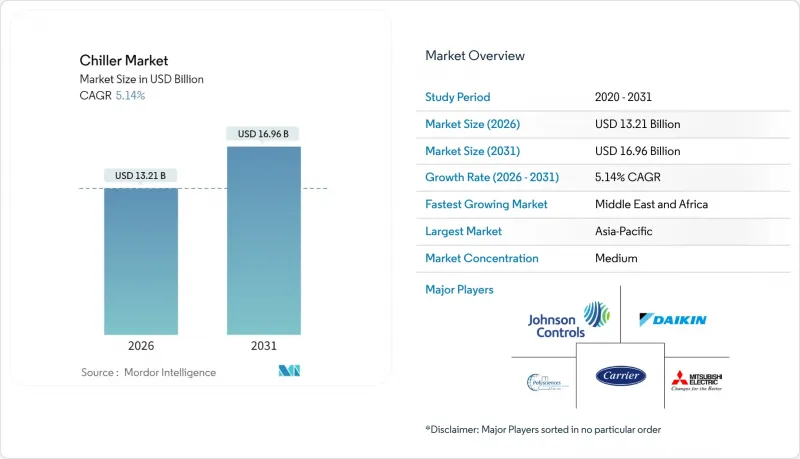
預計到 2026 年,冷卻器市場規模將達到 132.1 億美元,高於 2025 年的 125.6 億美元。
預計到 2031 年,該市場規模將達到 169.6 億美元,2026 年至 2031 年的複合年成長率為 5.14%。
由於資料中心營運商、食品加工商和製造商追求精確的溫度控制、能源效率和合規性,市場需求仍然強勁。快速的數位化,特別是每機架超過 100kW 的工作負載成長,正推動著溫度控管從傳統的風冷系統轉向液冷平台的轉變。同時,政策主導的HFC 淘汰加速了低全球暖化潛勢 (GWP) 技術的應用,而銅價波動和技能短缺則影響資本投資決策。亞太地區仍然是銷量成長的主要驅動力,而中東和非洲地區的成長速度最快,基礎設施項目和惡劣的氣候條件推高了製冷需求。技術差異化(變速壓縮機、人工智慧分析、節水設計)仍是供應商競爭力的核心,支撐著冷卻器市場的持續投資。
全球冷卻器市場趨勢與洞察
資料中心對精密冷卻的需求日益成長
新一代超大規模資料中心和託管機房正在部署功率超過 100kW 的機架,這使得傳統風冷系統的效能接近極限。微軟展示了完全無水冷卻方案,每年每個機房可節省 1.25 億公升水,顯示水資源管理與散熱效能同樣重要。製造商正積極回應,推出承包液冷式冷卻器、遠端監控系統和冗餘設計,以確保設定溫度偏差小於 1°C。加值服務合約包含預測性維護,從而確保人工智慧工作負載的運作,滿足其對每一毫秒運算資源的貨幣化需求。這些趨勢正在為冷卻設備市場一個利潤豐厚的成長領域奠定基礎。
商業建築中暖通空調冷卻器的應用日益廣泛
電氣化強制措施加速了業主用變速、低全球暖化潛值(GWP)冷卻器機組取代老舊瓦斯機組的進程。與ASHRAE 90.1基準值相比,後者可節能高達50%。美國法規要求到2026年,新的商業系統必須使用低GWP冷媒,這導致冷水機組的更換週期提前,並增加了對先進冷卻器的訂單。三菱電機在肯塔基州投資1.435億美元興建壓縮機工廠,顯示對當地持續需求的信心。建築物業主將高效能冷卻器視為應對能源成本波動的有效手段,儘管初始成本較高,但投資回收期更短。這些因素共同推動了冷卻器市場規模的擴大。
高初始資本支出
整合人工智慧分析和低全球暖化潛值(GWP)冷媒的先進冷卻器比傳統機型貴15-20%,導致對價格敏感的買家投資回收期延長。銅價飆升至每磅4.88美元以上,推高了熱交換器成本,擠壓了原始設備製造商(OEM)的利潤空間。新興市場進口商面臨貨幣貶值,進一步推高了到岸價格。因此,許多設施管理人員推遲了升級計劃,限制了冷卻器市場近期的成長。
細分市場分析
預計到2025年,水冷式冷水機組將佔據冷卻器市場55.80%的佔有率,憑藉水卓越的熱容量,能夠高效處理500冷噸以上的負載。對於擁有冷卻塔和儲水系統的資本密集設施而言,其目標是在長達數十年的使用壽命內最大限度地降低營運成本。然而,隨著維修計劃優先考慮安裝速度和基礎設施的精簡,空冷式冷水機組的年複合成長率(CAGR)仍維持在8.62%。
製造商透過微通道冷凝器和變速風扇縮小了性能差距,提高了部分負荷效率。中東和非洲缺水地區以及美國西南部部分地區已採用空氣冷卻來降低能耗並規避監管風險。超大規模資料中心供應商進行的零水冷卻試驗表明,市場策略正在轉變,長期需求將轉向空氣冷卻,從而重塑冷卻器市場格局。
由於螺桿壓縮機擁有寬廣的製冷量範圍和可靠的負載追蹤能力,預計到2025年將佔據冷卻器市場37.95%的佔有率,繼續保持其在化工、塑膠行業和中型商業設施中的主力地位。同時,離心式壓縮機憑藉其磁浮軸承和無油設計(可減少維護)以及一流的滿載效率,以7.28%的複合年成長率成長。
兩種配置均標配變頻驅動裝置,能耗降低高達 30%。渦旋式冷凍機在小規模商業建築中依然廣受歡迎,而往復式冷凍機則服務於一些精密應用領域。吸收式冷卻器在廢熱驅動冷卻效果顯著的領域中保持著相當大的市場佔有率。這使得供應商的產品線更加豐富,涵蓋了多種壓縮機技術,從而涵蓋了冷卻器市場的各個領域。
冷卻器市場依散熱方式(水冷式、氣冷式)、壓縮機型式(螺桿式、渦卷式、往復式等)、容量範圍(小於 50KW、50-350KW、350-700KW、700-1200KW、大於 1200KW)、冷媒類型(HFCKW等)、終端用戶產業(化學和石化、食品和飲料等)以及地區(北美、南美、歐洲、亞太、中東和非洲)進行細分。
區域分析
到2025年,亞太地區將佔據冷卻器市場42.05%的佔有率,這主要得益於中國電子組裝線的擴張、印度製藥業的蓬勃發展以及東南亞地區的契約製造。大金等區域供應商正在推動零件本地化採購,以縮短前置作業時間並降低成本。政府推行的「印度製造」等宣傳活動旨在使製造業佔GDP的比重達到25%,從而支撐未來多年的冷凍需求。
預計到2031年,中東和非洲地區將以9.05%的複合年成長率實現最快成長,這主要受嚴酷的氣候條件以及NEOM和盧賽爾等大型企劃(這些項目需要大規模的暖通空調和區域冷暖氣空調製冷系統)的推動。水資源短缺促使空氣冷卻技術廣泛應用,而油氣加工廠則引進了適用於沙漠環境的耐腐蝕冷卻器。 CVC和Tabreed等私募股權公司收購阿拉伯聯合大公國一家區域供冷企業的案例,也凸顯了該地區的高盈利。
北美和歐洲保持了其技術領先地位,重點關注資料中心、生物技術和性能再檢驗的機會。開利2025年第一季的銷售額激增表明,儘管銷售成長僅為個位數,但高價值應用仍蘊藏著巨大的成長潛力。歐洲的氟碳化合物監管藍圖加速了新型冷媒的引入,但宏觀經濟疲軟抑制了銷售成長。拉丁美洲迎來了新的成長機遇,對工業園區和冷庫的投資逐步提升了熱力基礎設施的專業化水平,並推動了全球冷卻器市場的擴張。
其他福利:
- Excel格式的市場預測(ME)表
- 3個月的分析師支持
目錄
第1章 引言
- 研究假設和市場定義
- 調查範圍
第2章調查方法
第3章執行摘要
第4章 市場情勢
- 市場概覽
- 市場促進因素
- 資料中心對精密冷卻的需求日益成長
- 商業建築中暖通空調冷卻器的應用日益廣泛
- 加工食品和飲料消費量增加
- 新興經濟體的快速工業化
- 引進低全球暖化潛勢冷媒冷卻器(CBAM效應)
- 人工智慧驅動的預測性維護可提高投資報酬率
- 市場限制
- 高初始資本支出
- 加強對氫氟碳化合物(HFCs)的環境監管
- 銅價波動推高了熱交換器成本。
- 熟練的冷卻器維修技術人員短缺
- 價值鏈分析
- 監管環境
- 技術展望
- 波特五力分析
- 供應商的議價能力
- 買方的議價能力
- 新進入者的威脅
- 替代品的威脅
- 競爭對手之間的競爭
- 宏觀經濟因素的影響
第5章 市場規模與成長預測
- 透過熱排氣法(冷卻型)
- 水冷
- 空冷式
- 按壓縮機類型
- 螺桿式冷卻器
- 渦卷式冷卻器
- 往復式冷卻器
- 離心式冷卻器
- 吸收式冷卻器
- 按容量範圍
- 小於50千瓦
- 50-350 kW
- 350~700 kW
- 700~1,200 kW
- 超過1200千瓦
- 依冷媒類型
- 氫氟碳化合物(HFCs)
- 氫氟烯烴(HFOs)
- 天然氣(二氧化碳、氨氣、丙烷)
- 氟烴塑膠(HCFCs - 已逐步淘汰)
- 水基/磁力軸承
- 按最終用戶行業分類
- 化學品和石油化工
- 食品/飲料
- 醫療和藥品
- 塑膠和橡膠
- 資料中心和IT
- 商業建築
- 其他
- 按地區
- 北美洲
- 美國
- 加拿大
- 墨西哥
- 南美洲
- 巴西
- 阿根廷
- 南美洲其他地區
- 歐洲
- 德國
- 英國
- 法國
- 義大利
- 西班牙
- 俄羅斯
- 其他歐洲地區
- 亞太地區
- 中國
- 日本
- 印度
- 韓國
- 東南亞
- 亞太其他地區
- 中東和非洲
- 中東
- 沙烏地阿拉伯
- 阿拉伯聯合大公國
- 土耳其
- 其他中東地區
- 非洲
- 南非
- 奈及利亞
- 埃及
- 其他非洲地區
- 中東
- 北美洲
第6章 競爭情勢
- 市場集中度
- 策略趨勢
- 市佔率分析
- 公司簡介
- Carrier Global Corporation
- Mitsubishi Electric Corporation
- Daikin Industries, Ltd.
- Trane Technologies plc
- Johnson Controls International plc
- LG Electronics Inc.
- GEA Group Aktiengesellschaft
- Danfoss A/S
- Climaveneta SpA
- Thermax Limited
- Smardt Chiller Group Inc.
- Dimplex Thermal Solutions
- Polyscience Inc.
- Shuangliang Eco-Energy Systems Co., Ltd.
- Hitachi, Ltd.
- Midea Group Co., Ltd.
- Haier Smart Home Co., Ltd.
- Baltimore Aircoil Company, Inc.
- ENGIE Refrigeration GmbH
- Bosch Thermotechnology Ltd.
- Dunham-Bush Holding Bhd.
- Hisense HVAC Equipment Co., Ltd.
- Arctic Chiller Group Ltd.
- KKT Kraus GmbH
- Frigel Firenze SpA
第7章 市場機會與未來展望
The chillers market size in 2026 is estimated at USD 13.21 billion, growing from 2025 value of USD 12.56 billion with 2031 projections showing USD 16.96 billion, growing at 5.14% CAGR over 2026-2031.
Demand has remained resilient as data-center operators, food processors, and manufacturers pursue precise temperature control, energy efficiency, and regulatory compliance. Rapid digitization, especially workloads exceeding 100 kW per rack, has moved thermal management beyond conventional air systems toward liquid-ready platforms. In parallel, policy-driven HFC phase-downs are accelerating low-GWP adoption, while volatile copper prices and technician shortages influence capital decisions. Asia-Pacific continued to anchor volume growth, but the Middle East and Africa delivered the fastest gains as infrastructure programs and extreme climates intensified cooling needs. Technology differentiation-variable-speed compressors, AI analytics, and water-saving designs-remains central to supplier competitiveness, underpinning sustained investment across the chillers market.
Global Chiller Market Trends and Insights
Rising demand for precision cooling in data centres
Next-generation hyperscale and colocation sites deployed racks that exceeded 100 kW, pushing legacy air systems to their thermal limits. Microsoft validated fully water-free cooling concepts that conserve 125 million liters per facility annually, highlighting water stewardship alongside thermal performance. Manufacturers responded with turnkey liquid-ready chillers, remote monitoring packages, and redundant designs that guarantee sub-1 °C set-point deviation. Premium service contracts now bundle predictive maintenance, ensuring uptime for AI workloads that monetize every millisecond of compute. These dynamics underpin a high-margin growth pocket within the chillers market.
Growing adoption of HVAC chillers in commercial buildings
Electrification mandates drove owners to swap aging gas units for variable-speed, low-GWP chillers that cut energy use up to 50% versus ASHRAE 90.1 baselines. U.S. regulations requiring low-GWP refrigerants in new commercial systems by 2026 triggered an early replacement cycle, lifting order books for advanced chillers. Mitsubishi Electric committed USD 143.5 million to a Kentucky compressor plant, signalling confidence in sustained regional demand. Building owners viewed higher-efficiency chillers as a hedge against volatile utility prices, accelerating payback even as upfront costs rose. These factors collectively widen the addressable chiller market.
High initial capital expenditure
Advanced chillers that integrate AI analytics and low-GWP refrigerants cost 15-20% more than legacy units, prolonging payback for price-sensitive buyers. Recent spikes in copper above USD 4.88 per lb raised heat-exchanger costs and pressured OEM margins. Emerging-market importers faced currency devaluation, further inflating landed prices. Consequently, many facility managers deferred replacements, tempering short-term expansion in the chillers market.
Other drivers and restraints analyzed in the detailed report include:
- Increasing consumption of processed food and beverages
- Rapid industrialization in emerging economies
- Stricter environmental regulations on HFCs
For complete list of drivers and restraints, kindly check the Table Of Contents.
Segment Analysis
Water-cooled units controlled 55.80% of the chillers market share in 2025, leveraging water's superior heat capacity to serve loads above 500 tons efficiently. Capital-intensive facilities with existing cooling towers and retained water systems to minimize operating costs over multi-decade lifecycles. Nevertheless, air-cooled systems advanced at 8.62% CAGR as retrofit projects prioritized installation speed and reduced infrastructure.
Manufacturers narrowed historical performance gaps through micro-channel condensers and variable-speed fans that improve part-load efficiency. Water-scarce regions, Middle East, Africa, parts of the U.S. Southwest, favored air-cooled adoption to cut consumption and regulatory risk. Hyperscale providers piloted zero-water cooling, underscoring a strategic pivot that could redirect long-term demand toward air variants, reshaping the chillers market.
Screw compressors captured 37.95% of the chillers market in 2025 thanks to broad capacity coverage and load-following reliability. They remained the workhorse for chemical, plastics, and medium-sized commercial installations. Centrifugal models, however, expanded at 7.28% CAGR as magnetic bearings and oil-free designs cut maintenance and delivered best-in-class full-load efficiency.
Variable-speed drives became standard across both architectures, slicing energy bills up to 30%. Scroll units retained traction in small commercial buildings, while reciprocating machines addressed niche precision applications. Absorption chillers held a modest share where waste-heat sources justified thermally driven cooling. Supplier portfolios thus spanned multiple compressor technologies to service the full spectrum of the chillers market.
Chillers Market is Segmented by Heat Rejection Method (Water-Cooled, and Air-Cooled), Compressor Type (Screw, Scroll, Reciprocating, and More), Capacity Range (<50 KW, 50-350 KW, 350-700 KW, 700-1200 KW, and >1200 KW), Refrigerant Type (HFC, HFO, and More), End-User Industry (Chemicals and Petrochemicals, Food and Beverage, and More), and Geography (North America, South America, Europe, Asia-Pacific, and Middle East and Africa).
Geography Analysis
Asia-Pacific held 42.05% of the chillers market in 2025, driven by China's electronics assembly lines, India's expanding pharma hubs, and Southeast Asian contract manufacturing. Regional suppliers such as Daikin are localizing component sourcing, shortening lead times, and cutting costs. Government campaigns like "Make in India" targeted a 25% manufacturing GDP share, anchoring multi-year cooling demand.
Middle East and Africa posted the quickest 9.05% CAGR through 2031 as extreme climates and mega-projects, NEOM, Lusail, required large-scale HVAC and district systems. Water scarcity spurred air-cooled adoption, while oil-and-gas processing plants ordered corrosion-resistant chillers for desert duty. Private-equity deals, like CVC and Tabreed's UAE district cooling acquisition, underscored the region's attractive returns.
North America and Europe remained technology leaders, focusing on data-center, biotech, and retro-commissioning opportunities. Carrier's Q1 2025 sales jump illustrated upside tied to high-value applications despite low single-digit unit growth. Europe's F-gas roadmap accelerated novel refrigerant uptake, though macroeconomic softness tempered volume expansion. Latin America offered emerging upside where industrial parks and cold-storage investments slowly professionalized thermal infrastructure, extending the global reach of the chillers market.
- Carrier Global Corporation
- Mitsubishi Electric Corporation
- Daikin Industries, Ltd.
- Trane Technologies plc
- Johnson Controls International plc
- LG Electronics Inc.
- GEA Group Aktiengesellschaft
- Danfoss A/S
- Climaveneta S.p.A.
- Thermax Limited
- Smardt Chiller Group Inc.
- Dimplex Thermal Solutions
- Polyscience Inc.
- Shuangliang Eco-Energy Systems Co., Ltd.
- Hitachi, Ltd.
- Midea Group Co., Ltd.
- Haier Smart Home Co., Ltd.
- Baltimore Aircoil Company, Inc.
- ENGIE Refrigeration GmbH
- Bosch Thermotechnology Ltd.
- Dunham-Bush Holding Bhd.
- Hisense HVAC Equipment Co., Ltd.
- Arctic Chiller Group Ltd.
- KKT Kraus GmbH
- Frigel Firenze S.p.A.
Additional Benefits:
- The market estimate (ME) sheet in Excel format
- 3 months of analyst support
TABLE OF CONTENTS
1 INTRODUCTION
- 1.1 Study Assumptions and Market Definition
- 1.2 Scope of the Study
2 RESEARCH METHODOLOGY
3 EXECUTIVE SUMMARY
4 MARKET LANDSCAPE
- 4.1 Market Overview
- 4.2 Market Drivers
- 4.2.1 Rising demand for precision cooling in data centres
- 4.2.2 Growing adoption of HVAC chillers in commercial buildings
- 4.2.3 Increasing consumption of processed food and beverages
- 4.2.4 Rapid industrialisation in emerging economies
- 4.2.5 Uptake of low-GWP refrigerant chillers (CBAM effect)
- 4.2.6 AI-based predictive maintenance improves ROI
- 4.3 Market Restraints
- 4.3.1 High initial capital expenditure
- 4.3.2 Stricter environmental regulation on HFCs
- 4.3.3 Volatile copper prices raising heat-exchanger costs
- 4.3.4 Shortage of skilled chiller service technicians
- 4.4 Value Chain Analysis
- 4.5 Regulatory Landscape
- 4.6 Technological Outlook
- 4.7 Porter's Five Forces Analysis
- 4.7.1 Bargaining Power of Suppliers
- 4.7.2 Bargaining Power of Buyers
- 4.7.3 Threat of New Entrants
- 4.7.4 Threat of Substitutes
- 4.7.5 Intensity of Competitive Rivalry
- 4.8 Impact of Macroeconomic Factors
5 MARKET SIZE AND GROWTH FORECASTS (VALUE)
- 5.1 By Heat Rejection Method (Type of Cooling)
- 5.1.1 Water-Cooled
- 5.1.2 Air-Cooled
- 5.2 By Compressor Type
- 5.2.1 Screw Chillers
- 5.2.2 Scroll Chillers
- 5.2.3 Reciprocating Chillers
- 5.2.4 Centrifugal Chillers
- 5.2.5 Absorption Chillers
- 5.3 By Capacity Range
- 5.3.1 < 50 kW
- 5.3.2 50 - 350 kW
- 5.3.3 350 - 700 kW
- 5.3.4 700 - 1 200 kW
- 5.3.5 > 1 200 kW
- 5.4 By Refrigerant Type
- 5.4.1 Hydrofluorocarbon (HFC)
- 5.4.2 Hydrofluoro-olefin (HFO)
- 5.4.3 Natural (CO2, NH3, Propane)
- 5.4.4 Hydrochlorofluorocarbon (HCFC - phase-out)
- 5.4.5 Water-based / Magnetic-bearing
- 5.5 By End-User Industry
- 5.5.1 Chemicals and Petrochemicals
- 5.5.2 Food and Beverage
- 5.5.3 Medical and Pharmaceutical
- 5.5.4 Plastics and Rubber
- 5.5.5 Data Centres and IT
- 5.5.6 Commercial Buildings
- 5.5.7 Others
- 5.6 By Geography
- 5.6.1 North America
- 5.6.1.1 United States
- 5.6.1.2 Canada
- 5.6.1.3 Mexico
- 5.6.2 South America
- 5.6.2.1 Brazil
- 5.6.2.2 Argentina
- 5.6.2.3 Rest of South America
- 5.6.3 Europe
- 5.6.3.1 Germany
- 5.6.3.2 United Kingdom
- 5.6.3.3 France
- 5.6.3.4 Italy
- 5.6.3.5 Spain
- 5.6.3.6 Russia
- 5.6.3.7 Rest of Europe
- 5.6.4 Asia-Pacific
- 5.6.4.1 China
- 5.6.4.2 Japan
- 5.6.4.3 India
- 5.6.4.4 South Korea
- 5.6.4.5 Southeast Asia
- 5.6.4.6 Rest of Asia-Pacific
- 5.6.5 Middle East and Africa
- 5.6.5.1 Middle East
- 5.6.5.1.1 Saudi Arabia
- 5.6.5.1.2 United Arab Emirates
- 5.6.5.1.3 Turkey
- 5.6.5.1.4 Rest of Middle East
- 5.6.5.2 Africa
- 5.6.5.2.1 South Africa
- 5.6.5.2.2 Nigeria
- 5.6.5.2.3 Egypt
- 5.6.5.2.4 Rest of Africa
- 5.6.5.1 Middle East
- 5.6.1 North America
6 COMPETITIVE LANDSCAPE
- 6.1 Market Concentration
- 6.2 Strategic Moves
- 6.3 Market Share Analysis
- 6.4 Company Profiles (includes Global Level Overview, Market Level Overview, Core Segments, Financials as available, Strategic Information, Market Rank/Share, Products and Services, Recent Developments)
- 6.4.1 Carrier Global Corporation
- 6.4.2 Mitsubishi Electric Corporation
- 6.4.3 Daikin Industries, Ltd.
- 6.4.4 Trane Technologies plc
- 6.4.5 Johnson Controls International plc
- 6.4.6 LG Electronics Inc.
- 6.4.7 GEA Group Aktiengesellschaft
- 6.4.8 Danfoss A/S
- 6.4.9 Climaveneta S.p.A.
- 6.4.10 Thermax Limited
- 6.4.11 Smardt Chiller Group Inc.
- 6.4.12 Dimplex Thermal Solutions
- 6.4.13 Polyscience Inc.
- 6.4.14 Shuangliang Eco-Energy Systems Co., Ltd.
- 6.4.15 Hitachi, Ltd.
- 6.4.16 Midea Group Co., Ltd.
- 6.4.17 Haier Smart Home Co., Ltd.
- 6.4.18 Baltimore Aircoil Company, Inc.
- 6.4.19 ENGIE Refrigeration GmbH
- 6.4.20 Bosch Thermotechnology Ltd.
- 6.4.21 Dunham-Bush Holding Bhd.
- 6.4.22 Hisense HVAC Equipment Co., Ltd.
- 6.4.23 Arctic Chiller Group Ltd.
- 6.4.24 KKT Kraus GmbH
- 6.4.25 Frigel Firenze S.p.A.
7 MARKET OPPORTUNITIES AND FUTURE OUTLOOK
- 7.1 White-space and Unmet-Need Assessment
 先進微加工系統市場預測至2034年-按製程類型、設備類型、材料、應用、最終用戶和地區分類的全球分析
 先進半導體冷卻系統市場:按類型、產品類型、服務、技術、應用、國家和地區分類-全球產業分析、市場規模、市場佔有率及2026年至2033年預測半導體冷卻技術市場預測至2034年-全球分析(按冷卻方式、組件、冷卻介質、封裝等級、技術、部署模式、應用、最終用戶和地區分類)
 半導體冷卻器市場:按類型、應用和地區分類(2026-2034 年)
 冷卻器市場:依功能、壓縮機技術、功率範圍、應用及最終用途分類-2026-2032年全球市場預測鹽水冷卻器市場:按類型、冷卻能力、應用、循環方式、終端用戶產業和分銷管道分類-2026-2032年全球市場預測桌上型液體冷卻器市場:按類型、冷卻能力、流體類型、應用、最終用戶和分銷管道分類 - 全球預測,2026-2032 年
 半導體溫度控制冷卻器:全球市場佔有率和排名、總收入和需求預測(2026-2032 年)
 先進半導體冷卻系統市場分析及預測(至2035年):依類型、產品類型、服務、技術、組件、應用、材質、裝置、最終用戶及功能分類
 2026-2034年全球冷卻器市場規模、佔有率、趨勢和成長分析報告