


 |
市場調查報告書
商品編碼
1940796
美國設施管理:市場佔有率分析、行業趨勢和統計數據、成長預測(2026-2031 年)United States Facility Management - Market Share Analysis, Industry Trends & Statistics, Growth Forecasts (2026 - 2031) |
||||||
※ 本網頁內容可能與最新版本有所差異。詳細情況請與我們聯繫。
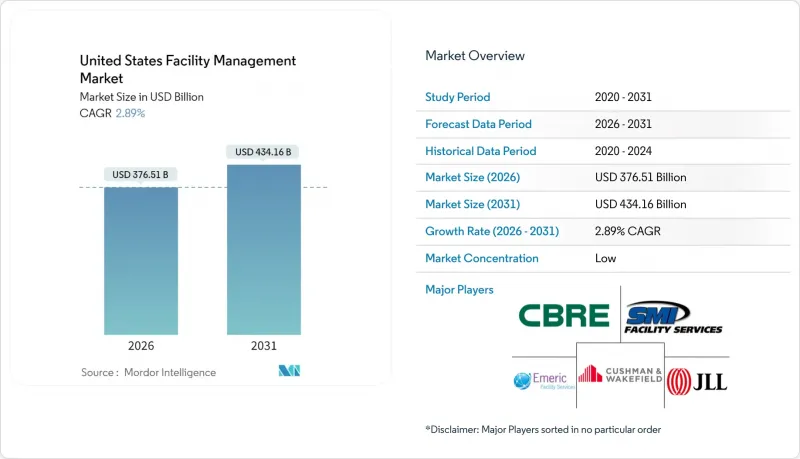
2025年美國設施管理市場價值為3,659.3億美元,預計到2031年將達到4,341.6億美元,而2026年為3,765.1億美元。
預計在預測期(2026-2031 年)內,複合年成長率將達到 2.89%。
辦公物業的商業房地產空置率高達14.1%,而工業地產則呈現強勁的吸納勢頭,導致服務需求分化。硬性服務需求主導,因為企業無法推遲暖通空調、消防和基礎設施維護;同時,隨著後疫情時代職場對安全和健康通訊協定的要求不斷提高,軟性服務的需求也在成長。監管同樣至關重要,《通膨控制法案》撥款9.75億美元用於聯邦建築維修,加速了節能維修的需求。從物聯網感測器到基於人工智慧的預測性維護,技術整合正在透過減少停機時間和最佳化公用設施來改變營運模式。
美國設施管理市場趨勢與洞察
主要都會區的都市化和人口成長
奧斯汀和鳳凰城等陽光地帶的中心城市持續吸引企業和居住者,推動了對採用智慧建築平台的新建和維修項目的需求。這些市場的設施管理人員必須在多元化的資產組合中平衡先進的自動化技術和傳統的基礎設施。知識經濟時代的租戶優先考慮彈性辦公空間,迫使服務供應商提供即時入住率分析。在一系列極端天氣事件之後,氣候適應能力變得至關重要,這也增加了對緊急維護計畫的要求。這些因素共同作用,提高了服務的複雜性和成本。
美國基礎設施法案中產業投資的優先事項
聯邦政府已撥款9.75億美元用於維修4000萬平方英尺的公共建築,這引發了各州層級類似標準的連鎖反應。 「美國製造」和「現行工資」條款推高了人事費用,迫使設施管理人員改善籌資策略和勞動力策略。電網現代化支出增加了維護電動車充電樁和整合能源儲存系統系統的責任。由於業主尋求獲得補貼合格的保證,合規性追蹤已成為設施管理合約中的關鍵要素。由此可見,公共支出正在影響私人服務的模式。
主要設施管理業者的盈利指標
2024年,營運支出成長超過收入成長,導致利潤率收窄,並限制了技術投資。 ABM Industries的收入增加了3.3%,但工資和公用事業成本的上漲侵蝕了利潤率。分散的競爭環境限制了其定價權,尤其是在高成本的網路安全和合規服務領域。電費佔公用事業成本的比例上升至58.9%,迫使企業將成本轉嫁給消費者或降低服務品質。這種壓力迫使小規模的營運商進行整合或專注於特定領域。
細分市場分析
到2025年,硬性服務將占美國設施管理市場58.45%的佔有率,因為客戶將非自主性資產維護放在首位。預測性維護工具和物聯網感測器正在將傳統的機電工程營運轉變為數據驅動的例行程序,從而減少非計劃性停機時間。日益嚴格的消防和節能標準在成本壓力下支撐了市場需求。法規主導的設備更新預計將繼續推動美國設施管理市場硬性服務規模的溫和成長。軟性服務將以3.74%的複合年成長率成長,如今,人工智慧監控系統、感染控制清潔和適應混合辦公模式的靈活餐飲模式已成為其重要組成部分。
軟性服務供應商正透過提供符合環境、社會和治理(ESG)標準的清潔化學品以及即時入住率數據來最佳化人員配置,從而實現差異化競爭。安保合約也擴大納入對門禁控制設備的網實整合監控。隨著企業在後疫情時代持續改善員工體驗,職場支援服務的重要性日益凸顯。然而,勞動力短缺導致的薪資上漲正給盈利帶來壓力。在此背景下,美國設施管理市場正圍繞著整合硬資產健康狀況與居住者健康指標的平台,建構一個全新的生態系統。
其他福利:
- Excel格式的市場預測(ME)表
- 3個月的分析師支持
目錄
第1章 引言
- 研究假設和市場定義
- 調查範圍
第2章調查方法
第3章執行摘要
第4章 市場情勢
- 市場概覽
- 目前運轉率
- 主要FM業者的盈利能力
- 勞動指標 - 勞動參與率
- 按服務類型分類的設施管理市場佔有率(%)
- 以硬性服務分類的設施管理市場佔有率(%)
- 軟服務設施管理市場佔有率(%)
- 主要都會區的都市化和人口成長
- 美國基礎設施法案中產業投資的優先事項
- 與勞動和安全標準相關的監管促進因素
- 促進要素
- 主要都會區的都市化和人口成長
- 美國基礎設施法案中產業投資的優先事項
- 與勞動和安全標準相關的監管促進因素
- 技術主導整合設施管理(物聯網、建築管理系統、基於人工智慧的預測性維護)
- 強制性建築性能標準推動性能驗證服務
- 《通貨膨脹控制法案》下的稅收優惠將加速脫碳維修的需求。
- 抑制因素
- 主要FM業者的盈利能力
- 勞動指標 - 勞動參與率
- 城市中心商業不動產空置率上升
- 互聯建築系統網路安全責任風險增加
- 價值鏈分析
- PESTEL 分析
- 新參與企業的監管和立法框架
- 宏觀經濟指標對FM需求的影響
- 波特五力分析
- 供應商的議價能力
- 買方的議價能力
- 新進入者的威脅
- 替代品的威脅
- 競爭對手之間的競爭
- 投資與資金籌措分析
第5章 市場規模與成長預測
- 按服務類型
- 硬服務
- 資產管理
- 機電及暖通空調服務
- 消防設備和安全措施
- 其他硬體維修服務
- 軟服務
- 辦公室支援與安全
- 清潔服務
- 餐飲服務
- 其他軟性調頻服務
- 硬服務
- 以規定形式
- 內部管理
- 外包
- 單頻調頻
- 綜合調頻
- 整合調頻
- 按最終用戶行業分類
- 商業設施(IT/通訊、零售/倉儲等)
- 餐飲服務業(飯店、餐廳、大型餐廳)
- 公共及公共基礎設施(政府機構、教育機構、交通運輸)
- 醫療保健(公立和私立機構)
- 工業和流程(製造業、能源業、採礦業)
- 其他終端用戶產業(多用戶住宅、娛樂、運動和休閒)
第6章 競爭情勢
- 市場集中度
- 策略發展與夥伴關係
- 市佔率分析
- 公司簡介
- ABM Industries
- Emcor Group Inc.
- CBRE Group Inc.
- Jones Lang LaSalle IP, Inc.
- Cushman & Wakefield PLC
- Sodexo Inc.
- ISS Facility Services Inc.
- GDI Integrated Facility Services
- Kellermeyer Bergensons Services
- Guardian Service Industries Inc.
- AHI Facility Services Inc.
- Emeric Facility Services
- SMI Facility Services
- Shine Management and Facility Services
- Haworth Inc.
- Servicon Systems Inc.
- UG2 Facility Services
- Alpine Building Maintenance
- Aramark
- Broadway Building Services
第7章 市場機會與未來展望
The United States facility management market was valued at USD 365.93 billion in 2025 and estimated to grow from USD 376.51 billion in 2026 to reach USD 434.16 billion by 2031, at a CAGR of 2.89% during the forecast period (2026-2031).
Commercial real-estate vacancy at 14.1% in office assets contrasts with robust industrial absorption, shaping divergent demand for services. Hard services hold sway because organizations cannot postpone HVAC, fire-safety or infrastructure upkeep, yet soft services gain ground as post-pandemic workplaces demand heightened security and wellness protocols. Regulation is equally decisive; the Inflation Reduction Act allocates USD 975 million to federal building upgrades, accelerating demand for energy-efficient retrofits. Technology integration-from IoT sensors to AI-based predictive maintenance-reshapes operating models by cutting downtime and optimizing utilities.
United States Facility Management Market Trends and Insights
Urbanization and Population Growth in Major Metros
Sun Belt hubs such as Austin and Phoenix continue to attract businesses and residents, increasing demand for both new facilities and retrofits that incorporate smart-building platforms. Facility managers in these markets must juggle advanced automation with legacy infrastructure across mixed portfolios. Knowledge-economy tenants emphasize flexible spaces, pushing service providers to offer real-time occupancy analytics. Climate resilience has become integral after successive extreme-weather events, intensifying requirements for emergency maintenance planning. These combined pressures elevate service complexity and costs.
Sector Investment Priorities in United States Infrastructure Bills
Federal outlays direct USD 975 million to upgrade 40 million sq ft of public buildings, anchoring a spill-over of similar standards at state level. Buy-American and prevailing-wage clauses inflate labor costs, compelling facility managers to refine procurement and workforce strategies. Grid-modernization spending adds responsibilities for EV-charger upkeep and energy-storage integration. Compliance tracking now factors prominently into FM contracts as owners seek assurance of bill eligibility. Thus, public spending shapes private service design.
Profitability Rates of Major FM Players
Operating expenses exceeded revenue growth in 2024, shrinking margins and constraining tech investment. ABM Industries posted 3.3% revenue expansion but faced wage and utility inflation that eroded gains. Fragmented competition limits pricing power, especially for costly cyber-security and regulatory services. Elevated electricity now equals 58.9% of utility spend, forcing either pass-through pricing or service downgrades. The squeeze pushes small providers toward consolidation or niche specialization.
Other drivers and restraints analyzed in the detailed report include:
- Regulatory Drivers Specific to Labour and Safety Standards
- Technology-Led Integrated FM (IoT, BMS, AI-Based Predictive Maintenance)
- Workforce Indicators - Labor Participation
For complete list of drivers and restraints, kindly check the Table Of Contents.
Segment Analysis
Hard services controlled 58.45% of the United States facility management market in 2025 as clients prioritized non-discretionary asset upkeep. Predictive maintenance tools and IoT sensors are turning legacy MEP tasks into data-driven routines that curb unplanned downtime. Compliance with ever-tighter fire-safety and energy codes bolsters demand even amid cost pressures. The United States facility management market size for hard services will continue to edge upward given regulation-driven upgrades. Soft services, expanding at a 3.74% CAGR, now bundle AI-enabled surveillance, infection-control cleaning, and flexible catering models aligning with hybrid work.
Soft-service providers differentiate through ESG-aligned cleaning chemicals and real-time occupancy data that right-size staffing. Security contracts increasingly incorporate cyber-physical monitoring of access-control devices. As post-pandemic employee-experience initiatives endure, workplace support offerings gain relevance. However, labour shortages inflate wages, challenging profitability. The ecosystem thus evolves around integrated platforms that merge hard-asset health with occupant wellness metrics across the broader United States facility management market.
The United States Facility Management Market Report is Segmented by Service Type (Hard Services, Soft Services), Offering Type (In-House, Outsourced), End-User Industry (Commercial, Hospitality, Institutional and Public Infrastructure, Healthcare, Industrial and Process, and More), and Geography (Northeast, Southeast, Midwest, Southwest, West). The Market Forecasts are Provided in Terms of Value (USD).
List of Companies Covered in this Report:
- ABM Industries
- Emcor Group Inc.
- CBRE Group Inc.
- Jones Lang LaSalle IP, Inc.
- Cushman & Wakefield PLC
- Sodexo Inc.
- ISS Facility Services Inc.
- GDI Integrated Facility Services
- Kellermeyer Bergensons Services
- Guardian Service Industries Inc.
- AHI Facility Services Inc.
- Emeric Facility Services
- SMI Facility Services
- Shine Management and Facility Services
- Haworth Inc.
- Servicon Systems Inc.
- UG2 Facility Services
- Alpine Building Maintenance
- Aramark
- Broadway Building Services
Additional Benefits:
- The market estimate (ME) sheet in Excel format
- 3 months of analyst support
TABLE OF CONTENTS
1 INTRODUCTION
- 1.1 Study Assumptions and Market Definition
- 1.2 Scope of the Study
2 RESEARCH METHODOLOGY
3 EXECUTIVE SUMMARY
4 MARKET LANDSCAPE
- 4.1 Market Overview
- 4.1.1 Current Occupancy Rates
- 4.1.2 Profitability Rates of Major FM Players
- 4.1.3 Workforce Indicators - Labor Participation
- 4.1.4 Facility Management Market Share (%) - by Service Type
- 4.1.5 Facility Management Market Share (%) - by Hard Services
- 4.1.6 Facility Management Market Share (%) - by Soft Services
- 4.1.7 Urbanization and Population Growth in Major Metros
- 4.1.8 Sector Investment Priorities in US Infrastructure Bills
- 4.1.9 Regulatory Drivers Specific to Labour and Safety Standards
- 4.2 Drivers
- 4.2.1 Urbanization and Population Growth in Major Metros
- 4.2.2 Sector Investment Priorities in US Infrastructure Bills
- 4.2.3 Regulatory Drivers Specific to Labour and Safety Standards
- 4.2.4 Technology-Led Integrated FM (IoT, BMS, AI-Based Predictive Maintenance)
- 4.2.5 Building Performance Standards Mandates Driving Retro-Commissioning Services
- 4.2.6 Inflation Reduction Act Tax Incentives Accelerating Decarbonization Retrofit Demand
- 4.3 Restraints
- 4.3.1 Profitability Rates of Major FM Players
- 4.3.2 Workforce Indicators - Labor Participation
- 4.3.3 Rising Commercial Real Estate Vacancies in Urban Cores
- 4.3.4 Increasing Cybersecurity Liability Exposure in Connected Building Systems
- 4.4 Value Chain Analysis
- 4.5 PESTEL Analysis
- 4.6 Regulatory and Legislative Framework for Market Entrants
- 4.7 Impact of Macroeconomic Indicators on FM Demand
- 4.8 Porter's Five Forces Analysis
- 4.8.1 Bargaining Power of Suppliers
- 4.8.2 Bargaining Power of Buyers
- 4.8.3 Threat of New Entrants
- 4.8.4 Threat of Substitute Services
- 4.8.5 Intensity of Competitive Rivalry
- 4.9 Investment and Funding Analysis
5 MARKET SIZE AND GROWTH FORECASTS (VALUE)
- 5.1 By Service Type
- 5.1.1 Hard Services
- 5.1.1.1 Asset Management
- 5.1.1.2 MEP and HVAC Services
- 5.1.1.3 Fire Systems and Safety
- 5.1.1.4 Other Hard FM Services
- 5.1.2 Soft Services
- 5.1.2.1 Office Support and Security
- 5.1.2.2 Cleaning Services
- 5.1.2.3 Catering Services
- 5.1.2.4 Other Soft FM Services
- 5.1.1 Hard Services
- 5.2 By Offering Type
- 5.2.1 In-house
- 5.2.2 Outsourced
- 5.2.2.1 Single FM
- 5.2.2.2 Bundled FM
- 5.2.2.3 Integrated FM
- 5.3 By End-user Industry
- 5.3.1 Commercial (IT and Telecom, Retail and Warehouses, etc.)
- 5.3.2 Hospitality (Hotels, Eateries, Large-scale Restaurants)
- 5.3.3 Institutional and Public Infrastructure (Govt, Education, Transportation)
- 5.3.4 Healthcare (Public and Private Facilities)
- 5.3.5 Industrial and Process (Manufacturing, Energy, Mining)
- 5.3.6 Other End-user Industries (Multi-housing, Entertainment, Sports and Leisure)
6 COMPETITIVE LANDSCAPE
- 6.1 Market Concentration
- 6.2 Strategic Moves and Partnerships
- 6.3 Market Share Analysis
- 6.4 Company Profiles (Includes Global level Overview, Market level overview, Core Segments, Financials as available, Strategic Information, Market Rank/Share for key companies, Products and Services, and Recent Developments)
- 6.4.1 ABM Industries
- 6.4.2 Emcor Group Inc.
- 6.4.3 CBRE Group Inc.
- 6.4.4 Jones Lang LaSalle IP, Inc.
- 6.4.5 Cushman & Wakefield PLC
- 6.4.6 Sodexo Inc.
- 6.4.7 ISS Facility Services Inc.
- 6.4.8 GDI Integrated Facility Services
- 6.4.9 Kellermeyer Bergensons Services
- 6.4.10 Guardian Service Industries Inc.
- 6.4.11 AHI Facility Services Inc.
- 6.4.12 Emeric Facility Services
- 6.4.13 SMI Facility Services
- 6.4.14 Shine Management and Facility Services
- 6.4.15 Haworth Inc.
- 6.4.16 Servicon Systems Inc.
- 6.4.17 UG2 Facility Services
- 6.4.18 Alpine Building Maintenance
- 6.4.19 Aramark
- 6.4.20 Broadway Building Services
7 MARKET OPPORTUNITIES AND FUTURE OUTLOOK
- 7.1 White-space and Unmet-Need Assessment
- 7.2 Technology-led Integrated FM (IoT, BMS, AI-based Predictive Maintenance)
- 7.3 ESG-compliant FM Solutions Demand
- 7.4 Future Service-Model Shifts (Outcome-based Contracts)
 設施管理服務市場:2026-2032年全球市場預測(依服務類型、合約類型、服務交付方式、最終用戶和組織規模分類)
 2026年全球地下設施維護與管理市場報告2026年全球硬性服務設施管理市場報告2026年全球設施支援服務市場報告2026年全球設施管理服務市場報告2026年全球軟性服務設施管理市場報告
 設施管理市場規模、佔有率、成長及全球產業分析:按類型、應用和地區分類的洞察,2026-2034 年預測硬設施管理市場:依服務類型、合約類型、所有權類型和最終用戶產業分類-2026-2032年全球市場預測2026年全球電腦輔助設施管理(CAFM)市場報告2026年全球整合性機構管理市場報告