


 |
市場調查報告書
商品編碼
1940790
二次包裝:市場佔有率分析、產業趨勢與統計、成長預測(2026-2031)Secondary Packaging - Market Share Analysis, Industry Trends & Statistics, Growth Forecasts (2026 - 2031) |
||||||
※ 本網頁內容可能與最新版本有所差異。詳細情況請與我們聯繫。
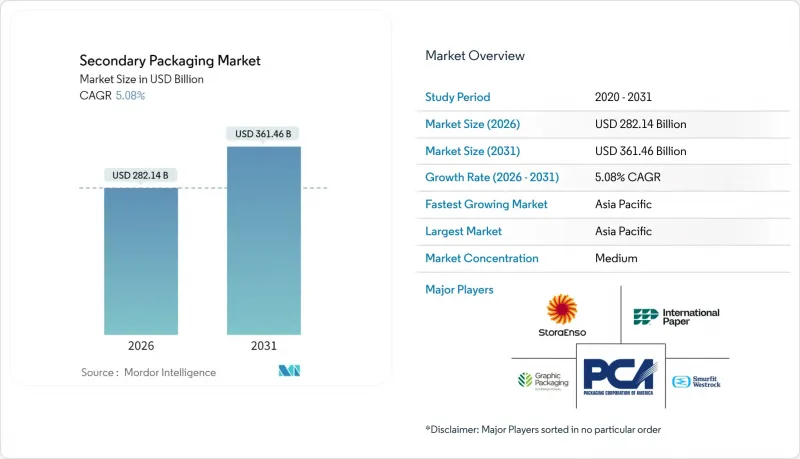
2025年,二級包裝市場價值為2,685億美元,預計到2031年將達到3,614.6億美元,高於2026年的2,821.4億美元。
預計在預測期(2026-2031 年)內,複合年成長率將達到 5.08%。
電子商務交易量的成長、零售商的零浪費政策以及品牌商對易於上架包裝的需求,共同支撐著瓦楞紙解決方案的穩定需求。目前,瓦楞紙包裝已佔線上零售小包裹總量的80%。自動化設計的應用日益普及,84%的消費品製造商已在其二級生產線上部署機器人,預計2027年將達到93%。 2022年價值263億美元的數位印刷市場預計到2032年將超過515億美元,透過按需客製化,有助於控制SKU的激增。亞太地區佔據二級包裝市場41%的佔有率,這主要得益於中國包裝器材供應商的全球市場佔有率在五年內從20%成長到35%。全球領先的紙業和紙板企業之間的整合仍在繼續,但由於歐洲產能過剩以及2023年消費量下降15.3%,利潤率面臨壓力,限制了其定價能力。
全球二級包裝市場趨勢與洞察
電子商務的快速成長推動了對瓦楞紙包裝的需求。
瓦楞紙箱已佔線上配送小包裹的80%,預計到2024年將有27.1億消費者進行線上購物,因此,紙箱正成為品牌宣傳的重要管道。產品適配技術可減少填充材物和材料用量,同時降低承運商的體積重量費用。預計到2034年,全球瓦楞紙包裝市場規模將超過8,000億美元,加工商正在其產品組合中添加隔熱內襯和防篡改封條,以應對生鮮產品和安全方面的挑戰。數位印刷機可即時個人化,使品牌能夠在紙箱內側印製促銷訊息,進而提升客戶參與。與自動化相容的模切製程支援機器人組裝和包裝,可提高大批量加工點的生產效率。紙纖維的永續性正獲得零售商的支持,他們承諾在二次包裝市場中淘汰難以回收的塑膠。
向自動化包裝過渡
勞動力短缺和生產線效率提升目標正推動對機器人揀選、裝箱和碼垛設備的投資,全球包裝機器人市場預計將從2022年的38億美元成長到2032年的75億美元。標準化的二次包裝尺寸、硬質瓦楞紙板等級和加固的角柱使末端執行器能夠高速穩定地抓取紙箱。富邑葡萄酒集團(Treasury Wine Estates)的自動化酒桶倉庫升級使產量提高了60%,證明了專為免人工操作而設計的包裝的投資回報率。設備即服務(EaaS)合約透過將資本支出分攤到多年,降低了中型加工商的進入門檻。隨著預測性維護軟體的成熟,因裝箱機卡紙和堆垛機錯誤造成的停機時間減少。運轉率目標維持在95%以上。從長遠來看,隨著機器人成本曲線的下降,自動化概念將在二次包裝行業中變得更加普遍。
歐洲箱板紙產能過剩
受消費量下降15.3%的影響,歐洲造紙廠2023年的產量下降了12.8%,但供應過剩的局面依然存在,抑制了箱板紙價格,降低了盈利。不斷上漲的電力成本迫使工廠暫時停產,而2024年第三季再生紙價格下跌了約25%,反映出市場對再生材料的需求放緩。生產商正尋求透過合併來精簡產能,但反壟斷審查延長了合併進程。短期價格疲軟抑制了瓦楞紙板廠升級改造的意願,也減緩了輕量高性能紙板的普及。因此,尋求擴大出口的歐洲加工商正有選擇地投資於能夠改變瓦楞形狀並最佳化纖維利用率的軟性瓦楞紙板生產設備。
細分市場分析
瓦楞紙箱在2025年仍將維持41.35%的二級包裝市場佔有率,主要得益於其在食品、電商和工業供應鏈中久經考驗的結構性能和成本效益。高強度瓦楞和適用於潮濕倉庫環境的塗層技術的持續改進鞏固了瓦楞紙箱在該領域的主導地位,而數位印刷與製箱機的結合則縮短了前置作業時間並降低了最低訂購量。零售商傾向於選擇尺寸合適的運輸紙箱,以減少空隙填充,而製箱廠也正在積極響應這一需求,推出新型高速雷射劃線生產線,使SKU切換時間縮短至兩分鐘以內。易於自動化的RSC(平板瓦楞紙)和壓鎖式設計支援生產線末端的機器人操作,在降低人事費用的同時,還能維持每分鐘35箱以上的生產效率。瓦楞紙加工商也正在部署針對特定產品的設備,以減少高達18%的紙板用量,進而助力食品雜貨和一般商品分銷管道實現零浪費目標。
隨著大型零售商和汽車製造商尋求循環物流模式以消除一次性紡織品,可回收運輸包裝 (RTP) 預計將迎來最高的成長率,2026 年至 2031 年的複合年成長率 (CAGR) 將達到 8.41%。可折疊聚丙烯折疊式顯著降低了農產品運輸過程中的損壞率,並且可以重複使用 100 次以上,從而在總體擁有成本方面具有競爭優勢。豐田物料輸送歐洲公司報告稱,透過過渡到 RTP 共享模式,固態廢棄物減少了 74%,成本節省了 450 萬歐元。歐洲塑膠包裝廢棄物減量 (PPWR) 目標要求到 2030 年所有運輸包裝都必須可重複使用或可回收,這為相關法規提供了推動。發泡包裝、收縮套管和薄膜也在不斷發展,其抗穿刺性能不斷提高,以滿足當日處理的需求。同時,憑藉其精美的圖案和基於可再生資源的概念,高階折疊紙盒在化妝品和酒精飲料行業中保持著一定的市場需求。
區域分析
預計到2025年,亞太地區將佔全球二級包裝市場規模的40.55%,並在2031年之前以11.72%的複合年成長率成長,這主要得益於製造業規模的擴大和線上零售滲透率的提高。中國設備供應商的全球市佔率已擴大至35%,使得區域加工商能夠以極具吸引力的資本成本採用高速瓦楞紙生產設備。在對保存期限長的折疊紙盒和重型運輸箱的需求推動下,印度包裝食品市場預計將從2020年的320億美元成長到2025年的550億美元。在越南,胡志明市周邊聚集的900多家包裝企業正受惠於國內電子商務訂單每年15%至20%的成長。
在北美,小包裹量的強勁成長和消費品製造業的回流正推動新建和現有倉庫升級為機器人裝箱單元。沃爾瑪等零售商已設定循環包裝目標,鼓勵供應商從發泡聚苯乙烯轉向紙質緩衝材料。同時,歐洲面臨紙板產能過剩的問題,預計2023年消費量將下降15.3%,但對折疊紙盒和牛皮紙袋的強勁需求正推動產量增加6.5%。
預計到2050年,東南亞將成為世界第四大經濟體,稅收優惠政策鼓勵全球電子和服飾品牌將生產基地設於此。中東和非洲地區雖然尚未成熟,但潛力巨大,基礎設施投資和日益成長的年輕消費群體(他們擴大選擇網購)正在推動該地區的成長。監管差異顯著。歐盟的《塑膠包裝法規》(PPWR) 要求到2030年實現完全可回收,而美國各州的法規則各不相同,加州一次性塑膠減量25%的目標更使得合規環境變得複雜多變。跨國公司透過採用全球通用的設計方案來規避風險,這些方案可以根據區域標籤進行微調。
其他福利:
- Excel格式的市場預測(ME)表
- 3個月的分析師支持
目錄
第1章 引言
- 研究假設和市場定義
- 調查範圍
第2章調查方法
第3章執行摘要
第4章 市場情勢
- 市場概覽
- 市場促進因素
- 電子商務的快速成長推動了對瓦楞紙包裝的需求。
- 過渡到便於自動化的包裝形式
- 為品牌擁有者推廣可直接上架的解決方案
- 零售商必須實現零浪費
- 亞太新興市場線上雜貨市場的成長
- 實施數位印刷以提高 SKU 靈活性
- 市場限制
- 歐洲紙板產能過剩
- 再生纖維成本波動性加劇
- 塑膠稅的不確定性依然存在。
- 機器人維修領域資本投資的障礙
- 價值/供應鏈分析
- 監管環境
- 技術展望
- 波特五力模型
- 買方的議價能力
- 供應商的議價能力
- 新進入者的威脅
- 替代產品和服務的威脅
- 競爭對手之間的競爭
- 地緣政治局勢如何影響市場
第5章 市場規模及成長預測(價值,十億美元)
- 依產品類型
- 可折疊瓦楞紙箱
- 瓦楞紙箱
- 塑膠箱和手提袋
- 包裝膜、薄膜、收縮套管
- 可回收運輸包裝(RTP)
- 按最終用戶行業分類
- 食物
- 飲料
- 醫療和藥品
- 家用電子電器
- 個人護理和家居用品
- 工業產品
- 電子商務與物流
- 按地區
- 北美洲
- 美國
- 加拿大
- 墨西哥
- 南美洲
- 巴西
- 阿根廷
- 南美洲其他地區
- 歐洲
- 德國
- 英國
- 法國
- 義大利
- 西班牙
- 俄羅斯
- 其他歐洲地區
- 亞太地區
- 中國
- 日本
- 印度
- 韓國
- 東南亞
- 亞太其他地區
- 中東和非洲
- 中東
- 沙烏地阿拉伯
- 阿拉伯聯合大公國
- 土耳其
- 其他中東地區
- 非洲
- 南非
- 奈及利亞
- 其他非洲地區
- 中東
- 北美洲
第6章 競爭情勢
- 市場集中度
- 策略趨勢
- 市佔率分析
- 公司簡介
- Smurfit Westrock
- Packaging Corporation of America(PCA)
- Stora Enso Oyj
- International Paper Company
- Graphic Packaging Holding Co.
- WestRock Company
- Sealed Air Corporation
- Reynolds Group Holdings
- Mondi Group
- Amcor plc
- DS Smith plc
- Sonoco Products Company
- Huhtamaki Oyj
- Crown Holdings Inc.
- Ball Corporation
- Tetra Pak
- Pratt Industries
- Nippon Paper Industries
- Rengo Co. Ltd.
第7章 市場機會與未來展望
The secondary packaging market was valued at USD 268.50 billion in 2025 and estimated to grow from USD 282.14 billion in 2026 to reach USD 361.46 billion by 2031, at a CAGR of 5.08% during the forecast period (2026-2031).
Rising e-commerce volumes, retailer zero-waste mandates, and brand-owner requests for shelf-ready packs underpin steady demand for corrugated solutions that already supply 80% of online-retail parcels. Automation-ready designs are gaining traction as 84% of consumer packaged-goods producers have deployed robotics on secondary lines, and the share is projected to reach 93% by 2027. Digital printing, valued at USD 26.3 billion in 2022, is on course to exceed USD 51.5 billion by 2032 and is helping converters manage SKU proliferation through on-demand customization. Asia-Pacific commands 41% of the secondary packaging market share, propelled by China's packaging-machinery suppliers whose global share rose from 20% to 35% in five years. Consolidation among global paper and board majors continues, yet European surplus capacity and a 15.3% drop in 2023 consumption create margin pressure that tempers pricing power.
Global Secondary Packaging Market Trends and Insights
E-commerce Boom Fueling Corrugated Demand
Corrugated cases already supply 80% of parcels shipped through online channels, and 2.71 billion consumers purchased goods digitally in 2024, turning the shipping box into a frontline branding asset. Fit-to-product technology is cutting void fill and material usage while lowering dimensional-weight charges for carriers. With the global corrugated segment projected to surpass USD 800 billion by 2034, converters are broadening portfolios to include insulated inserts and tamper-evident seals that address perishability and security concerns. Digital presses enable late-stage personalization so brands can deliver promotional messages inside the shipper, boosting unboxing engagement. Automation-friendly die cuts support robotic erecting and packing, accelerating throughput in high-volume fulfillment nodes. Sustainability credentials of paper fiber resonate with retailers that pledge to eliminate hard-to-recycle plastics from secondary packaging market offerings.
Shift to Automation-Ready Pack Formats
Labour scarcity and production-line efficiency goals spur investment in robotic pick-and-place, case packing, and palletizing equipment, pushing the global packaging-robot market from USD 3.8 billion in 2022 to an anticipated USD 7.5 billion by 2032. Standardized secondary pack footprints, stiffer board grades, and reinforced corner posts enable end-effectors to grasp boxes consistently at high speeds. Treasury Wine Estates' autonomous barrel-hall upgrade lifted throughput by 60%, illustrating the ROI available when packaging is engineered for hands-free handling. Equipment-as-a-Service contracts now spread capital outlays over multiyear terms, easing adoption for mid-sized converters. As predictive-maintenance software matures, downtime tied to case-erector jams or palletizer misfeeds falls, preserving uptime targets above 95%. Over the long term, automation-ready concepts will permeate the secondary packaging industry as robots move down the cost curve.
Surplus Paperboard Capacity in Europe
European mills cut output 12.8% in 2023 after consumption fell 15.3%, yet oversupply persists, keeping linerboard prices subdued and eroding profitability. High electricity costs compel temporary shutdowns, while recovered-paper values dropped nearly 25% in Q3 2024, reflecting muted demand for recycled furnish. Producers pursue mergers to rationalize capacity, but antitrust scrutiny prolongs timelines. Short-term price weakness discourages capital upgrades in corrugating plants, delaying deployment of lightweight high-performance board grades. Consequently, European converters hunting for export growth selectively invest in flexible corrugators that can pivot between flute profiles and optimize fiber usage.
Other drivers and restraints analyzed in the detailed report include:
- Brand-Owner Push for Shelf-Ready Solutions
- Online Grocery Growth in Emerging APAC
- Rising Cost Volatility of Recycled Fibre
For complete list of drivers and restraints, kindly check the Table Of Contents.
Segment Analysis
Corrugated boxes retained 41.35% of the secondary packaging market share in 2025 on the back of their proven structural performance and cost-efficiency across food, e-commerce, and industrial supply chains. Steady upgrades to high-stack strength fluting and coatings that tolerate humid warehouses reinforce the segment's leadership, while digital print, in line with corrugators, shortens lead times and lowers minimum-order quantities. Retailers favor right-sized shippers that reduce void fill, and box plants answer with new high-speed laser-scoring lines able to switch SKUs in under two minutes. Automation-compatible RSC and crash-lock designs support end-of-line robotics, trimming manual labor and keeping throughput above 35 cases per minute. Corrugated converters also deploy fit-to-product equipment that cuts board usage by up to 18%, aligning with zero-waste scorecards in grocery and general merchandise channels.
Returnable transit packaging (RTP) clocks the fastest 2026-2031 growth at 8.41% CAGR as large retailers and automotive OEMs seek circular logistics models that eliminate single-use fiber. Polypropylene foldable crates slash damage rates in produce moves and can cycle more than 100 trips, delivering favorable total cost of ownership. Toyota Material Handling Europe reported 74% solid-waste reduction and EUR 4.5 million in savings after migrating to RTP pools. European PPWR targets that all transport packs be reusable or recyclable by 2030 add regulatory tailwinds. Foam wraps, shrink sleeves, and films continue to evolve with higher puncture resistance to cope with same-day delivery handling, while premium folding cartons sustain niche demand in cosmetics and spirits through upscale graphics and renewable sourcing narratives.
The Secondary Packaging Market Report is Segmented by Product Type (Folding Cartons, Corrugated Boxes, Plastic Crates and Totes, Wraps and Films, and More), End-User Industry (Food, Beverage, Healthcare and Pharma, Consumer Electronics, Personal Care and Household Care, and More), and Geography (North America, Europe, South America, Asia-Pacific, Middle East, and Africa). The Market Forecasts are Provided in Terms of Value (USD).
Geography Analysis
Asia-Pacific captured 40.55% of the secondary packaging market size in 2025 and is forecast to post a 11.72% CAGR through 2031 as manufacturing output climbs and online retail penetration deepens. China's equipment suppliers raised their global share to 35%, enabling regional converters to install high-speed corrugators at attractive capital costs. India's packaged-food sector is moving from USD 32 billion in 2020 toward USD 55 billion by 2025, fueling demand for shelf-stable folding cartons and sturdy shipping cases. Vietnam's 900-plus packaging firms, clustered around Ho Chi Minh City, benefit from 15-20% annual growth in domestic e-commerce orders.
North America experiences robust parcel volumes and the reshoring of consumer-goods manufacturing, encouraging upgrades to robotic case-packing cells in both green- and brownfield warehouses. Retailers such as Walmart set circular-packaging targets that nudge suppliers to swap out polystyrene void fill for paper cushioning. In contrast, Europe grapples with over-capacity in paperboard that dragged consumption down 15.3% in 2023, although demand for folding cartons and sack-kraft showed resilience with 6.5% output growth.
Southeast Asia is projected to become the fourth-largest economic bloc by 2050, helped by tax incentives that draw global electronics and apparel brands to localize production. Middle East and Africa remain nascent yet promising, propelled by infrastructure investments and a youthful consumer base buying more online. Regulatory divergence is stark: the EU PPWR mandates full recyclability by 2030, whereas U.S. regulations vary by state and California's 25% single-use plastic reduction targets create a moving compliance landscape. Multinationals hedge risk by adopting globally compliant designs that can be fine-tuned with localized labeling.
- Smurfit Westrock
- Packaging Corporation of America (PCA)
- Stora Enso Oyj
- International Paper Company
- Graphic Packaging Holding Co.
- WestRock Company
- Sealed Air Corporation
- Reynolds Group Holdings
- Mondi Group
- Amcor plc
- DS Smith plc
- Sonoco Products Company
- Huhtamaki Oyj
- Crown Holdings Inc.
- Ball Corporation
- Tetra Pak
- Pratt Industries
- Nippon Paper Industries
- Rengo Co. Ltd.
Additional Benefits:
- The market estimate (ME) sheet in Excel format
- 3 months of analyst support
TABLE OF CONTENTS
1 INTRODUCTION
- 1.1 Study Assumptions and Market Definition
- 1.2 Scope of the Study
2 RESEARCH METHODOLOGY
3 EXECUTIVE SUMMARY
4 MARKET LANDSCAPE
- 4.1 Market Overview
- 4.2 Market Drivers
- 4.2.1 E-commerce boom fueling corrugated demand
- 4.2.2 Shift to automation-ready pack formats
- 4.2.3 Brand-owner push for shelf-ready solutions
- 4.2.4 Retailer's zero-waste mandates
- 4.2.5 On-line grocery growth in emerging APAC
- 4.2.6 Adoption of digital printing for SKU agility
- 4.3 Market Restraints
- 4.3.1 Surplus paperboard capacity in Europe
- 4.3.2 Rising cost volatility of recycled fibre
- 4.3.3 Persistent plastics-tax uncertainty
- 4.3.4 Cap-ex hurdle for robotics retrofits
- 4.4 Value / Supply-Chain Analysis
- 4.5 Regulatory Landscape
- 4.6 Technological Outlook
- 4.7 Porter's Five Forces
- 4.7.1 Bargaining Power of Buyers
- 4.7.2 Bargaining Power of Suppliers
- 4.7.3 Threat of New Entrants
- 4.7.4 Threat of Substitute Products and Services
- 4.7.5 Intensity of Competitive Rivalry
- 4.8 Impact of Geo-Political Scenarios on the Market
5 MARKET SIZE & GROWTH FORECASTS (VALUE, USD BN)
- 5.1 By Product Type
- 5.1.1 Folding Cartons
- 5.1.2 Corrugated Boxes
- 5.1.3 Plastic Crates and Totes
- 5.1.4 Wraps, Films and Shrink Sleeves
- 5.1.5 Returnable Transit Packaging (RTP)
- 5.2 By End-user Industry
- 5.2.1 Food
- 5.2.2 Beverage
- 5.2.3 Healthcare and Pharma
- 5.2.4 Consumer Electronics
- 5.2.5 Personal and Household Care
- 5.2.6 Industrial Goods
- 5.2.7 E-commerce and Logistics
- 5.3 By Geography
- 5.3.1 North America
- 5.3.1.1 United States
- 5.3.1.2 Canada
- 5.3.1.3 Mexico
- 5.3.2 South America
- 5.3.2.1 Brazil
- 5.3.2.2 Argentina
- 5.3.2.3 Rest of South America
- 5.3.3 Europe
- 5.3.3.1 Germany
- 5.3.3.2 United Kingdom
- 5.3.3.3 France
- 5.3.3.4 Italy
- 5.3.3.5 Spain
- 5.3.3.6 Russia
- 5.3.3.7 Rest of Europe
- 5.3.4 Asia-Pacific
- 5.3.4.1 China
- 5.3.4.2 Japan
- 5.3.4.3 India
- 5.3.4.4 South Korea
- 5.3.4.5 South-East Asia
- 5.3.4.6 Rest of APAC
- 5.3.5 Middle East and Africa
- 5.3.5.1 Middle East
- 5.3.5.1.1 Saudi Arabia
- 5.3.5.1.2 United Arab Emirates
- 5.3.5.1.3 Turkey
- 5.3.5.1.4 Rest of Middle East
- 5.3.5.2 Africa
- 5.3.5.2.1 South Africa
- 5.3.5.2.2 Nigeria
- 5.3.5.2.3 Rest of Africa
- 5.3.5.1 Middle East
- 5.3.1 North America
6 COMPETITIVE LANDSCAPE
- 6.1 Market Concentration
- 6.2 Strategic Moves
- 6.3 Market Share Analysis
- 6.4 Company Profiles (includes Global level Overview, Market level overview, Core Segments, Financials as available, Strategic Information, Market Rank/Share for key companies, Products and Services, and Recent Developments)
- 6.4.1 Smurfit Westrock
- 6.4.2 Packaging Corporation of America (PCA)
- 6.4.3 Stora Enso Oyj
- 6.4.4 International Paper Company
- 6.4.5 Graphic Packaging Holding Co.
- 6.4.6 WestRock Company
- 6.4.7 Sealed Air Corporation
- 6.4.8 Reynolds Group Holdings
- 6.4.9 Mondi Group
- 6.4.10 Amcor plc
- 6.4.11 DS Smith plc
- 6.4.12 Sonoco Products Company
- 6.4.13 Huhtamaki Oyj
- 6.4.14 Crown Holdings Inc.
- 6.4.15 Ball Corporation
- 6.4.16 Tetra Pak
- 6.4.17 Pratt Industries
- 6.4.18 Nippon Paper Industries
- 6.4.19 Rengo Co. Ltd.
7 MARKET OPPORTUNITIES & FUTURE OUTLOOK
- 7.1 White-space & Unmet-need Assessment
- 7.2 Investment Analysis


