


 |
市場調查報告書
商品編碼
1940781
亞太地區資料中心市場佔有率分析、產業趨勢與統計、成長預測(2026-2031)Asia-Pacific Data Center - Market Share Analysis, Industry Trends & Statistics, Growth Forecasts (2026 - 2031) |
||||||
※ 本網頁內容可能與最新版本有所差異。詳細情況請與我們聯繫。
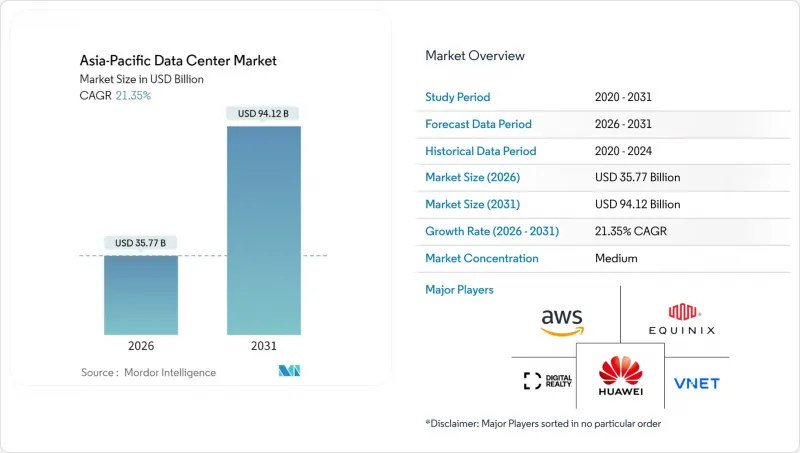
預計到 2026 年,亞太地區資料中心市場規模將達到 357.7 億美元。
這意味著從 2025 年的 294.7 億美元成長到 2031 年的 941.2 億美元,2026 年至 2031 年的複合年成長率為 21.35%。
就裝置容量而言,預計市場規模將從2025年的29,310兆瓦成長到2030年的63,110兆瓦,在預測期(2025-2030年)內複合年成長率(CAGR)為16.57%。市場佔有率和估計值均以兆瓦(MW)為單位計算和報告。 5G的快速部署、人工智慧/機器學習(AI/ML)工作負載的爆炸性成長以及資料主權法規的推動,使得亞太地區資料中心容量在短短五年內加倍,使其成為全球成長最快的數位基礎設施領域。為了滿足高功率密度工作負載和日益嚴格的效率要求,營運商正在迅速採用液冷技術、推廣可再生能源並發展海底電纜連接。中國目前以34.58%的市佔率主導,但印度20.50%的複合年成長率表明,市場需求正在顯著向南亞轉移。雖然託管仍然是主流服務模式,但以中國雲端巨頭主導的超大規模建設浪潮正在重塑競爭格局,因為企業正在仔細權衡成本、延遲和合規性之間的利弊。
亞太資料中心市場趨勢與洞察
加速部署5G核心網路
5G的擴展正在重塑亞太資料中心市場的工作負載部署格局。到2024年,中國將擁有超過338萬個5G基地台,每個基地台的延遲要求低於20毫秒,通訊業者在人口中心附近的基地台邊緣設施中部署這些基地台。在日本,通訊業者在2024年投資1.2兆日圓用於5G基礎設施建設,以支持製造業和娛樂業的超低延遲應用。這正在加速本地對分散式運算節點的需求。新加坡的5G覆蓋率已達到95%,並且強制要求關鍵服務進行本地處理的政策正在推動新的邊緣部署。這種流量分散使得中型設施的成長速度超過了大型資料中心。網路回程傳輸合作夥伴關係和模組化設計正成為通訊業者租戶的關鍵差異化因素。
中國科技巨頭加大對自有超大規模建築的投資
阿里巴巴、騰訊和位元組跳動正將雲端基礎設施預算轉向建造自有園區,以最佳化成本並遵守當地法規。阿里巴巴已累計280億美元用於2027年建造新的區域,其中60%將用於自有設施。位元組跳動已投資72億美元用於大規模語言模型訓練的人工智慧設計,而騰訊則投資58億美元在東南亞為遊戲玩家建造水冷資料中心。這一成長推動了亞太資料中心市場的超大規模細分領域,同時也加劇了零售託管市場的價格競爭。現有企業正透過擴展服務組合(例如雲端間互聯、託管GPU叢集和合規即服務)來捍衛市場佔有率。
漫長的併網核准過程
在高速成長的市場中,併網延誤會延長計劃的投資回收期。在印度,由於各邦委員會需要審查環境影響和電網穩定性,核准平均需要18到24個月。印尼國家電力公司(PLN)對10兆瓦以上的負載也設定了類似的核准時限,而菲律賓的可再生能源認證強制令將使核准流程延長至多一年。開發商被迫承擔閒置土地成本和倉儲設施折舊免稅額,這降低了內部收益率(IRR),並減緩了亞太地區資料中心市場的容量擴張。
細分市場分析
到2031年,中型資料中心將以12.90%的複合年成長率成長,通訊業者和CDN供應商將優先建造5-20MW的節點用於都市區流量聚合。大型園區仍將佔據亞太資料中心市場30.62%的佔有率,全球雲端租戶因其規模經濟優勢而選擇它們。大型(100MW以上)樞紐將作為區域核心,支援人工智慧訓練,而小規模設施將滿足特定企業和偏遠地區的需求。隨著5G網路的不斷密集化,即使大型企劃主導資本投資,分散式架構也將繼續推動對中型資料中心的需求。
亞太地區的資料中心產業正日益採用星型拓樸結構,大型樞紐提供高密度運算能力,中型衛星則確保網路邊緣的低延遲。主要城市的電力和土地資源限制促使企業將土地購買策略轉向大阪、海德拉巴和新山等二線城市。對投資人而言,分散投資組合,投資不同規模的資料中心,可以降低對單一地點電力瓶頸的依賴。
截至2025年,Tier 3級資料中心將佔據亞太地區資料中心市場62.35%的佔有率,並提供99.982%的運轉率,許多公司認為這一水準足以滿足需求,無需承擔Tier 4級資料中心的額外成本。新加坡金融管理局等監管機構對金融資料居住的要求強制要求使用Tier 3級及以上級別的資料中心,這進一步鞏固了市場需求。 Tier 1級和Tier 2級資料中心主要服務於開發和測試工作負載,而Tier 4級資料中心則專用於關鍵支付系統和某些政府雲端平台。
標準化的三級(Tier 3)設計圖縮短了核准時間,並允許使用預製構件,從而將工期縮短高達 20%。符合 ISO 27001 標準也進一步簡化了認證流程。因此,隨著人工智慧推動貨架密度的提高,同時營運商仍需專注於成本,三級(Tier 3)有望進一步鞏固主導地位。
亞太地區資料中心市場報告按資料中心規模(大型、超大型、中型、巨型、小規模)、等級(Tier 1-2、Tier 3、Tier 4)、資料中心類型(超大規模/自建、企業/邊緣、託管)、最終用戶(銀行、金融服務和保險 (BFSI)、IT 及 ITES、電子商務、政府、製造業、媒體和娛樂等地區進行細分。市場預測以 IT 負載容量(兆瓦)為單位。
其他福利:
- Excel格式的市場預測(ME)表
- 3個月的分析師支持
目錄
第1章 引言
- 研究假設和市場定義 - 研究範圍
第2章調查方法
第3章執行摘要
第4章 市場情勢
- 市場概覽
- 市場促進因素
- 加速部署5G核心網路
- 中國主要科技公司加大對超大規模建設的投資
- 政府為綠色資料中心提供稅收獎勵
- AI/ML工作負載對本地GPU叢集的需求快速成長
- 快速整合海底電纜登陸站和邊緣設施
- 主權財富基金傾向於客製化建造模式
- 市場限制
- 延長併網核准流程
- 中國北方面臨嚴重的水資源短缺風險
- 亞太地區一線城市房地產成本不斷上漲
- 認證資料中心技術人員短缺
- 市場展望
- IT負載能力
- 高架地板面積
- 託管收入
- 預裝機架
- 機架空間利用率
- 海底電纜
- 主要行業趨勢
- 智慧型手機用戶
- 每部智慧型手機的資料通訊
- 行動資料通訊速度
- 寬頻資料傳輸速度
- 光纖連接網路
- 法律規範
- 中國
- 日本
- 印度
- 印尼
- 澳洲
- 新加坡
- 紐西蘭
- 馬來西亞
- 泰國
- 亞太其他地區
- 價值鍊和通路分析
- 波特五力分析
- 新進入者的威脅
- 買方的議價能力
- 供應商的議價能力
- 替代品的威脅
- 競爭對手之間的競爭
第5章 市場規模及成長預測(兆瓦)
- 按資料中心規模
- 大規模
- 巨大的
- 中號
- 百萬
- 小規模
- 依層級類型
- 一級和二級
- 三級
- 第四級
- 依資料中心類型
- 超大規模/內部建設
- 企業/邊緣運算
- 搭配
- 未使用的
- 使用
- 零售共址
- 批發託管
- 最終用戶
- BFSI
- 資訊科技與資訊科技服務
- 電子商務
- 政府
- 製造業
- 媒體與娛樂
- 溝通
- 其他最終用戶
- 按國家/地區
- 中國
- 日本
- 印度
- 印尼
- 澳洲
- 新加坡
- 紐西蘭
- 馬來西亞
- 泰國
- 亞太其他地區
第6章 競爭情勢
- 市場集中度
- 策略趨勢
- 市佔率分析
- 公司簡介
- Amazon Web Services, Inc
- Equinix, Inc.
- Alibaba Cloud
- Chindata Group Holdings Ltd
- AirTrunk Operating Pty Ltd
- Space DC Pte Ltd
- NTT Ltd
- Huawei Cloud Computing Technologies Co., Ltd
- Global Data Solutions Co., Ltd.(GDS)
- Google Inc
- LG Uplus Corp
- Range Technology Development Co., Ltd
- NEXTDC Limited
- Digital Realty Trust Inc.
- Beijing VNET Broadband Data Center Co., Ltd
第7章 市場機會與未來展望
Asia-Pacific Data Center Market size in 2026 is estimated at USD 35.77 billion, growing from 2025 value of USD 29.47 billion with 2031 projections showing USD 94.12 billion, growing at 21.35% CAGR over 2026-2031.
In terms of installed base, the market is expected to grow from 29.31 thousand megawatt in 2025 to 63.11 thousand megawatt by 2030, at a CAGR of 16.57% during the forecast period (2025-2030). The market segment shares and estimates are calculated and reported in terms of MW. Rapid 5G roll-outs, AI/ML workload proliferation, and data-sovereignty regulations are doubling capacity in just five years, making the Asia Pacific Data Center market the world's fastest-growing digital-infrastructure arena. Operators are racing to integrate liquid cooling, renewable-energy sourcing, and submarine-cable landing connectivity to satisfy power-dense workloads while meeting increasingly stringent efficiency mandates. China currently dominates with 34.58% share, yet India's 20.50% CAGR signals a seismic rebalancing of demand toward South Asia. Colocation remains the prevailing service model, but the hyperscale self-build wave led by Chinese cloud giants is redrawing the competitive map as enterprises weigh cost, latency, and compliance trade-offs.
Asia-Pacific Data Center Market Trends and Insights
Accelerating Roll-out of 5G Core Networks
Widespread 5G adoption is reshaping workload-placement economics across the Asia Pacific Data Center market. China surpassed 3.38 million 5G base stations in 2024, each requiring sub-20 ms latency, thereby pushing operators to position medium-sized edge facilities nearer to population centers . In Japan, carriers injected JPY 1.2 trillion into 5G infrastructure during 2024 to enable ultra-low-latency applications across manufacturing and entertainment, catalyzing regional demand for distributed compute nodes. Singapore achieved 95% 5G coverage and stipulated local processing for critical services, a policy that accelerates new edge builds . The resulting traffic dispersion explains why medium facilities are growing faster than mega sites. For developers, network-backhaul partnerships and modular designs have emerged as key differentiators when courting telecom tenants.
Rising Hyperscale Self-build Investments by Chinese Tech Majors
Alibaba, Tencent, and ByteDance are redirecting cloud-infrastructure budgets toward in-house campuses to optimize costs and comply with localization rules. Alibaba earmarked USD 28 billion for new regional builds through 2027, allocating 60% to self-operated estates . ByteDance dedicated USD 7.2 billion to AI-ready designs that support large-language-model training, while Tencent invested USD 5.8 billion in liquid-cooled sites targeting Southeast Asian gamers. The surge is boosting the Asia Pacific Data Center market's hyperscale segment yet intensifying pricing pressure on retail colocation. Incumbents are responding with deeper service portfolios-inter-cloud interconnects, managed GPU clusters, and compliance-as-a-service-to defend share.
Prolonged Grid-Connection Approval Cycles
Connection delays extend project payback periods in high-growth markets. Indian approvals average 18-24 months as state boards scrutinize environmental impact and grid stability Indonesia's PLN imposes similar timelines for >10 MW loads, and the Philippines' renewable-certificate mandate lengthens processing by up to a year. Developers shoulder idle-land costs and warehoused equipment depreciation, dampening IRRs and slowing the Asia Pacific Data Center market's capacity ramp.
Other drivers and restraints analyzed in the detailed report include:
- Government Tax-holiday Incentives for Green Data Centers
- Surging AI/ML Workload Demand for On-prem GPU Clusters
- Shortage of Certified Data center Engineers
For complete list of drivers and restraints, kindly check the Table Of Contents.
Segment Analysis
Medium-scale sites posted 12.90% CAGR through 2031 as telecom and CDN providers prioritize 5- to 20-MW nodes for metro-edge traffic aggregation. Large campuses still hold 30.62% share of the Asia Pacific Data Center market size, favored by global cloud tenants for economies of scale. Massive (>100 MW) hubs function as regional cores supporting AI training, while small facilities serve niche enterprise or remote-area requirements. As 5G densification continues, decentralized architectures will keep propelling medium-site demand, even as mega-projects dominate capital deployed.
The Asia Pacific Data Center industry increasingly embraces a hub-and-spoke topology: massive hubs supply high-density compute, and medium satellites ensure latency compliance at the network edge. Power and land constraints in primary cities are prompting land-banking strategies in secondary metros such as Osaka, Hyderabad, and Johor Bahru. For investors, portfolio diversification across size classes reduces exposure to single-site utility bottlenecks.
Tier 3 captured 62.35% share of the Asia Pacific Data Center market size in 2025, offering the 99.982% uptime most enterprises deem sufficient without tier 4's cost premium. Mandates from regulators like Singapore's Monetary Authority require tier 3 minimums for financial data residency, cementing demand. Tier 1 and tier 2 attract dev-test workloads, while tier 4 stays confined to critical clearing-house systems and select government clouds.
Standardized tier 3 blueprints shorten permitting cycles and enable prefabricated component use, trimming build schedules by up to 20%. ISO 27001 alignment further streamlines certification. Consequently, tier 3 will likely widen its leadership as AI spurs higher rack densities yet operators remain cost-sensitive.
The Asia Pacific Data Center Market Report is Segmented by Data Center Size (Large, Massive, Medium, Mega, and Small), Tier Type (Tier 1 and 2, Tier 3, and Tier 4), Data Center Type (Hyperscale/Self-built, Enterprise/Edge, and Colocation), End User (BFSI, IT and ITES, E-Commerce, Government, Manufacturing, Media and Entertainment, and More), and Geography. The Market Forecasts are Provided in Terms of IT Load Capacity (MW).
List of Companies Covered in this Report:
- Amazon Web Services, Inc
- Equinix, Inc.
- Alibaba Cloud
- Chindata Group Holdings Ltd
- AirTrunk Operating Pty Ltd
- Space DC Pte Ltd
- NTT Ltd
- Huawei Cloud Computing Technologies Co., Ltd
- Global Data Solutions Co., Ltd. (GDS)
- Google Inc
- LG Uplus Corp
- Range Technology Development Co., Ltd
- NEXTDC Limited
- Digital Realty Trust Inc.
- Beijing VNET Broadband Data Center Co., Ltd
Additional Benefits:
- The market estimate (ME) sheet in Excel format
- 3 months of analyst support
TABLE OF CONTENTS
1 INTRODUCTION
- 1.1 Study Assumptions and Market Definition - Scope of the Study
2 RESEARCH METHODOLOGY
3 EXECUTIVE SUMMARY
4 MARKET LANDSCAPE
- 4.1 Market Overview
- 4.2 Market Drivers
- 4.2.1 Accelerating roll-out of 5G core networks
- 4.2.2 Rising hyperscale self-build investments by Chinese tech majors
- 4.2.3 Government tax-holiday incentives for green data centers
- 4.2.4 Surging AI/ML workload demand for on-prem GPU clusters
- 4.2.5 Rapid integration of submarine-cable landing stations with edge facilities
- 4.2.6 Build-to-suit models preferred by sovereign wealth funds
- 4.3 Market Restraints
- 4.3.1 Prolonged grid connection approval cycles
- 4.3.2 Pronounced water scarcity risk in Northern China
- 4.3.3 High real-estate cost inflation in tier-one Asia-Pacific cities
- 4.3.4 Shortage of certified data-center engineers
- 4.4 Market Outlook
- 4.4.1 IT Load Capacity
- 4.4.2 Raised Floor Space
- 4.4.3 Colocation Revenue
- 4.4.4 Installed Racks
- 4.4.5 Rack Space Utilization
- 4.4.6 Submarine Cable
- 4.5 Key Industry Trends
- 4.5.1 Smartphone Users
- 4.5.2 Data Traffic Per Smartphone
- 4.5.3 Mobile Data Speed
- 4.5.4 Broadband Data Speed
- 4.5.5 Fiber Connectivity Network
- 4.5.6 Regulatory Framework
- 4.5.6.1 China
- 4.5.6.2 Japan
- 4.5.6.3 India
- 4.5.6.4 Indonesia
- 4.5.6.5 Australia
- 4.5.6.6 Singapore
- 4.5.6.7 New Zealand
- 4.5.6.8 Malaysia
- 4.5.6.9 Thailand
- 4.5.6.10 Rest of Asia Pacific
- 4.6 Value Chain and Distribution Channel Analysis
- 4.7 Porter's Five Forces Analysis
- 4.7.1 Threat of New Entrants
- 4.7.2 Bargaining Power of Buyers
- 4.7.3 Bargaining Power of Suppliers
- 4.7.4 Threat of Substitutes
- 4.7.5 Intensity of Competitive Rivalry
5 MARKET SIZE AND GROWTH FORECASTS (MW)
- 5.1 By Data Center Size
- 5.1.1 Large
- 5.1.2 Massive
- 5.1.3 Medium
- 5.1.4 Mega
- 5.1.5 Small
- 5.2 By Tier Type
- 5.2.1 Tier 1 and 2
- 5.2.2 Tier 3
- 5.2.3 Tier 4
- 5.3 By Data Center Type
- 5.3.1 Hyperscale/Self-built
- 5.3.2 Enterprise/Edge
- 5.3.3 Colocation
- 5.3.3.1 Non-Utilized
- 5.3.3.2 Utilized
- 5.3.3.2.1 Retail Colocation
- 5.3.3.2.2 Wholesale Colocation
- 5.4 By End User
- 5.4.1 BFSI
- 5.4.2 IT and ITES
- 5.4.3 E-Commerce
- 5.4.4 Government
- 5.4.5 Manufacturing
- 5.4.6 Media and Entertainment
- 5.4.7 Telecom
- 5.4.8 Other End Users
- 5.5 By Country
- 5.5.1 China
- 5.5.2 Japan
- 5.5.3 India
- 5.5.4 Indonesia
- 5.5.5 Australia
- 5.5.6 Singapore
- 5.5.7 New Zealand
- 5.5.8 Malaysia
- 5.5.9 Thailand
- 5.5.10 Rest of Asia Pacific
6 COMPETITIVE LANDSCAPE
- 6.1 Market Concentration
- 6.2 Strategic Moves
- 6.3 Market Share Analysis
- 6.4 Company Profiles (includes Global level Overview, Market level overview, Core Segments, Financials as available, Strategic Information, Market Rank/Share for key companies, Products and Services, and Recent Developments)
- 6.4.1 Amazon Web Services, Inc
- 6.4.2 Equinix, Inc.
- 6.4.3 Alibaba Cloud
- 6.4.4 Chindata Group Holdings Ltd
- 6.4.5 AirTrunk Operating Pty Ltd
- 6.4.6 Space DC Pte Ltd
- 6.4.7 NTT Ltd
- 6.4.8 Huawei Cloud Computing Technologies Co., Ltd
- 6.4.9 Global Data Solutions Co., Ltd. (GDS)
- 6.4.10 Google Inc
- 6.4.11 LG Uplus Corp
- 6.4.12 Range Technology Development Co., Ltd
- 6.4.13 NEXTDC Limited
- 6.4.14 Digital Realty Trust Inc.
- 6.4.15 Beijing VNET Broadband Data Center Co., Ltd
7 MARKET OPPORTUNITIES AND FUTURE OUTLOOK
- 7.1 White-space and unmet-need assessment
 全球資料中心市場規模、佔有率、趨勢和成長分析報告(2026-2034年)
 資料中心基礎設施管理軟體市場 - 全球產業規模、佔有率、趨勢、機會、預測:按組件、部署類型、垂直市場、地區和競爭對手分類,2021-2031 年資料中心市場 - 全球產業規模、佔有率、趨勢、機會、預測:按類型、密度、最終用戶、地區和競爭格局分類,2021-2031年
 2026年全球水下資料中心市場報告2026年全球光纖連接服務工具市場報告2026年全球行動雙倍數據速率(DDR)市場報告
 永續資料中心市場預測至2034年-全球分析(按組件、資料中心類型、容量、部署模式、永續發展舉措、冷卻技術、最終用戶和地區分類)
 資料中心基礎設施管理 (DCIM) 軟體市場:全球和區域分析:按產品、應用和國家分類 - 分析和預測 (2026–2036)
 2026-2030年全球資料中心市場
 在軌資料中心市場展望