


 |
市場調查報告書
商品編碼
1940694
巨量資料工程服務:市場佔有率分析、產業趨勢與統計、成長預測(2026-2031)Big Data Engineering Services - Market Share Analysis, Industry Trends & Statistics, Growth Forecasts (2026 - 2031) |
||||||
※ 本網頁內容可能與最新版本有所差異。詳細情況請與我們聯繫。
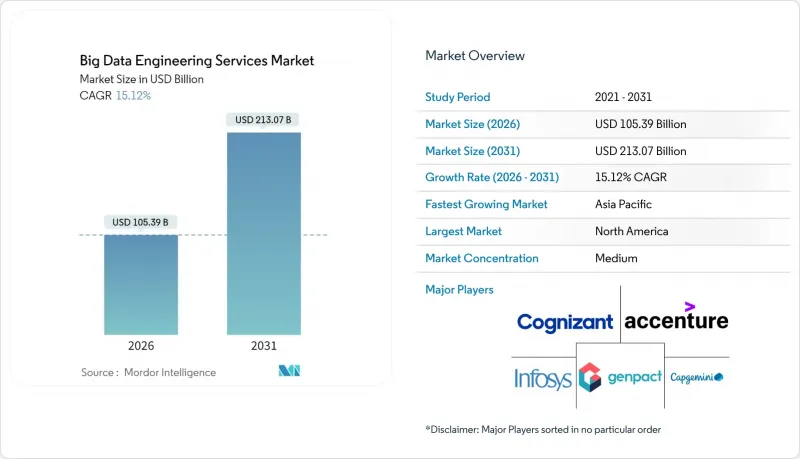
預計到 2026 年,巨量資料工程服務市場規模將達到 1,053.9 億美元,高於 2025 年的 915.4 億美元。
預計到 2031 年,該產業規模將達到 2,130.7 億美元,2026 年至 2031 年的複合年成長率為 15.12%。
需求成長的促進因素包括人工智慧驅動決策的持續普及、物聯網終端的擴展,以及將原始數據和非結構化資訊轉化為可信洞察的需求。企業正在將工作負載遷移到彈性平台,這些平台能夠顯著降低處理延遲,並透過基於結果的服務協議加快價值實現速度。同時,混合架構也越來越受歡迎,因為規避風險的企業希望避免被供應商鎖定,並遵守日益嚴格的資料主權法規。此外,自動化資料管道工具透過減少手動編碼和維護工作量,緩解了人才短缺的問題。
全球巨量資料工程服務市場趨勢與洞察
非結構化物聯網/社交數據的快速成長推動了對服務的需求
工業感測器、社交平臺和邊緣設備會產生Petabyte的原始數據,而傳統數據倉庫無法在不呈指數級增加延遲的情況下處理這些數據。資產密集型工業企業以毫秒的速度傳輸振動、壓力和環境測量數據,但由於數據模式柔軟性,約70%的數據仍未被利用。服務供應商目前正在部署「讀取時模式」湖倉,這些湖倉可以接收半結構化有效負載,執行在線連續分析,並將資料儲存為與即時分析引擎相容的列式格式。預先建置的MQTT、OPC-UA和關鍵社交API連接器可以加快部署速度,而邊緣閘道器則透過在本地處理事件來降低回程傳輸成本。這些功能集共同將不可控的資料成長轉化為可執行的洞察,從而為預測性維護、客戶情緒追蹤和供應鏈預測提供支援。
以成本效益和結果為導向的服務合約改變了合約簽訂方式。
採購主管們越來越傾向於採用績效目標,例如低於 100 毫秒的查詢延遲和 99.9% 的管道運轉率,而不是按小時計費的合約。績效合約會針對未達到的關鍵績效指標 (KPI) 觸發懲罰條款,並為超出服務水準提供激勵。這促使供應商實現測試自動化、實施自癒作業,並採用監控儀表板來檢測異常情況,從而避免違反服務等級協定 (SLA)。財務長們支持這種模式,認為它可以控制支出波動,而供應商則樂於接受它,以加深策略一致性並提升銷售持續最佳化工作流程。早期採用者報告稱,與按工時和材料計費的合約相比,營運成本節省了 20-30%,並且透過將財務結果與數據平台性能直接掛鉤,更快地獲得了經營團隊的認可。
數據工程人才嚴重短缺限制了成長。
精通流式架構、湖屋最佳化和機器學習驅動編配的專業人才需求仍然強勁。高級工程師的薪資比傳統資料庫管理員高出 40% 至 60%,這推高了供應商和客戶的營運成本。為了彌補這一差距,供應商紛紛推出培訓課程、認證海外團隊,並引入自動化技術來減少人工工作量。然而,在金融服務和醫療保健等高度監管且複雜的部署環境中,仍需要自動化無法完全取代的實務經驗,這會拖慢計劃進度並限制並發性。
細分市場分析
截至2025年,資料整合和ETL服務將佔據巨量資料工程服務市場31.21%的佔有率,主要由管理20多個資料來源且需要嚴格整合的公司佔據。該領域的領先地位高度依賴即時串流架構,這些架構可將交易、感測器和點選流事件同步到湖屋儲存庫。供應商部署變更資料擷取(CDCU) 管道和模式演化策略,以維持分鐘級的更新週期,滿足追蹤存貨周轉和詐欺訊號的儀表板需求。日益成長的管治要求推動了對擴展資料追蹤、檢驗和異常修復例程的需求,這些例程直接建構在資料擷取作業中。
進階分析和視覺化是成長最快的組件,複合年成長率高達 15.61%。在此領域,服務供應商將預先設定的筆記本、特定領域的特徵庫和響應式儀表板捆綁在一起,可在數天內將原始資料轉換為預測性或指導性建議。自然語言查詢層使洞察生成更加普及,業務部門人員無需具備 SQL 專業知識即可迭代驗證假設。由於分析結果構成了按效果付費模式的基礎,服務提供者正在積極改進配置方案,以確保數千同時上線用戶都能獲得亞秒級的渲染速度。整合和分析相輔相成:乾淨、統一的數據驅動著高級模型,而高級模型反過來又帶來性能提升,證明了持續平台投資的合理性。
到2025年,財政部門的支出將佔總支出的29.14%,反映出其在監管報告、流動性風險計算和收入預測方面的深入參與。其工作量包括多幣種匯總、每日損益計算以及符合審核要求的壓力測試引擎,因此,服務提供者強調確定性計算、不可篡改的帳簿以及與外部清算機構的自動對帳。然而,財政部門的範疇仍在不斷擴展,延伸至持續智慧儀表板,以便及時向財政部門通報殖利率曲線的變動和資本充足率閾值。
行銷和銷售管道正以 15.49% 的複合年成長率成長,利用行為訊號近乎即時地部署高水平個人化的行銷宣傳活動。客戶 360 度架構整合了網頁瀏覽、POS 和客戶服務記錄,為最佳優惠引擎提供建議。智慧路由模型選擇最佳頻道、創新和投放時間,進而將轉換率提升兩位數百分比。服務公司正在實施實驗框架,以 A/B 測試演算法調整,並將績效指標納入自動化預算分配。隨著隱私法規對第三方 Cookie 的限制,第一方資料平台正成為策略性資產,進一步提升了市場推廣功能的工程需求。
區域分析
到2025年,北美將以39.18%的收入佔比領跑,這得益於其成熟的雲端基礎設施、人工智慧的早期應用以及要求先進管治的嚴格監管。金融服務公司正在即時完善反洗錢模型,醫療保健網路正在符合HIPAA標準的叢集上建立精準醫療工作流程。創業投資資金地流入資料平台Start-Ups,推動服務協議的簽訂,以強化其架構並拓展市場。
預計到2031年,亞太地區的年複合成長率將達到15.74%,遠超其他地區。政府支持的智慧製造園區、5G網路部署以及數位銀行牌照的核准,正推動資料量激增,並對先進工程技術提出了更高的要求。中國和印度的電商巨頭每天處理數十億次的點選流事件,推動建構Exabyte級資料湖的區域標準。製造中心正在對裝配線維修,加裝組裝聯網(IIoT)感測器,這需要邊緣雲管道來降低延遲並符合新的資料本地化法規。
在歐洲,GDPR 和即將推出的人工智慧管治法規促使各組織機構需要採用隱私設計控制措施,推動了相關技術的穩定應用。汽車和工業集團正在試行數位雙胞胎項目,以整合遙測數據、維護記錄和供應商數據,從而提高生產效率並減少停機時間。中東和非洲地區雖然是新興市場,但正加大對油氣現代化改造預算和智慧城市聯盟基礎資料層的投資。高頻寬海底電纜和區域雲平台正在降低准入門檻,預示著該地區具有選擇性但永續成長的潛力。
其他福利:
- Excel格式的市場預測(ME)表
- 分析師支持(3個月)
目錄
第1章 引言
- 研究假設和市場定義
- 調查範圍
第2章調查方法
第3章執行摘要
第4章 市場情勢
- 市場概覽
- 市場促進因素
- 非結構化物聯網/社交數據的激增
- 成本效益高、以結果為導向的服務合約
- 部署雲端原生巨量資料棧
- 監理機關推動數據驅動決策
- 人工智慧自動化數據管道的崛起
- 產業專用的數據市場
- 市場限制
- 數據工程人才嚴重短缺
- 網路安全和隱私合規成本
- 舊有系統整合的複雜性
- 雲端資料傳輸成本和供應商鎖定帶來的經濟影響
- 產業價值鏈分析
- 監管環境
- 技術展望
- 波特五力分析
- 新進入者的威脅
- 買方的議價能力
- 供應商的議價能力
- 替代品的威脅
- 競爭對手之間的競爭
- 宏觀經濟影響評估
- 新興科技趨勢
第5章 市場規模與成長預測
- 按服務類型
- 資料建模與架構
- 資料整合和 ETL
- 數據品質與管治
- 進階分析和視覺化
- 按業務職能
- 行銷與銷售
- 金融
- 營運和供應鏈
- 人力資源
- 按組織規模
- 中小企業
- 主要企業
- 透過部署模式
- 雲
- 本地部署
- 混合
- 按地區
- 北美洲
- 南美洲
- 歐洲
- 亞太地區
- 中東和非洲
第6章 競爭情勢
- 市場集中度
- 策略趨勢
- 市佔率分析
- 公司簡介
- Accenture plc
- International Business Machines Corporation
- Cognizant Technology Solutions Corporation
- Capgemini SE
- Infosys Limited
- Tata Consultancy Services Limited
- Wipro Limited
- Deloitte Touche Tohmatsu Limited
- Ernst and Young Global Limited
- KPMG International Limited
- Genpact Limited
- NTT Data Corporation
- LandT Technology Services Limited
- Hexaware Technologies Limited
- Mphasis Limited
- Tech Mahindra Limited
- Atos SE
- SAP SE
- Amazon Web Services, Inc.
- Microsoft Corporation
- Google LLC
- Snowflake Inc.
- Teradata Corporation
- Palantir Technologies Inc.
- ThoughtWorks Holdings, Inc.
- Slalom, LLC
第7章 市場機會與未來展望
big data engineering services market size in 2026 is estimated at USD 105.39 billion, growing from 2025 value of USD 91.54 billion with 2031 projections showing USD 213.07 billion, growing at 15.12% CAGR over 2026-2031.
Continued adoption of AI-driven decision making, expansion of IoT endpoints, and the need to convert raw, unstructured information into reliable intelligence all fuel demand. Enterprises migrate workloads to elastic platforms that slash processing latency, while outcome-based service contracts accelerate time-to-value. At the same time, hybrid architectures gain traction as risk-averse organizations hedge against vendor lock-in and comply with tightening data-sovereignty rules. Meanwhile, automated data-pipeline tools temper talent shortages by reducing manual coding and maintenance overhead.
Global Big Data Engineering Services Market Trends and Insights
Proliferation of Unstructured IoT/Social Data Drives Service Demand
Industrial sensors, social platforms, and edge devices generate petabytes of raw records that traditional warehouses cannot absorb without latency spikes. Organizations in heavy-asset industries stream vibration, pressure, and environmental readings at millisecond intervals, yet limited schema flexibility keeps roughly 70% of those records dark. Service providers now deploy schema-on-read lakehouses that accept semi-structured payloads, perform inline parsing, and store data in columnar formats compatible with real-time analytics engines. Pre-built connectors for MQTT, OPC-UA, and common social APIs compress rollout times, while edge gateways process events locally to cut backhaul costs. These capabilities collectively transform uncontrolled data growth into exploitable insights that sharpen predictive maintenance, customer sentiment tracking, and supply-chain forecasting.
Cost-Efficient, Outcome-Based Service Contracts Transform Engagement Models
Procurement leaders increasingly reject billable-hour engagements in favor of performance milestones such as sub-100 ms query latency or 99.9% pipeline uptime. Under outcome agreements, penalty clauses kick in if KPIs slip, and bonus pools reward above-baseline service levels. Providers therefore automate testing, implement self-healing jobs, and deploy observability dashboards that flag anomalies before SLA breaches occur. CFOs endorse the model because it caps spend volatility, while vendors embrace it to deepen strategic ties and upsell continuous optimization workstreams. Early adopters report 20-30% operating-expense reduction versus time-and-materials contracts and faster executive buy-in when financial results tie directly to data-platform performance.
Acute Shortage of Data-Engineering Talent Constrains Growth
Vacancy rates remain high for specialists versed in streaming architectures, lakehouse optimization, and ML-driven orchestration. Senior engineers command 40-60% premium salaries versus traditional DBAs, driving operating costs higher for both providers and clients. To bridge gaps, vendors roll out bootcamps, certify offshore teams, and embed automation that shrinks manual workload. Yet complex, regulated deployments, especially in financial services and healthcare, still require hands-on expertise that automation cannot fully replace, slowing project timelines and limiting concurrent engagement capacity.
Other drivers and restraints analyzed in the detailed report include:
- Cloud-Native Big-Data Stack Adoption Accelerates Market Growth
- Regulatory Push for Data-Driven Decision Making
- Cyber-Security and Privacy Compliance Costs Escalate Project Complexity
For complete list of drivers and restraints, kindly check the Table Of Contents.
Segment Analysis
In 2025, data integration and ETL services held 31.21% share of the big data engineering services market, a position secured by enterprises that manage upward of 20 data sources and require rigorous consolidation. The segment's dominance owes much to real-time streaming architectures that synchronize transactional, sensor, and clickstream events into lakehouse repositories. Vendors deploy change-data-capture pipelines and schema evolution policies that sustain minute-level refresh cycles, satisfying dashboards that track inventory turns and fraud signals. As governance mandates tighten, demand rises for extended lineage, validation, and anomaly-repair routines embedded directly in ingestion jobs.
Advanced analytics and visualization is the fastest-expanding component at a 15.61% CAGR. Here, service providers bundle pre-configured notebooks, domain-specific feature stores, and responsive dashboards that convert raw observations into predictive or prescriptive guidance within days. Natural-language query layers democratize insight generation, empowering line-of-business staff to iterate hypotheses without SQL proficiency. Because analytics outcomes anchor outcome-based contracts, providers iterate aggressively on deployment playbooks to ensure sub-second rendering speeds for thousands of concurrent users. Together, integration and analytics remain symbiotic: clean, unified data feeds advanced models that, in turn, surface performance gains justifying continual platform investment.
Finance offices accounted for 29.14% of 2025 spending, reflecting deep roots in regulatory reporting, liquidity risk computation, and revenue forecasting. Workloads include multi-currency aggregation, intraday P&L, and stress-testing engines that must remain audit-ready. Providers therefore emphasize deterministic calculations, immutable ledgers, and automated reconciliation against external clearinghouses. Even so, finance footprints increasingly extend to continuous intelligence dashboards that alert treasuries on shifting yield curves or capital-ratio thresholds.
Marketing and sales pipelines, growing at a 15.49% CAGR, tap behavioral signals to craft hyper-personalized campaigns delivered in near real time. Customer 360 architectures fuse web browsing, point-of-sale, and customer-service transcripts to advise next-best-offer engines. Intelligent routing models select optimal channels, creative, and timing, improving conversion by double-digit percentages. Service firms embed experimentation frameworks that A/B test algorithmic tweaks and feed uplift metrics into automated budget allocation. As privacy regulations restrict third-party cookies, first-party data platforms emerge as strategic assets, further amplifying engineering demand in go-to-market functions.
The Big Data Engineering Services Market Report is Segmented by Service Type (Data Modelling and Architecture, Data Integration and ETL, and More), Business Function (Marketing and Sales, Finance, and More), Organization Size (Small and Medium Enterprises and Large Enterprises), Deployment Mode (Cloud, On-Premises, and Hybrid), and Geography. The Market Forecasts are Provided in Terms of Value (USD).
Geography Analysis
North America led with 39.18% revenue in 2025, underpinned by established cloud infrastructure, early AI adoption, and stringent legislation that necessitates sophisticated governance. Financial-services firms refine anti-money-laundering models in real time, while healthcare networks orchestrate precision-medicine workflows on HIPAA-compliant clusters. Venture funding channels steady capital into data-platform startups, which in turn spur service engagements for architecture hardening and go-to-market scaling.
Asia Pacific is projected to outpace other regions at a 15.74% CAGR through 2031. Governments sponsor smart-manufacturing zones, 5G rollouts, and digital-banking licenses that spawn data volumes demanding advanced engineering. Chinese and Indian e-commerce giants ingest billions of clickstream events daily, catalyzing regional benchmarks for exabyte-scale lakehouses. Manufacturing hubs retrofit assembly lines with IIoT sensors, necessitating edge-cloud pipelines that compress latency while meeting nascent data-localization statutes.
Europe shows steady uptake as GDPR and forthcoming AI-governance acts compel organizations to embed privacy-by-design controls. Automotive and industrial conglomerates pilot digital-twin initiatives, integrating telemetry, maintenance logs, and supplier data to sharpen throughput and cut downtime. Middle East and Africa, while still emerging, channel oil-and-gas modernization budgets and smart-city consortiums into foundational data layers. High-bandwidth subsea cables and regional cloud zones lower entry barriers, signaling potential for sustained, if selective, growth.
- Accenture plc
- International Business Machines Corporation
- Cognizant Technology Solutions Corporation
- Capgemini SE
- Infosys Limited
- Tata Consultancy Services Limited
- Wipro Limited
- Deloitte Touche Tohmatsu Limited
- Ernst and Young Global Limited
- KPMG International Limited
- Genpact Limited
- NTT Data Corporation
- LandT Technology Services Limited
- Hexaware Technologies Limited
- Mphasis Limited
- Tech Mahindra Limited
- Atos SE
- SAP SE
- Amazon Web Services, Inc.
- Microsoft Corporation
- Google LLC
- Snowflake Inc.
- Teradata Corporation
- Palantir Technologies Inc.
- ThoughtWorks Holdings, Inc.
- Slalom, LLC
Additional Benefits:
- The market estimate (ME) sheet in Excel format
- 3 months of analyst support
TABLE OF CONTENTS
1 INTRODUCTION
- 1.1 Study Assumptions and Market Definition
- 1.2 Scope of the Study
2 RESEARCH METHODOLOGY
3 EXECUTIVE SUMMARY
4 MARKET LANDSCAPE
- 4.1 Market Overview
- 4.2 Market Drivers
- 4.2.1 Proliferation of unstructured IoT/social data
- 4.2.2 Cost-efficient, outcome-based service contracts
- 4.2.3 Cloud-native big-data stack adoption
- 4.2.4 Regulatory push for data-driven decision-making
- 4.2.5 Rise of AI-automated data-pipelines
- 4.2.6 Industry-specific data marketplaces
- 4.3 Market Restraints
- 4.3.1 Acute shortage of data-engineering talent
- 4.3.2 Cyber-security and privacy compliance costs
- 4.3.3 Legacy system integration complexity
- 4.3.4 Cloud-egress and vendor-lock-in economics
- 4.4 Industry Value Chain Analysis
- 4.5 Regulatory Landscape
- 4.6 Technological Outlook
- 4.7 Porter's Five Forces Analysis
- 4.7.1 Threat of New Entrants
- 4.7.2 Bargaining Power of Buyers
- 4.7.3 Bargaining Power of Suppliers
- 4.7.4 Threat of Substitutes
- 4.7.5 Competitive Rivalry
- 4.8 Macroeconomic Impact Assessment
- 4.9 Emerging Technology Trends
5 MARKET SIZE AND GROWTH FORECASTS (VALUE)
- 5.1 By Service Type
- 5.1.1 Data Modelling and Architecture
- 5.1.2 Data Integration and ETL
- 5.1.3 Data Quality and Governance
- 5.1.4 Advanced Analytics and Visualization
- 5.2 By Business Function
- 5.2.1 Marketing and Sales
- 5.2.2 Finance
- 5.2.3 Operations and Supply-Chain
- 5.2.4 Human Resources
- 5.3 By Organization Size
- 5.3.1 Small and Medium Enterprises (SMEs)
- 5.3.2 Large Enterprises
- 5.4 By Deployment Mode
- 5.4.1 Cloud
- 5.4.2 On-premises
- 5.4.3 Hybrid
- 5.5 By Geography
- 5.5.1 North America
- 5.5.2 South America
- 5.5.3 Europe
- 5.5.4 Asia Pacific
- 5.5.5 Middle East and Africa
6 COMPETITIVE LANDSCAPE
- 6.1 Market Concentration
- 6.2 Strategic Moves
- 6.3 Market Share Analysis
- 6.4 Company Profiles (includes Global-level Overview, Market-level Overview, Core Segments, Financials as available, Strategic Information, Market Rank/Share, Products and Services, Recent Developments)
- 6.4.1 Accenture plc
- 6.4.2 International Business Machines Corporation
- 6.4.3 Cognizant Technology Solutions Corporation
- 6.4.4 Capgemini SE
- 6.4.5 Infosys Limited
- 6.4.6 Tata Consultancy Services Limited
- 6.4.7 Wipro Limited
- 6.4.8 Deloitte Touche Tohmatsu Limited
- 6.4.9 Ernst and Young Global Limited
- 6.4.10 KPMG International Limited
- 6.4.11 Genpact Limited
- 6.4.12 NTT Data Corporation
- 6.4.13 LandT Technology Services Limited
- 6.4.14 Hexaware Technologies Limited
- 6.4.15 Mphasis Limited
- 6.4.16 Tech Mahindra Limited
- 6.4.17 Atos SE
- 6.4.18 SAP SE
- 6.4.19 Amazon Web Services, Inc.
- 6.4.20 Microsoft Corporation
- 6.4.21 Google LLC
- 6.4.22 Snowflake Inc.
- 6.4.23 Teradata Corporation
- 6.4.24 Palantir Technologies Inc.
- 6.4.25 ThoughtWorks Holdings, Inc.
- 6.4.26 Slalom, LLC
7 MARKET OPPORTUNITIES AND FUTURE OUTLOOK
- 7.1 White-space and Unmet-need Assessment
 2026年全球資料轉換電路市場報告
 石油天然氣巨量資料市場-全球產業規模、佔有率、趨勢、機會與預測:按組件、應用、資料類型、地區和競爭對手分類,2021-2031年
 巨量資料技術市場預測至2034年-按解決方案、服務、部署類型、組織規模、應用、最終用戶和地區分類的全球分析
 巨量資料儲存市場:按組件、產業和地區分類
 巨量資料和商業分析市場:2026 年至 2032 年全球市場預測,按組件、資料類型、部署模型、組織規模、應用和產業分類。2026年全球資料轉換服務市場報告巨量資料市場:按元件、資料類型、部署模式、應用程式、產業和組織規模分類-2026-2032年全球市場預測2026年全球行動數據市場報告2026年建築業SaaS(軟體即服務)全球市場報告巨量資料SaaS市場:按組件、部署模式、產業和應用分類-2026年至2032年全球市場預測