


 |
市場調查報告書
商品編碼
1940663
系統整合商:市場佔有率分析、產業趨勢與統計資料、成長預測(2026-2031 年)System Integrators - Market Share Analysis, Industry Trends & Statistics, Growth Forecasts (2026 - 2031) |
||||||
※ 本網頁內容可能與最新版本有所差異。詳細情況請與我們聯繫。
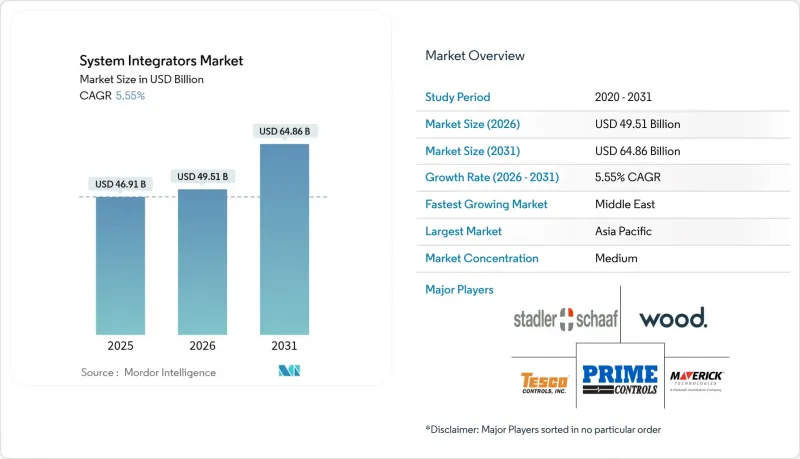
2025年系統整合商市場價值為469.1億美元,預計到2031年將達到648.6億美元,高於2026年的495.1億美元。
預計在預測期(2026-2031 年)內,複合年成長率將達到 5.55%。
製造商從獨立昇級轉向承包OT-IT融合計劃,推動了這一成長,此類項目縮短了投資回收期並最大限度地減少了生產停機時間。現有工廠(棕地)正在獲得越來越多的新訂單,而由私有5G網路支援的多廠商邊緣部署正在創造對先進編配技術的新需求。同時,歐洲和亞洲的公共產業正在對其可再生能源資產數位化,以實現雄心勃勃的清潔能源目標。這種轉變有利於精通SCADA(監控與資料採集)系統升級和分散式能源(DER)管理的整合商。中東地區針對關鍵基礎設施的嚴格網路安全法規正在擴大利潤豐厚的SCADA維修計劃的潛在市場。工廠人才短缺正促使企業將內部開發和採購決策轉向外包,這使得中型企業能夠從大型自動化供應商手中奪取市場佔有率。
全球系統整合商市場趨勢與洞察
現有製造工廠對承包OT-IT整合計劃的需求
隨著製造商將投資回報週期縮短至18個月以內,承包OT-IT整合方案正在取代漸進式升級。將使用了數十年的PLC映射到現代雲端架構的挑戰,使得能夠從單一層面管理共存管理、網路安全和分析的整合商的需求持續成長。流程工業感受到的壓力最大,因為一小時的非計劃性停機可能會造成超過5萬美元的生產損失。
加速歐洲和亞洲可再生能源資產的數位化
到2030年,歐洲公用事業公司需要整合約900吉瓦的太陽能發電容量,要實現這一目標,需要預測、儲能和併網應用之間密切合作。橫河電機的BaxEnergy平台已在40個國家監測120吉瓦的可再生能源,展現了下一代計劃的規模和複雜性。
計劃範圍擴大的風險增加會推高最終用戶的總擁有成本。
超過40%的整合專案超出了最初的預算,原因是工程師在計劃進行過程中遇到了未記錄的介面和過時的韌體。美國政府審核局(GAO)的一項研究發現,第一類技術計劃仍然佔聯邦預算超支的81%,這凸顯了即使在嚴格的管治下,項目範圍仍然持續偏離預算。
細分市場分析
截至2025年,軟體和數位整合將佔系統整合商市場的47.35%,這主要得益於分析、MES和雲端邊緣整合套件的優勢。隨著企業在機器層面採用容器化工作負載,工業物聯網(IIoT)和邊緣運算整合到2031年將以8.75%的複合年成長率成長。雖然棕地硬體維修仍然很重要,但隨著製造商尋求數據而非純粹的處理能力來獲利,其佔有率正在逐漸下降。由於人才短缺迫使企業提升內部員工的技能,諮詢和培訓需求正在復甦。同時,售後服務支援提供了持續的收入來源,緩解了計劃週期性波動的影響。 Litmus Edge與Azure IoT的合作標誌著向OPC UA和MQTT等標準化連接器的轉變,這些連接器能夠加快部署速度。
第二個結構性變化是專有整合平台的興起,這些平台整合了中間件、預先建置的API和數位雙胞胎庫。這些服務使整合商能夠將其智慧財產權貨幣化,而不僅僅是按小時收取工程費,從而提高了轉換成本。隨著越來越多的製造商傾向於基於結果的基本契約,到本十年末,軟體密集型工作範圍將佔系統整合商市場佔有率的55%以上。
到2025年,整合製程控制解決方案(PLC、DCS、SCADA)將佔據系統整合商市場佔有率的34.02%,這顯示底層控制層仍是數位轉型藍圖的核心。然而,隨著勒索軟體從IT領域轉向OT領域,工業網路安全解決方案將以10.05%的複合年成長率成長,超過所有其他垂直領域。隨著經營團隊需要整合生產和營運數據以進行利潤中心核算,製造執行系統(MES)將繼續穩定成長。在人事費用超過資本折舊免稅額的地區,機器人和機器視覺計劃正在蓬勃發展。
網路安全發展日趨加速,羅克韋爾收購Verve Industrial Protection便是明證。此次收購將資產清單、風險評分和入侵回應整合到一個廠商中立的平台中。西門子也順應了這一趨勢,推出了SIBERprotect解決方案,可在毫秒內實現自動回應,兼顧運作和安全性。隨著監管力道的加大,將零信任架構融入製程控制轉型中的整合商將獲得更高的溢價。
區域分析
亞太地區在系統整合商市場中佔據領先地位,預計到2025年將達到31.20%的市場佔有率,這主要得益於中國對價格高度敏感的自動化市場環境以及印度不斷成長的乙醇熱電汽電共生規模。像Ditap-V Automation這樣的本土競爭對手憑藉著品質與價格的平衡優勢贏得競標,給跨國巨頭帶來了更大的壓力。政府主導的智慧製造計畫正在推動市場需求,而地緣政治摩擦和運輸瓶頸則威脅交付時間。
中東是成長最快的地區,預計到2031年將維持8.46%的複合年成長率。 「2030願景」大型企劃和不斷擴展的營運技術(OT)網路安全法規正在推高計劃平均價值。艾默生位於薩勒曼國王能源園區的14萬平方英尺製造地,展現了全球供應商如何實現價值鏈本地化,以滿足當地價值標準。同時,一旦運作,印度-中東-歐洲經濟走廊可望降低30%的運輸成本,這將進一步刺激對熟悉跨境標準的整合商的需求。
北美和歐洲仍然是盈利但趨於成熟的市場。在美國,私有5G和邊緣人工智慧試點計畫發展迅猛,但長期存在的勞動力短缺推高了人事費用。在歐洲,可再生能源的大力發展迫使電力公司將電網級電池儲能、太陽能逆變器和需量反應軟體整合到系統中,而這種整合挑戰也催生了大量的計劃儲備。在這兩個地區,嚴格的安全標準導致核准週期較長,凸顯了專業整合商的價值。
其他福利:
- Excel格式的市場預測(ME)表
- 分析師支持(3個月)
目錄
第1章 引言
- 研究假設和市場定義
- 調查範圍
第2章調查方法
第3章執行摘要
第4章 市場情勢
- 市場概覽
- 市場促進因素
- 承包OT-IT融合計劃的需求
- 加速可再生能源資產的數位化
- 5G邊緣運算用例
- 監理機關推動SCADA網路安全維修
- 模組化自動化技術的廣泛應用
- 工廠自動化人員短缺
- 市場限制
- 計劃範圍擴張風險較高
- 採購延誤
- 分散的供應商生態系統
- 重大法律責任風險
- 價值/供應鏈分析
- 監理與技術展望
- 波特五力模型
- 買方的議價能力
- 供應商的議價能力
- 新進入者的威脅
- 替代品的威脅
- 競爭對手之間的競爭
第5章 市場規模與成長預測
- 按服務類型
- 硬體整合
- 軟體和數位整合
- 諮詢和培訓
- 售後服務及維護
- 透過技術
- 整合製程控制(PLC、DCS、SCADA)
- 製造執行系統(MES)
- 機器人與機器視覺
- 工業物聯網與邊緣平台
- 網路安全解決方案
- 按最終用戶行業分類
- 石油和天然氣
- 汽車和電動車 (EV) 製造
- 航太/國防
- 醫療保健和生命科學
- 能源與電力
- 化工/石油化工
- 食品/飲料
- 金屬和採礦
- 其他(水/污水、紙漿和造紙)
- 按公司規模
- 小型企業
- 主要企業
- 按地區
- 北美洲
- 美國
- 加拿大
- 拉丁美洲
- 墨西哥
- 巴西
- 阿根廷
- 其他拉丁美洲地區
- 歐洲
- 德國
- 英國
- 法國
- 義大利
- 西班牙
- 其他歐洲地區
- 中東和非洲
- 亞太地區
- 中國
- 日本
- 韓國
- 印度
- 澳洲
- 亞太其他地區
- 北美洲
第6章 競爭情勢
- 市場集中度
- 策略趨勢
- 市佔率分析
- 公司簡介
- ABB Ltd.
- Siemens AG
- Rockwell Automation, Inc.
- Schneider Electric SE
- Honeywell International Inc.
- Emerson Electric Co.
- Yokogawa Electric Corporation
- John Wood Group PLC
- TESCO CONTROLS, Inc.
- STADLER+SCHAAF Mess-und Regeltechnik GmbH
- Prime Controls, LP
- MAVERICK Technologies, LLC
- Adsyst Automation Ltd.
- George T. Hall Company
- Avanceon Ltd.
- Wunderlich-Malec Engineering, Inc.
- Burrow Global, LLC
- ATS Corporation
- HCLTech(Industrial and Digital SI Practice)
- Accenture plc(Industry X)
第7章 市場機會與未來展望
The system integrators market was valued at USD 46.91 billion in 2025 and estimated to grow from USD 49.51 billion in 2026 to reach USD 64.86 billion by 2031, at a CAGR of 5.55% during the forecast period (2026-2031).
Expansion is underpinned by manufacturers shifting from isolated upgrades to turnkey OT-IT convergence projects that shorten payback periods while minimizing production downtime. Brownfield plants account for a rising share of new awards, and multi-vendor edge deployments anchored in private-5G are unlocking fresh demand for advanced orchestration skills. At the same time, utilities in Europe and Asia are digitizing renewable assets to comply with aggressive clean-energy targets, a change that favors integrators fluent in SCADA upgrades and DER management. Regulatory cybersecurity mandates for critical infrastructure, most visibly in the Middle East, are widening the addressable pool of high-margin SCADA retrofit projects. Talent shortages on the plant floor further tilt the build-versus-buy calculus toward outsourcing, enabling mid-tier firms to capture share from large automation vendors.
Global System Integrators Market Trends and Insights
Demand for Turn-Key OT-IT Convergence Projects in Brownfield Manufacturing Plants
Turn-key OT-IT programs are replacing incremental upgrades because manufacturers now target ROI cycles below 18 months. The challenge of mapping decades-old PLCs to modern cloud architectures creates enduring demand for integrators able to manage coexistence, cybersecurity and analytics in one scope. Process industries feel this pressure most acutely, since one hour of unplanned downtime can exceed USD 50,000 in lost output.
Acceleration of Renewable-Energy Asset Digitalization Across Europe and Asia
European utilities must orchestrate nearly 900 GW of solar capacity by 2030, a milestone that compels tighter coupling of forecasting, storage and grid-balancing applications. The BaxEnergy platform, now owned by Yokogawa, already monitors 120 GW of renewables across 40 countries, illustrating the scale and complexity of next-gen projects.
High Project Scope-Creep Risk Elevating Total Cost of Ownership for End-Users
More than 40% of integration programs overshoot original budgets as engineers confront undocumented interfaces and obsolete firmware mid-project. The U.S. Government Accountability Office found that Category 1 technology projects still account for 81% of federal overruns, underscoring how scope drift persists even under strict governance.
Other drivers and restraints analyzed in the detailed report include:
- 5G-Enabled Edge Computing Use-Cases Requiring Complex Multi-Vendor Integration in North America
- Regulatory Push for Cyber-Secure SCADA Retrofits in Critical Infrastructure (Middle East)
- Procurement Delays Caused by Semiconductor Supply Constraints
For complete list of drivers and restraints, kindly check the Table Of Contents.
Segment Analysis
Software and Digital Integration controlled 47.35% of system integrators market size in 2025 on the strength of analytics, MES and cloud-edge orchestration suites. IIoT and Edge-Focused Integration posts a 8.75% CAGR to 2031 as firms deploy containerized workloads at the machine level. Hardware retrofits remain vital for brownfield sites, but their share is gradually receding as manufacturers monetize data rather than pure throughput. Consulting and Training demand is reviving because talent gaps force companies to upskill in-house staff, while After-Sales Support secures recurring revenue that cushions cyclical project flow. The Litmus Edge-Azure IoT tie-up typifies the pivot toward standardized connectors like OPC UA and MQTT that cut roll-out times.
A second structural change is the rise of proprietary integration platforms that bundle middleware, pre-built APIs and digital-twin libraries. These services allow integrators to monetize intellectual property beyond hourly engineering fees, increasing switching costs. As more manufacturers favor outcome-based contracts, software-heavy scopes will likely surpass 55% share of the system integrators market by decade-end.
Integrated Process Control solutions-PLC, DCS and SCADA-accounted for 34.02% of system integrators market share in 2025, evidence that foundational control layers still anchor digital transformation roadmaps. Even so, Industrial Cyber-Security Solutions outpace every other cluster at a 10.05% CAGR as ransomware moves from IT to OT domains. Manufacturing Execution Systems keep growing steadily because executives need unified production and business data to run profit-center accounting. Robotics and Machine Vision projects gain traction where labor costs outstrip capex depreciation curves.
Cybersecurity's acceleration is visible in Rockwell's acquisition of Verve Industrial Protection, which unified asset inventory, risk scoring and breach response in a vendor-neutral stack. Siemens echoed this trend with its SIBERprotect solution that triggers automated responses within milliseconds, balancing uptime and safety. As regulations tighten, integrators that embed zero-trust architectures into process-control migrations are set to capture premium fees.
System Integrators Market Report is Segmented by Service Type (Hardware Integration, Software and Digital Integration, and More), Technology (Integrated Process Control, Manufacturing Execution Systems, and More), End-User Industry (Oil and Gas, Automotive and EV Manufacturing, and More), Enterprise Scale (SMEs, Large Enterprises), and Geography. The Market Forecasts are Provided in Terms of Value (USD).
Geography Analysis
Asia-Pacific led the system integrators market with 31.20% revenue in 2025, spurred by China's price-intensive automation landscape and India's expanding ethanol and co-gen base. Local competitors such as Ditap-V Automatio win bids by balancing quality and aggressive pricing, raising pressure on multinational incumbents. Government-sponsored smart-manufacturing schemes amplify demand, yet geopolitical frictions and shipping bottlenecks threaten delivery schedules.
The Middle East is the fastest-growing territory, forecast at 8.46% CAGR through 2031. Vision 2030 megaprojects and an expanding regulatory net for OT cybersecurity elevate average project values. Emerson's 140,000 ft2 manufacturing hub at King Salman Energy Park shows how global vendors localize supply chains to satisfy in-country value quotas. Meanwhile, the India-Middle East-Europe Economic Corridor could slash freight costs by 30% once operational, creating further pull for integrators versed in cross-border standards.
North America and Europe remain lucrative but mature. The U.S. sees outsized growth from private-5G and edge-AI pilots, yet chronic labor shortages inflate wage bills. Europe's renewable push forces utilities to blend grid-scale batteries, PV inverters and demand-response software in coherent stacks, an integration puzzle that sustains robust project pipelines. Both regions confront stringent safety codes that lengthen approval cycles, underscoring the value of domain-rich integrators.
- ABB Ltd.
- Siemens AG
- Rockwell Automation, Inc.
- Schneider Electric SE
- Honeywell International Inc.
- Emerson Electric Co.
- Yokogawa Electric Corporation
- John Wood Group PLC
- TESCO CONTROLS, Inc.
- STADLER + SCHAAF Mess- und Regeltechnik GmbH
- Prime Controls, LP
- MAVERICK Technologies, LLC
- Adsyst Automation Ltd.
- George T. Hall Company
- Avanceon Ltd.
- Wunderlich-Malec Engineering, Inc.
- Burrow Global, LLC
- ATS Corporation
- HCLTech (Industrial and Digital SI Practice)
- Accenture plc (Industry X)
Additional Benefits:
- The market estimate (ME) sheet in Excel format
- 3 months of analyst support
TABLE OF CONTENTS
1 INTRODUCTION
- 1.1 Study Assumptions and Market Definition
- 1.2 Scope of the Study
2 RESEARCH METHODOLOGY
3 EXECUTIVE SUMMARY
4 MARKET LANDSCAPE
- 4.1 Market Overview
- 4.2 Market Drivers
- 4.2.1 Demand for Turn-Key OT-IT Convergence Projects
- 4.2.2 Acceleration of Renewable-Energy Asset Digitalization
- 4.2.3 5G-Enabled Edge Computing Use-Cases
- 4.2.4 Regulatory Push for Cyber-Secure SCADA Retrofits
- 4.2.5 Rising Adoption of Modular Automation
- 4.2.6 Shortage of Plant-Floor Automation Talent
- 4.3 Market Restraints
- 4.3.1 High Project Scope-Creep Risk
- 4.3.2 Procurement Delays
- 4.3.3 Fragmented Vendor Ecosystem
- 4.3.4 Critical Liability Exposure
- 4.4 Value / Supply-Chain Analysis
- 4.5 Regulatory and Technological Outlook
- 4.6 Porter's Five Forces
- 4.6.1 Bargaining Power of Buyers
- 4.6.2 Bargaining Power of Suppliers
- 4.6.3 Threat of New Entrants
- 4.6.4 Threat of Substitutes
- 4.6.5 Intensity of Competitive Rivalry
5 MARKET SIZE AND GROWTH FORECASTS (VALUE)
- 5.1 By Service Type
- 5.1.1 Hardware Integration
- 5.1.2 Software and Digital Integration
- 5.1.3 Consulting and Training
- 5.1.4 After-Sales Support and Maintenance
- 5.2 By Technology
- 5.2.1 Integrated Process Control (PLC, DCS, SCADA)
- 5.2.2 Manufacturing Execution Systems (MES)
- 5.2.3 Robotics and Machine Vision
- 5.2.4 IIoT and Edge Platforms
- 5.2.5 Cyber-Security Solutions
- 5.3 By End-User Industry
- 5.3.1 Oil and Gas
- 5.3.2 Automotive and EV Manufacturing
- 5.3.3 Aerospace and Defense
- 5.3.4 Healthcare and Life Sciences
- 5.3.5 Energy and Power
- 5.3.6 Chemicals and Petrochemicals
- 5.3.7 Food and Beverage
- 5.3.8 Metals and Mining
- 5.3.9 Others (Water / Waste-Water, Pulp and Paper)
- 5.4 By Enterprise Scale
- 5.4.1 SMEs
- 5.4.2 Large Enterprises
- 5.5 By Geography
- 5.5.1 North America
- 5.5.1.1 United States
- 5.5.1.2 Canada
- 5.5.2 Latin America
- 5.5.2.1 Mexico
- 5.5.2.2 Brazil
- 5.5.2.3 Argentina
- 5.5.2.4 Rest of Latin America
- 5.5.3 Europe
- 5.5.3.1 Germany
- 5.5.3.2 United Kingdom
- 5.5.3.3 France
- 5.5.3.4 Italy
- 5.5.3.5 Spain
- 5.5.3.6 Rest of Europe
- 5.5.4 Middle East and Africa
- 5.5.5 Asia-Pacific
- 5.5.5.1 China
- 5.5.5.2 Japan
- 5.5.5.3 South Korea
- 5.5.5.4 India
- 5.5.5.5 Australia
- 5.5.5.6 Rest of Asia Pacific
- 5.5.1 North America
6 COMPETITIVE LANDSCAPE
- 6.1 Market Concentration
- 6.2 Strategic Moves
- 6.3 Market Share Analysis
- 6.4 Company Profiles (includes Global?level Overview, Market level Overview, Core Segments, Financials as available, Strategic Information, Market Rank/Share for key companies, Products and Services, Recent Developments)
- 6.4.1 ABB Ltd.
- 6.4.2 Siemens AG
- 6.4.3 Rockwell Automation, Inc.
- 6.4.4 Schneider Electric SE
- 6.4.5 Honeywell International Inc.
- 6.4.6 Emerson Electric Co.
- 6.4.7 Yokogawa Electric Corporation
- 6.4.8 John Wood Group PLC
- 6.4.9 TESCO CONTROLS, Inc.
- 6.4.10 STADLER + SCHAAF Mess- und Regeltechnik GmbH
- 6.4.11 Prime Controls, LP
- 6.4.12 MAVERICK Technologies, LLC
- 6.4.13 Adsyst Automation Ltd.
- 6.4.14 George T. Hall Company
- 6.4.15 Avanceon Ltd.
- 6.4.16 Wunderlich-Malec Engineering, Inc.
- 6.4.17 Burrow Global, LLC
- 6.4.18 ATS Corporation
- 6.4.19 HCLTech (Industrial and Digital SI Practice)
- 6.4.20 Accenture plc (Industry X)
7 MARKET OPPORTUNITIES AND FUTURE OUTLOOK
- 7.1 White-Space and Unmet-Need Assessment
 系統整合商服務市場:2026-2032年全球市場預測(依服務類型、整合模型、部署模型、組織規模及最終用戶產業分類)
 2026年全球工業自動化系統整合商市場報告SAP S4 系統整合商服務全球市場報告(2026 年)2026年全球系統整合商市場報告
 工業自動化系統整合商市場規模、佔有率和成長分析(按系統整合商類型、服務、專業領域、公司規模、產業和地區分類)-2026年至2033年產業預測
 系統整合商市場分析及預測(至2035年):按類型、產品、服務、技術、組件、應用、流程、部署、最終用戶及解決方案分類
 系統整合商市場規模、佔有率和成長分析(按產品、技術、最終用戶產業和地區分類)-2026-2033年產業預測
 2032 年工業自動化系統整合商市場預測:按服務類型、組件、技術、應用、最終用戶和地區進行的全球分析
 全球工業自動化系統整合商市場規模(按服務、產業、地區和預測):
 系統整合商市場規模、佔有率、趨勢分析報告:按類型、公司規模、產業、地區和細分市場預測,2024-2030 年