


 |
市場調查報告書
商品編碼
1940654
教育領域的虛擬實境:市場佔有率分析、產業趨勢與統計、成長預測(2026-2031)Virtual Reality In Education - Market Share Analysis, Industry Trends & Statistics, Growth Forecasts (2026 - 2031) |
||||||
※ 本網頁內容可能與最新版本有所差異。詳細情況請與我們聯繫。
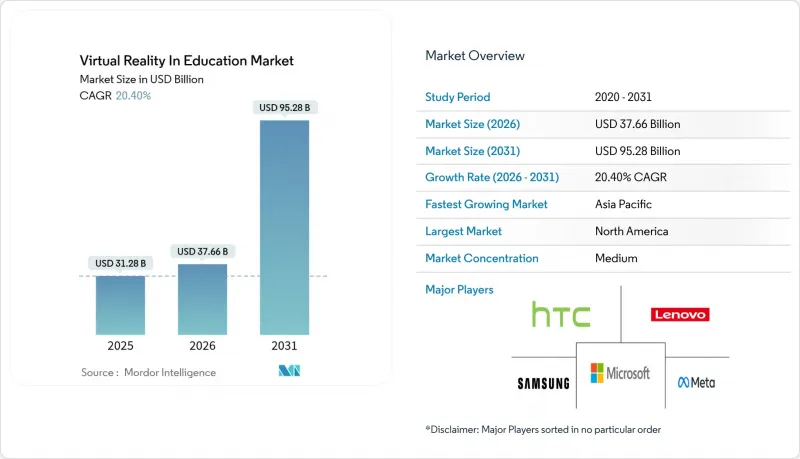
2025年,虛擬實境在教育領域的市值為312.8億美元,預計2031年將達到952.8億美元,高於2026年的376.6億美元。
預計在預測期(2026-2031 年)內,複合年成長率將達到 20.4%。
頭戴式設備價格下降、政府津貼力度加大以及學習者學習效果的顯著提升,持續推動虛擬實境教育市場的成長。尤其值得一提的是,企業正在積極採用身臨其境型培訓項目,預計這些項目可將學習時間縮短高達75%,同時將知識保留率提高四倍。儘管硬體仍佔據收入的大部分,但隨著教育機構尋求承包內容和分析功能,以服務為導向的訂閱套餐成長最為迅猛。在拜登-哈里斯政府2.77億美元創新基金的領先下,北美地區的採用率遙遙領先;而亞太地區則在中國和日本基礎建設規劃的推動下加速發展。市場競爭較為激烈,Meta和微軟等主流平台與zSpace和Labster等專注於提供與課程相契合的內容和經濟高效部署模式的專業公司競爭。
全球教育領域虛擬實境市場趨勢與洞察
互動式和個人化學習的需求日益成長
教育機構越來越重視身臨其境型學習的價值,而這種學習方式能夠適應不同的學習風格。研究表明,VR學習者的自信心提升了275%,完成課程的速度是傳統課堂學習者的四倍。大學已經發現,目前的VR課程缺乏設計思考技能,這為那些將技術嚴謹性與教學方法結合的供應商創造了機會。人工智慧驅動的引擎能夠為每位學習者最佳化學習內容,例如zSpace的職業教練AI,它將本地勞動力市場數據與學習者的職業發展路徑聯繫起來。可控制的虛擬環境能夠減輕情緒障礙學生的焦慮,並提高他們的學習效率。隨著以學習者為中心的學習模式逐漸成為主流,虛擬實境技術正成為教育機構提升學習成果的核心基礎設施。
透過提高參與度來獲得更高的相關人員認可
可量化的結果能夠同時說服管理者、家長和企業發展領導者。護理專業的學生在虛擬實境(VR)場景下的參與率高達95%,而傳統實驗室的參與率僅15%。製造業在實施VR安全訓練後,職場減少了43%。在數學課堂上,與能夠闡明抽象概念的3D物件互動,大大提高了課堂參與度。 Meta與13所大學合作的計畫展現了強大的教育信譽,並創造了鼓勵其他機構採用的模式。這些成果正在教育領域的VR市場中形成投資與接受的良性循環。
缺乏高品質的與課程相關的虛擬實境內容
許多應用優先考慮娛樂性而非教育效果,導致相關人員缺乏符合學習標準的資源,尤其是在非英語市場。教師難以找到融合評量工具和建構主義教學方法的虛擬實境模組,儘管硬體供應充足,但虛擬實境技術的普及仍然受到阻礙。醫療等專業領域需要符合監管要求,但經過檢驗的案例仍然稀缺。像 Pearson XR Bootcamps 這樣的夥伴關係展現了初步進展,但仍不足以滿足全球需求。在內容庫擴充之前,虛擬實境教育市場的發展將落後於底層硬體的效能。
細分市場分析
截至2025年,硬體將佔據教育VR市場佔有率的60.72%,這主要得益於學校和培訓中心的設備部署。然而,服務領域預計將以22.2%的複合年成長率成長,因為教育機構更傾向於將內容、設備管理和分析功能整合到訂閱套餐中的模式。預計到2031年,教育VR服務市場的規模將超過軟體收入。雖然獨立頭戴裝置的親民價格將維持對硬體的需求,但供應商已經開始提供永久更新服務並縮短更新週期。
訂閱模式降低了預算緊張的學區的資本支出門檻。 ArborXR進軍學習分析領域以及zSpace的AI驅動型指導工具,都顯示供應商正在將其硬體基礎架構轉型為可產生持續收入的生態系統。用於改進教學設計的培訓和諮詢服務如今已成為招標書的關鍵組成部分。這些趨勢預示著採購方式正向提案導向轉變,從而增強了整個虛擬實境產業的經常性收入來源。
學術機構仍佔教育領域虛擬實境(VR)應用的64.62%,這反映了中小學和大學等機構領先透過撥款津貼VR應用的情況。然而,企業培訓領域正以22.9%的複合年成長率成長,這主要得益於VR在安全、合規和客戶服務方面帶來的可衡量的投資回報率(ROI)。預計到2031年,企業教育領域的VR市場規模將與學術界持平。醫療保健和採礦業的公司在實施身臨其境型培訓專案後,錯誤率下降了40%以上,從而加快了投資回報週期。
企業正優先考慮軟性技能和產品知識模組,這推動了對快速內容創作工具和分析整合的需求。教育領域的成長仍在繼續,但預算週期和課程核准流程構成了一定的障礙。對供應商而言,提供能夠同時滿足這兩個領域需求的多元化產品組合,將有助於虛擬實境產業抵禦經濟波動的影響。
教育領域的虛擬實境市場按組件(硬體、軟體、服務)、最終用戶(學術機構、企業培訓)、設備類型(獨立式頭戴裝置、有線連接電腦的VR頭戴裝置等)、應用領域(STEM/技術教育、醫療/保健培訓等)和地區(北美等)進行細分。市場預測以以金額為準(美元)為單位。
區域分析
北美地區預計將佔2025年收入的38.95%,這主要得益於其強大的津貼計畫和成熟的教育科技(EdTech)生態系統。一項2.77億美元的政府創新津貼正在支持身臨其境型代數工具的開發,而國家科學基金會則投入2500萬美元用於研發和促進大學合作。企業對虛擬實境技術的應用正在擴展到醫療保健、零售和科技產業,例如Interplay Learning等公司正在擴展其虛擬實境模組以應對人才短缺問題。這些因素正在推動教育領域虛擬實境市場的強勁成長,但隨著普及率的提高,成長速度正在放緩。
預計到2031年,亞太地區將以21.5%的複合年成長率成為該地區虛擬實境技術發展最快的區域。光是2025年,中國各省預計就將為職業培訓虛擬實境實驗室計畫發布價值超過1500萬美元的競標;日本的「DX高中」計畫則為每個校園撥款高達1000萬日元,以促進數位化。韓國正在採用虛擬實境技術來降低技術培訓的資本成本,世界銀行的研究人員也強調了這個做法。隨著這些政策的協調一致加速課堂應用,亞太地區預計將在教育虛擬實境市場縮小與北美的差距。
在歐洲,數位歐洲計畫撥款13億歐元,並向包括虛擬世界課程在內的專業學院提供1.08億歐元的支持,這些措施正在產生正面影響。 ClassVR在蘇格蘭地方政府的推廣表明,區域機構正在積極推動系統化的採購。在南美和中東等新興市場,低於300美元的硬體價格正在推動虛擬實境技術的普及,但基礎設施的限制阻礙了即時廣泛應用。整體而言,政策的協調性和資金投入仍是預測虛擬實境教育市場區域發展趨勢的關鍵指標。
其他福利:
- Excel格式的市場預測(ME)表
- 3個月的分析師支持
目錄
第1章 引言
- 研究假設和市場定義
- 調查範圍
第2章調查方法
第3章執行摘要
第4章 市場情勢
- 市場概覽
- 市場促進因素
- 互動式和個人化學習的需求日益成長
- 透過提高相關人員的參與度,提高他們的接受度。
- 獨立VR頭戴裝置顯價格下降和廣泛普及
- 政府和機構對教育科技的資金籌措(後疫情時代)
- 將眼動追蹤分析整合到自適應虛擬實境中
- 採用 WebXR 標準可降低整體擁有成本
- 市場限制
- 缺乏高品質的與課程相關的虛擬實境內容
- 教育機構的初始安裝和維護成本較高
- 課堂中的生物識別資料隱私問題
- 教師培訓不足和教學阻力
- 監管環境
- 技術展望
- 產業價值鏈分析
- 波特五力分析
- 供應商的議價能力
- 消費者議價能力
- 新進入者的威脅
- 替代品的威脅
- 競爭對手之間的競爭
- 定價分析—VR應用分發與定價模型
- 主要用例和案例研究
- 中文課堂實施方案
- 為企業提供VR培訓以規範服務
- 虛擬實地考察(例如,Google探險)
- 對影響市場的宏觀經濟因素進行評估
- 投資分析
第5章 市場規模與成長預測
- 按組件
- 硬體
- 軟體
- 服務
- 最終用戶
- 學術機構
- K-12教育
- 高等教育
- 企業培訓
- 資訊科技和電信
- 衛生保健
- 零售與電子商務
- 其他企業用戶
- 學術機構
- 依設備類型
- 獨立式耳機
- 有線PC- VR頭戴裝置
- 智慧型手機相容的虛擬實境
- 混合實境頭戴式顯示器
- 按應用程式字段
- STEM(科學、技術、工程和數學)和技術教育
- 醫療衛生訓練
- 語言與藝術研究
- 專業和技術技能
- 軟性技能與團隊合作
- 按地區
- 北美洲
- 美國
- 加拿大
- 墨西哥
- 南美洲
- 巴西
- 阿根廷
- 南美洲其他地區
- 歐洲
- 德國
- 英國
- 法國
- 西班牙
- 其他歐洲地區
- 亞太地區
- 中國
- 印度
- 日本
- 韓國
- ASEAN
- 亞太其他地區
- 中東和非洲
- 中東
- 沙烏地阿拉伯
- 阿拉伯聯合大公國
- 土耳其
- 其他中東地區
- 非洲
- 南非
- 奈及利亞
- 肯亞
- 其他非洲地區
- 中東
- 北美洲
第6章 競爭情勢
- 市場集中度
- 策略趨勢
- 市佔率分析
- 公司簡介
- Meta Platforms, Inc.
- HTC Corporation
- Lenovo Group Limited
- Samsung Electronics Co., Ltd.
- Microsoft Corporation
- Sony Group Corporation
- Alphabet Inc.
- Pico Technology Co., Ltd.
- Valve Corporation
- Unity Technologies SF
- Epic Games, Inc.
- zSpace, Inc.
- EON Reality, Inc.
- Avantis Systems Ltd.
- Veative Labs Pvt. Ltd.
- Virtalis Holdings Limited
- Nearpod, Inc.
- Labster ApS
- Immerse VR Ltd.
- VictoryXR, Inc.
- Dreamscape Immersive, Inc.
- Alchemy Immersive Limited
第7章 市場機會與未來展望
The Virtual Reality In Education Market was valued at USD 31.28 billion in 2025 and estimated to grow from USD 37.66 billion in 2026 to reach USD 95.28 billion by 2031, at a CAGR of 20.4% during the forecast period (2026-2031).
Lower headset prices, sizable government grants, and measurable improvements in learner performance continue to propel the virtual reality in education market, especially as corporations adopt immersive training programs that reduce seat time by up to 75% while quadrupling knowledge retention. Hardware still supplies most revenue, but service-oriented subscription packages are expanding fastest as institutions seek turnkey content and analytics. North America leads the adoption due to the Biden-Harris Administration's USD 277 million innovation fund, whereas the Asia Pacific accelerates on the back of Chinese and Japanese infrastructure programs. Competitive rivalry is moderate, as large platforms such as Meta and Microsoft contend with specialists like zSpace and Labster, which pair curriculum-aligned content with cost-effective deployment models.
Global Virtual Reality In Education Market Trends and Insights
Rising Demand for Interactive and Personalized Learning
Institutions increasingly value immersive lessons that adapt to diverse learning styles, with studies showing VR learners achieve 275% higher confidence and complete courses four times faster than classroom cohorts. Universities highlight gaps in design-thinking skills within current VR curricula, opening opportunities for providers that combine technical rigor with pedagogy. AI-driven engines tailor content to each learner; zSpace's Career Coach AI, for instance, matches local labor-market data to personalized study pathways Controlled virtual environments also reduce anxiety for students with emotional impairments while boosting retention. As learner-centric models move mainstream, the virtual reality in education market becomes core infrastructure for institutions seeking improved outcomes.
Greater Stakeholder Acceptance from Higher Engagement
Quantified gains are persuading administrators, parents, and corporate L&D heads alike. Nursing programs see 95% participation when scenarios run in VR versus 15% in traditional labs. Manufacturing firms report 43% drops in workplace injuries after VR safety drills. Classroom engagement spikes in mathematics when students manipulate 3-D objects that clarify abstract concepts. Meta's program with 13 universities demonstrates institutional confidence, creating reference sites that spur peer adoption. These outcomes generate a virtuous cycle of investment and acceptance for the virtual reality in education market.
Scarcity of Quality Curriculum-Aligned VR Content
Many applications prioritize entertainment over pedagogy, leaving educators short of materials that match learning standards, especially outside English-speaking markets. Teachers struggle to locate VR modules that embed assessment tools and constructivist methods, hampering adoption despite hardware availability. Specialized domains such as medicine need regulatory compliance, yet the pipeline of validated scenarios remains thin. Partnerships like Pearson-XR Bootcamp illustrate early progress but are insufficient to satisfy global demand. Until content libraries scale, growth of the virtual reality in education market will trail underlying hardware capability.
Other drivers and restraints analyzed in the detailed report include:
- Falling Prices and Ubiquity of Standalone VR Headsets
- Government/Institutional EdTech Funding Post-Pandemic
- Teacher Training Gaps and Pedagogical Resistance
For complete list of drivers and restraints, kindly check the Table Of Contents.
Segment Analysis
Hardware captured 60.72% of the virtual reality in education market share in 2025 on the strength of device rollouts across schools and training centers. However, the services segment is on pace for 22.2% CAGR as institutions favor subscription bundles that bundle content, device management, and analytics. The virtual reality in education market size tied to services is poised to overtake software revenue approaching 2031. Standalone headset affordability keeps hardware relevant, yet platform vendors are already bundling perpetual updates, reducing replacement cycles.
Subscription models also mitigate capital-expenditure barriers for districts with limited budgets. ArborXR's shift into learning analytics and zSpace's AI-powered guidance tools illustrate how vendors convert hardware footholds into recurring-revenue ecosystems. Training and consulting services that improve instructional design now factor prominently in RFPs. These patterns signal a pivot toward outcomes-based procurement, reinforcing recurrent income streams across the virtual reality industry.
Academic institutions still own 64.62% of the virtual reality in education, reflecting early grant-funded pilots across K-12 and universities. Yet corporate training advances at 22.9% CAGR, propelled by measurable ROI in safety, compliance, and customer-service scenarios. The virtual reality in education market size attributable to enterprises is projected to approach parity with academia by 2031. Corporations in healthcare and mining have logged 40%-plus error reductions after immersive programs, shortening payback periods.
Enterprises champion soft-skills and product-knowledge modules, fueling demand for rapid-authoring tools and analytics integrations. Academic growth continues but faces budget cycles and curriculum-approval processes. For vendors, diversified portfolios that address both segments offer resilience against economic swings within the virtual reality industry.
Virtual Reality in Education Market is Segmented by Component (Hardware, Software, and Services), End User (Academic Institutions, and Corporate Training), Device Type (Standalone Headsets, Tethered PC-VR Headsets, and More), Application Area (STEM and Technical Education, Medical and Healthcare Training, and More), and Geography (North America, and More). The Market Forecasts are Provided in Terms of Value (USD).
Geography Analysis
North America retained 38.95% of 2025 revenue thanks to robust grant programs and a mature EdTech ecosystem. The Administration's USD 277 million innovation grants earmark immersive algebra tools, while the National Science Foundation commits USD 25 million to R&D, seeding university partnerships. Corporate uptake spans healthcare, retail, and skilled trades as companies such as Interplay Learning scale VR modules for talent shortages. These forces keep the virtual reality market in education expanding at a healthy clip, though growth moderates as penetration rises.
Asia Pacific is set to log the fastest regional CAGR of 21.5% through 2031. China's provinces issued tenders exceeding USD 15 million for vocational VR labs in 2025 alone, while Japan's DX High School scheme funds up to JPY 10 million per campus for digital upgrades. South Korean institutions deploy VR to cut equipment costs in technical training, an approach highlighted by World Bank researchers. These coordinated policies accelerate classroom integration, positioning Asia Pacific to narrow its gap with North America in the virtual reality in education market.
Europe benefits from the Digital Europe Programme's EUR 1.3 billion allocation and EUR 108 million for specialist academies that include virtual-worlds curricula. Scotland's council-wide ClassVR rollout shows regional bodies embracing systemic procurement. Emerging markets in South America and the Middle East follow as hardware prices dip below USD 300, though infrastructure constraints still curb immediate uptake. Overall, policy alignment and funding density remain the primary predictors of regional traction for the virtual reality in education market.
- Meta Platforms, Inc.
- HTC Corporation
- Lenovo Group Limited
- Samsung Electronics Co., Ltd.
- Microsoft Corporation
- Sony Group Corporation
- Alphabet Inc.
- Pico Technology Co., Ltd.
- Valve Corporation
- Unity Technologies SF
- Epic Games, Inc.
- zSpace, Inc.
- EON Reality, Inc.
- Avantis Systems Ltd.
- Veative Labs Pvt. Ltd.
- Virtalis Holdings Limited
- Nearpod, Inc.
- Labster ApS
- Immerse VR Ltd.
- VictoryXR, Inc.
- Dreamscape Immersive, Inc.
- Alchemy Immersive Limited
Additional Benefits:
- The market estimate (ME) sheet in Excel format
- 3 months of analyst support
TABLE OF CONTENTS
1 INTRODUCTION
- 1.1 Study Assumptions and Market Definition
- 1.2 Scope of the Study
2 RESEARCH METHODOLOGY
3 EXECUTIVE SUMMARY
4 MARKET LANDSCAPE
- 4.1 Market Overview
- 4.2 Market Drivers
- 4.2.1 Rising demand for interactive and personalized learning
- 4.2.2 Greater stakeholder acceptance from higher engagement
- 4.2.3 Falling prices and ubiquity of standalone VR headsets
- 4.2.4 Government/Institutional EdTech funding post-COVID
- 4.2.5 Integration of eye-tracking analytics for adaptive VR
- 4.2.6 WebXR standards lowering total cost of ownership
- 4.3 Market Restraints
- 4.3.1 Scarcity of quality curriculum-aligned VR content
- 4.3.2 High upfront and maintenance costs for institutions
- 4.3.3 Biometric data-privacy concerns in classrooms
- 4.3.4 Teacher training gaps and pedagogical resistance
- 4.4 Regulatory Landscape
- 4.5 Technological Outlook
- 4.6 Industry Value Chain Analysis
- 4.7 Porter's Five Forces Analysis
- 4.7.1 Bargaining Power of Suppliers
- 4.7.2 Bargaining Power of Consumers
- 4.7.3 Threat of New Entrants
- 4.7.4 Threat of Substitutes
- 4.7.5 Intensity of Competitive Rivalry
- 4.8 Pricing Analysis - VR App Distribution and Pricing Models
- 4.9 Key Use-Cases and Implementation Case Studies
- 4.9.1 China's classroom roll-out programmes
- 4.9.2 Corporate VR training for service standardisation
- 4.9.3 Virtual field trips (e.g., Google Expeditions)
- 4.10 Assessment of Macroeconomic Factors on the Market
- 4.11 Investment Analysis
5 MARKET SIZE AND GROWTH FORECASTS (VALUE)
- 5.1 By Component
- 5.1.1 Hardware
- 5.1.2 Software
- 5.1.3 Services
- 5.2 By End User
- 5.2.1 Academic Institutions
- 5.2.1.1 K-12 Learning
- 5.2.1.2 Higher Education
- 5.2.2 Corporate Training
- 5.2.2.1 IT and Telecom
- 5.2.2.2 Healthcare
- 5.2.2.3 Retail and E-commerce
- 5.2.2.4 Other Corporate Users
- 5.2.1 Academic Institutions
- 5.3 By Device Type
- 5.3.1 Standalone Headsets
- 5.3.2 Tethered PC-VR Headsets
- 5.3.3 Smartphone-Enabled VR
- 5.3.4 Mixed-Reality Head-Mounted Displays
- 5.4 By Application Area
- 5.4.1 STEM and Technical Education
- 5.4.2 Medical and Healthcare Training
- 5.4.3 Language and Arts Learning
- 5.4.4 Vocational and Technical Skills
- 5.4.5 Soft-Skills and Team Collaboration
- 5.5 By Geography
- 5.5.1 North America
- 5.5.1.1 United States
- 5.5.1.2 Canada
- 5.5.1.3 Mexico
- 5.5.2 South America
- 5.5.2.1 Brazil
- 5.5.2.2 Argentina
- 5.5.2.3 Rest of South America
- 5.5.3 Europe
- 5.5.3.1 Germany
- 5.5.3.2 United Kingdom
- 5.5.3.3 France
- 5.5.3.4 Spain
- 5.5.3.5 Rest of Europe
- 5.5.4 Asia-Pacific
- 5.5.4.1 China
- 5.5.4.2 India
- 5.5.4.3 Japan
- 5.5.4.4 South Korea
- 5.5.4.5 ASEAN
- 5.5.4.6 Rest of Asia-Pacific
- 5.5.5 Middle East and Africa
- 5.5.5.1 Middle East
- 5.5.5.1.1 Saudi Arabia
- 5.5.5.1.2 United Arab Emirates
- 5.5.5.1.3 Turkey
- 5.5.5.1.4 Rest of Middle East
- 5.5.5.2 Africa
- 5.5.5.2.1 South Africa
- 5.5.5.2.2 Nigeria
- 5.5.5.2.3 Kenya
- 5.5.5.2.4 Rest of Africa
- 5.5.5.1 Middle East
- 5.5.1 North America
6 COMPETITIVE LANDSCAPE
- 6.1 Market Concentration
- 6.2 Strategic Moves
- 6.3 Market Share Analysis
- 6.4 Company Profiles (includes Global level Overview, Market level overview, Core Segments, Financials as available, Strategic Information, Market Rank/Share for key companies, Products and Services, and Recent Developments)
- 6.4.1 Meta Platforms, Inc.
- 6.4.2 HTC Corporation
- 6.4.3 Lenovo Group Limited
- 6.4.4 Samsung Electronics Co., Ltd.
- 6.4.5 Microsoft Corporation
- 6.4.6 Sony Group Corporation
- 6.4.7 Alphabet Inc.
- 6.4.8 Pico Technology Co., Ltd.
- 6.4.9 Valve Corporation
- 6.4.10 Unity Technologies SF
- 6.4.11 Epic Games, Inc.
- 6.4.12 zSpace, Inc.
- 6.4.13 EON Reality, Inc.
- 6.4.14 Avantis Systems Ltd.
- 6.4.15 Veative Labs Pvt. Ltd.
- 6.4.16 Virtalis Holdings Limited
- 6.4.17 Nearpod, Inc.
- 6.4.18 Labster ApS
- 6.4.19 Immerse VR Ltd.
- 6.4.20 VictoryXR, Inc.
- 6.4.21 Dreamscape Immersive, Inc.
- 6.4.22 Alchemy Immersive Limited
7 MARKET OPPORTUNITIES AND FUTURE OUTLOOK
- 7.1 White-space and Unmet-Need Assessment

