


 |
市場調查報告書
商品編碼
1940628
加固型顯示器:市場佔有率分析、產業趨勢與統計、成長預測(2026-2031 年)Rugged Display - Market Share Analysis, Industry Trends & Statistics, Growth Forecasts (2026 - 2031) |
||||||
※ 本網頁內容可能與最新版本有所差異。詳細情況請與我們聯繫。
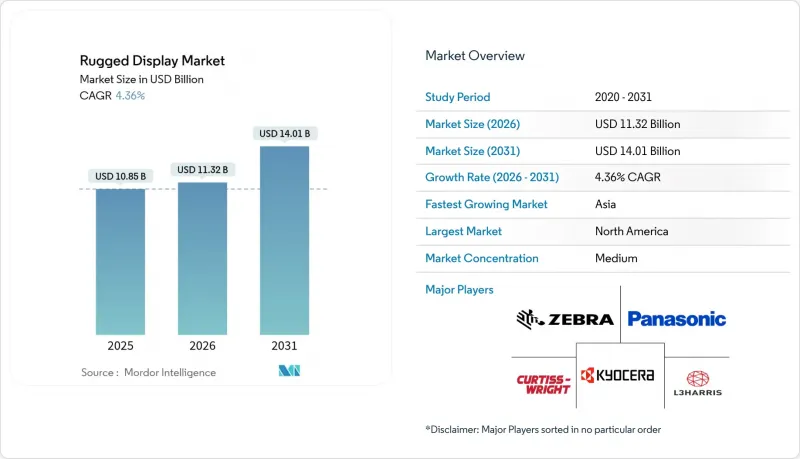
預計加固型顯示器市場將從 2025 年的 108.5 億美元成長到 2026 年的 113.2 億美元,到 2031 年將達到 140.1 億美元,2026 年至 2031 年的複合年成長率為 4.36%。
這一成長反映了國防、工業和緊急應變領域關鍵任務營運的數位化,在這些領域,市售螢幕無法承受衝擊、振動或極端溫度。擴增擴增實境(AR) 工作流程的日益普及、5G 智慧工廠的升級以及軍事現代化專案的推進,正在拓展陽光下可視、本質安全和溫度控管面板的應用範圍。產品組合向平板電腦、車用電腦和超加固外形規格產品轉變,正在重塑供應商的策略藍圖。亞太地區的成長勢頭最為強勁,製造商正在整合專用 5G 網路;而北美則憑藉國防費用和嚴格的工業安全法規保持主導。以中國為中心的 LCD 生產供應鏈風險日益增加,OLED 的散熱限制也構成了一定的阻力,但同時也推動了替代材料和本地化採購的研發。
全球環境加固型顯示器市場趨勢與洞察
將 AR 介面整合到現場服務應用中
像 RealWear Navigator 520 這樣的免手持式 AR 頭戴平板電腦,能夠將即時繪圖、遠端指導和設備數據直接傳輸到工作人員的視野中,從而提高首次維修成功率。到 2030 年,全球 AR 硬體出貨量將以 50.7% 的複合年成長率 (CAGR) 加速成長,這將推動對具備防破壞、語音控制功能以及可在爆炸性環境中使用的認證顯示器的需求。供應商正專注於低功耗晶片組和高效背光技術,以延長整個班次的電池續航時間。這正在推動堅固型顯示器市場從被動視覺化向互動式、富含感測器的平台演進,將數位疊加層與現實世界的資產融合在一起。掌握散熱技術和人眼安全亮度等級的製造商將有望抓住來自公共產業、石油和天然氣設備維護以及重型設備 OEM 服務團隊的中期成長機會。
堅固型顯示器在自主軍用車輛和無人系統的應用
隨著人工智慧驅動的自主飛行技術日趨成熟,國防機構正在指定採用模組化、開放式系統架構,以便對柯林斯太空公司的AFD-3210等自適應飛行顯示器進行升級。具備夜視功能的觸控螢幕平均故障間隔時間(MTBF)高達9000小時,滿足夜視和低特徵訊號的要求,而密封機殼則能有效抵禦衝擊、灰塵和電磁干擾。這項轉變恰逢採購週期長達2028年以後,但早期原型機已可選地整合到有人駕駛地面車輛中,證明了市場需求。堅固耐用的顯示器市場正受益於多域指揮介面,這些介面將即時感測器融合、機動目標數據和預測性維護警報整合到單一面板中。能夠平衡散熱限制和不斷成長的機載處理負載的供應商正在獲得戰略優勢。
溫度控管挑戰限制了OLED在高溫環境下的國防任務應用
由於有機發光二極體(OLED)在持續高於 85°C 的溫度下會迅速劣化,軍方擴大採用液晶顯示技術來製造車輛儀錶板和桅杆式瞄準器。冷卻板、熱管和傳導冷卻外殼會增加重量和功耗,抵消 OLED 的理論效率。引擎室和沙漠環境的溫度可能超過 125°C,因此,加固型顯示器市場的供應商優先考慮具有卓越耐熱性的非晶質液晶顯示器,同時也在投資研發能夠滿足未來性能標準並消除其熱脆弱性的無機發光材料。
細分市場分析
到2025年,平板電腦將佔據加固型顯示器市場34.72%的佔有率,其便攜性、戶外可視性和熱插拔電池等特性使其非常適合物流和現場服務作業。受用於設備內電腦視覺分析的人工智慧協處理器的推動,平板電腦加固型顯示器的市場規模預計到2031年將以4.25%的複合年成長率成長。安裝在堆高機、消防車和戰術車輛上的車載設備是成長最快的細分市場,複合年成長率達6%,這主要得益於自動駕駛技術的投資。在公共和公共產業領域,智慧型手機和手持終端機(可實現快速單手操作)將佔據一定的市場佔有率。同時,面板電腦在控制室仍然至關重要,因為控制室需要24至55英寸的多點觸控螢幕。
邊緣人工智慧與先進晶片組的融合正在重塑設備開發格局。 Panasonic 40 Mk2 採用英特爾酷睿 Ultra 晶片,在滿足 MIL-STD-810H 軍規級跌落標準的同時,將人工智慧推理性能提升了 143%。這體現了加固型顯示器市場正從通用筆記型電腦轉向專用運算設備。任務專用韌體、支援戴手套操作的觸控顯示器以及密封式 I/O 連接埠是新產品的差異化優勢。在更新設備時,買家除了考慮生命週期成本、周邊設備生態系統和網路安全認證外,還會考慮耐用性指標。
到2025年,全加固型硬體將佔據加固型顯示器市場47.10%的佔有率,在工廠車間、倉庫和前線防禦場所等應用場景中兼顧成本和耐用性。超加固型顯示器專為應對零下啟動、鹽霧腐蝕和10,000 psi壓力而設計,正以6.9%的複合年成長率快速成長,以滿足採礦、石油天然氣和特種部隊日益成長的環境需求。半加固型顯示器則為輕工業和零售環境提供入門級價格選擇,這些環境的風險因素主要是意外跌落和液體飛濺,而非衝擊波或爆炸超壓。
諸如MIL-STD-810H之類的嚴格測試標準正從特種部隊擴展到通用後勤競標,推動各個價位的產品規格不斷提高。由於高價位產品依然存在,預計超加固型設備的市場成長速度將超過銷售成長速度。供應商正在為其產品增加模組化擴展槽、射頻吸收機殼和可現場更換的固態硬碟,以確保其產品能夠適應未來的發展需求。買家逐漸意識到停機成本遠超過初始成本,因此即使在半加固型產品的採購週期中,也加快了對更高耐用性等級產品的追求。
區域分析
到2025年,北美將佔據加固型顯示器市場37.15%的佔有率,這主要得益於國防採購、美國職業安全與健康管理局 (OSHA) 和礦山安全與健康管理局 (MSHA) 嚴格的安全標準,以及成熟的工業自動化基礎設施。諸如美國陸軍的ENVG-B(夜視鏡)等合約持續推動著夜視螢幕的大規模生產。在加拿大,在惡劣環境下的採礦和管道監測需求是主要促進因素;而在墨西哥,近岸製造業的擴張正在推動汽車和電子工廠對加固型顯示器的需求。區域買家優先考慮供應鏈安全和《國際武器貿易條例》(ITAR) 的合規性,並正在加強與國內和盟國供應商的合作關係。
亞太地區正經歷最快成長,複合年成長率達5.62%,這主要得益於工廠數位化、5G專網部署以及政府主導的工業4.0跨越式發展。中國憑藉著電子製造業的規模經濟優勢和積極的自動化補貼政策,而日本在機器人領域的專業技術則對低延遲視覺化節點提出了更高的要求。印度以電信為中心的數位基礎設施規劃為鐵路和公共產業的加固型平板電腦創造了新的機會。智慧工廠試點計畫已實現52%至245%的生產力提升,證明了資本投資的合理性。東南亞的電子產業叢集和澳洲的礦業計劃進一步補充了區域需求,從而提振了各垂直領域的需求。
歐洲在ATEX安全法規、汽車電氣化專案以及航太航太研發和合作的推動下,實現了穩定成長。德國在汽車組裝領域主導地位,該領域需要密封的、可戴手套操作的面板來實現人機協作。英國正在為其機隊購買駕駛座顯示器和任務計算升級設備。北歐國家正在加大對風電場監測和北極航線的投資,因此更傾向於採用帶有加熱觸控表面的超堅固機殼。歐洲的監管環境鼓勵擁有全面認證組合的供應商,使低故障率硬體獲得更高的價格。
其他福利:
- Excel格式的市場預測(ME)表
- 分析師支持(3個月)
目錄
第1章 引言
- 研究假設和市場定義
- 調查範圍
第2章調查方法
第3章執行摘要
第4章 市場情勢
- 市場概覽
- 市場促進因素
- 將擴增實境介面整合到現場服務應用中
- 自主軍用車輛和無人系統加強型顯示器採用趨勢
- 危險工業環境中的嚴格安全法規推動了對本質安全型面板的需求。
- 戶外油氣作業對高亮度、陽光下可視螢幕的需求不斷成長(中東地區)
- 與頻繁更換礦用車輛消費級顯示器相比,其生命週期成本優勢顯著。
- 5G專用網路擴充輔助亞太智慧工廠實現加固型平板電腦升級
- 市場限制
- 在高溫環境下,溫度控管的挑戰限制了OLED在國防任務中的應用。
- 由於以中國為中心的製造業,工業液晶面板供應鏈出現波動。
- 中小型企業倉庫用超堅固型平板電腦的初始資本支出較高
- 外形規格限制了邊緣運算向穿戴式裝置的遷移
- 產業生態系分析
- 監理與技術展望
- 波特五力分析
- 供應商的議價能力
- 消費者議價能力
- 新進入者的威脅
- 替代品的威脅
- 競爭對手之間的競爭
第5章 市場規模與成長預測
- 依產品類型
- 智慧型手機和掌上電腦
- 平板電腦
- 筆記型電腦
- 航空電子顯示器
- 車上電腦
- 面板電腦和關鍵任務顯示器
- 按穩健性水平
- 半加固型
- 全加固型
- 超堅固型
- 按作業系統
- Android
- Windows
- Linux 和其他
- 最終用戶
- 石油和天然氣
- 政府、國防、航太
- 工業製造
- 汽車、運輸和物流
- 醫療保健和公共
- 公共產業和能源
- 其他最終用戶
- 按地區
- 北美洲
- 美國
- 加拿大
- 墨西哥
- 歐洲
- 德國
- 英國
- 法國
- 北歐國家
- 其他歐洲地區
- 南美洲
- 巴西
- 南美洲其他地區
- 亞太地區
- 中國
- 日本
- 印度
- 東南亞
- 亞太其他地區
- 中東和非洲
- 中東
- GCC
- 土耳其
- 其他中東地區
- 非洲
- 南非
- 其他非洲地區
- 中東
- 北美洲
第6章 競爭情勢
- 市場集中度
- 策略趨勢
- 市佔率分析
- 公司簡介
- Curtiss-Wright Corporation
- General Dynamics Corporation
- Collins Aerospace(Raytheon Technologies)
- L3Harris Technologies Inc.
- Esterline Technologies Corporation
- Xplore Technologies Corporation
- Beijer Electronics AB
- Kyocera Corporation
- Sparton Corporation
- Panasonic Holdings Corporation
- Zebra Technologies Corporation
- Getac Technology Corporation
- Dell Technologies Inc.
- Trimble Inc.
- Honeywell International Inc.
- Winmate Inc.
- Advantech Co., Ltd.
- Rockwell Automation, Inc.(Allen-Bradley)
- Juniper Systems Inc.
- AAEON Technology Inc.
- Datalogic SpA
- Leonardo SpA
- Crystal Group, Inc.
第7章 市場機會與未來展望
The rugged display market is expected to grow from USD 10.85 billion in 2025 to USD 11.32 billion in 2026 and is forecast to reach USD 14.01 billion by 2031 at 4.36% CAGR over 2026-2031.
The expansion reflects the digitization of mission-critical operations across defense, industrial, and emergency-response settings where commercial screens cannot survive shocks, vibration, or extreme temperatures. Rising adoption of augmented-reality (AR) workflows, 5G-enabled smart-factory upgrades, and military modernization programs are broadening the application base for sunlight-readable, intrinsically-safe, and thermally-managed panels. A shifting product mix toward tablet PCs, vehicle-mounted computers, and ultra-rugged form factors is reshaping vendor roadmaps. Geographic momentum is strongest in Asia-Pacific as manufacturers integrate private 5G networks, while North America retains leadership thanks to defense spending and strict industrial-safety rules. Intensifying supply-chain risks around China-centric LCD production and OLED thermal constraints pose headwinds but also spur R&D in alternative materials and regional sourcing.
Global Rugged Display Market Trends and Insights
Integration of AR Interfaces in Field-Service Applications
Hands-free AR-ready head-mounted tablets such as RealWear Navigator 520 improve first-time-fix rates by streaming live diagrams, tele-mentoring sessions, and equipment data directly in the operator's line of sight. Global AR hardware shipments are accelerating at 50.7% CAGR through 2030, feeding demand for impact-resistant, voice-controlled displays certified for explosive atmospheres. Vendors focus on low-power chipsets and efficient backlights to extend shift-length battery life. The rugged display market is therefore evolving from passive visualization toward interactive, sensor-rich platforms that blend digital overlays with real-world assets. Manufacturers that master heat-dissipation techniques and eye-safe luminance levels position themselves to capture mid-term growth from utilities, oil-and-gas maintenance, and heavy-equipment OEM service teams.
Adoption of Rugged Displays for Autonomous Military Vehicles and Unmanned Systems
Defense agencies specify modular open-systems architectures so that adaptive flight displays like Collins Aerospace's AFD-3210 can be upgraded as AI-driven autonomy matures. NVIS-compatible touchscreens with 9,000-hour MTBF meet night-vision and low-signature requirements, while sealed enclosures withstand shock, dust, and electromagnetic interference. The transition aligns with long procurement cycles that extend beyond 2028, but early prototypes embedded in optionally-manned ground vehicles validate demand. The rugged display market benefits from multi-domain command interfaces where real-time sensor fusion, kinetic-target data, and predictive-maintenance alerts converge on a single panel. Suppliers able to balance thermal constraints against rising on-board processing loads gain strategic advantage.
Thermal-Management Challenges Limiting OLED in High-Temperature Defense Missions
Organic emissive layers degrade quickly at sustained temperatures above 85 °C, prompting militaries to favor LCD technology for vehicle dashboards and mast-mounted sights. Cooling plates, heat pipes, and conduction-cooled enclosures add weight and power draw, offsetting OLED's theoretical efficiency. As engine-bay and desert climates can surpass 125 °C, rugged display market vendors prioritize robust amorphous-silicon LCDs while funding R&D into inorganic emissive materials that might satisfy future performance criteria without thermal fragility.
Other drivers and restraints analyzed in the detailed report include:
- Stringent Safety Regulations in Hazardous Industrial Environments
- Rising Demand for High-Brightness Sunlight-Readable Screens
- Supply-Chain Volatility of Industrial LCD Panels
For complete list of drivers and restraints, kindly check the Table Of Contents.
Segment Analysis
Tablet PCs accounted for 34.72% of the rugged display market in 2025, combining portability, outdoor readability, and hot-swappable batteries that align with logistics and field-service workflows. The rugged display market size for tablet PCs is projected to climb at 4.25% CAGR through 2031 as AI co-processors enable on-device computer-vision analytics. Vehicle-mounted terminals, installed on forklifts, fire engines, and tactical trucks, represent the fastest-growing niche at 6% CAGR, fueled by autonomous-mobility investments. Smartphones and handhelds hold niche share in public-safety and utilities where single-hand operation speeds ticket closure. Panel PCs remain essential in control rooms that demand 24-inch to 55-inch multi-touch surfaces.
Convergence of edge-AI and advanced chipsets is reshaping device roadmaps. Panasonic's TOUGHBOOK 40 Mk2 leverages Intel Core Ultra silicon to lift AI inference performance by 143% while meeting MIL-STD-810H drop standards. This illustrates how the rugged display market pivots toward specialized computing over generic laptops. Mission-specific firmware, glove-touch displays, and sealed I/O ports differentiate new releases. As fleets refresh, buyers compare lifecycle cost, accessory ecosystems, and cybersecurity certifications alongside raw durability metrics.
Fully-rugged hardware captured 47.10% rugged display market share in 2025, balancing cost and durability for factory floors, warehouses, and frontline defense outposts. Ultra-rugged variants, engineered to withstand sub-zero starts, salt-fog corrosion, and 10,000-psi pressure, are advancing at 6.9% CAGR as mining, oil-and-gas, and special-forces operations escalate environmental demands. Semi-rugged models offer entry pricing for light-industrial and retail settings where occasional drops or spills, rather than shock waves or blast over-pressure, define risk profiles.
Stringent test regimes such as MIL-STD-810H are migrating from elite military to mainstream logistics tenders, driving spec inflation across price bands. The rugged display market size for ultra-rugged gear is poised to outpace unit growth as premium pricing holds. Vendors add modular expansion bays, RF-absorbing housings, and field-swappable SSDs to future-proof assets. Buyers recognise that downtime penalties outweigh initial premiums, reinforcing a shift toward higher endurance ratings even in semi-rugged procurement cycles.
The Rugged Display Market Report is Segmented by Product Type (Smartphones and Handheld Computers, Tablet PCs, Laptops and Notebooks, and More), Level of Ruggedness (Semi-Rugged, Fully-Rugged, and Ultra-Rugged), Operating System (Android, Windows, and More), End User (Oil and Gas, Government, Defense and Aerospace, Industrial Manufacturing, and More) and Geography. The Market Forecasts are Provided in Terms of Value (USD).
Geography Analysis
North America generated 37.15% of rugged display market revenue in 2025, propelled by defense procurement, stringent OSHA and MSHA safety codes, and a mature industrial automation base. Contracts such as the U.S. Army's ENVG-B sustain high-volume production runs for night-vision-ready screens. Canada extends demand through harsh-weather mining and pipeline monitoring, while Mexico's expansion of near-shore manufacturing catalyzes adoption in automotive and electronics plants. Regional buyers emphasize supply-chain security and ITAR compliance, reinforcing relationships with domestic and allied suppliers.
Asia-Pacific is the fastest-growing region at 5.62% CAGR, driven by factory digitization, 5G private-network rollouts, and government initiatives to leapfrog to Industry 4.0. China's scale in electronics manufacturing combines with aggressive automation subsidies, while Japan's robotics expertise demands low-latency visualization nodes. India's telecom-centric digital infrastructure programs create new opportunities for rugged tablet deployments in railways and public utilities. Productivity gains of 52%-245% observed in pilot smart factories validate capital spend. Southeast Asian electronics clusters and Australian mining projects round out regional demand, reinforcing a diversified pull across verticals.
Europe records steady growth underpinned by ATEX safety mandates, automotive e-mobility programs, and aerospace R&D partnerships. Germany leads adoption in automotive assembly where human-robot collaboration requires sealed, glove-operable panels. The United Kingdom procures cockpit displays and mission-computing upgrades for its air fleet. Nordic investment in wind-farm monitoring and extreme-cold shipping lanes favors ultra-rugged enclosures with heated touch surfaces. Europe's regulatory landscape rewards vendors with comprehensive certification portfolios, allowing premium pricing for low-failure-rate hardware.
- Curtiss-Wright Corporation
- General Dynamics Corporation
- Collins Aerospace (Raytheon Technologies)
- L3Harris Technologies Inc.
- Esterline Technologies Corporation
- Xplore Technologies Corporation
- Beijer Electronics AB
- Kyocera Corporation
- Sparton Corporation
- Panasonic Holdings Corporation
- Zebra Technologies Corporation
- Getac Technology Corporation
- Dell Technologies Inc.
- Trimble Inc.
- Honeywell International Inc.
- Winmate Inc.
- Advantech Co., Ltd.
- Rockwell Automation, Inc. (Allen-Bradley)
- Juniper Systems Inc.
- AAEON Technology Inc.
- Datalogic S.p.A.
- Leonardo S.p.A.
- Crystal Group, Inc.
Additional Benefits:
- The market estimate (ME) sheet in Excel format
- 3 months of analyst support
TABLE OF CONTENTS
1 INTRODUCTION
- 1.1 Study Assumptions and Market Definition
- 1.2 Scope of the Study
2 RESEARCH METHODOLOGY
3 EXECUTIVE SUMMARY
4 MARKET LANDSCAPE
- 4.1 Market Overview
- 4.2 Market Drivers
- 4.2.1 Integration of Augmented Reality Interfaces in Field Service Applications
- 4.2.2 Adoption of Rugged Displays for Autonomous Military Vehicles and Unmanned Systems
- 4.2.3 Stringent Safety Regulations in Hazardous Industrial Environments Boosting Intrinsically-Safe Panels
- 4.2.4 Rising Demand for High-brightness Sunlight-Readable Screens in Outdoor Oil and Gas Operations, Middle East
- 4.2.5 Lifecycle Cost Advantage over Frequent Replacement of Consumer-grade Displays in Mining Fleets
- 4.2.6 Expansion of 5G Private Networks Enabling Rugged Tablet Upgrades in Smart Factories, Asia-Pacific
- 4.3 Market Restraints
- 4.3.1 Thermal Management Challenges Limiting Adoption of OLED in High-temperature Defense Missions
- 4.3.2 Supply Chain Volatility of Industrial LCD Panels Due to China-centric Manufacturing
- 4.3.3 High Initial Capital Outlay for Ultra-rugged Panel PCs in SMB Warehouses
- 4.3.4 Form-factor Constraints as Edge Computing Shifts Towards Wearables
- 4.4 Industry Ecosystem Analysis
- 4.5 Regulatory and Technological Outlook
- 4.6 Porter's Five Forces Analysis
- 4.6.1 Bargaining Power of Suppliers
- 4.6.2 Bargaining Power of Consumers
- 4.6.3 Threat of New Entrants
- 4.6.4 Threat of Substitutes
- 4.6.5 Intensity of Competitive Rivalry
5 MARKET SIZE AND GROWTH FORECASTS (VALUES)
- 5.1 By Product Type
- 5.1.1 Smartphones and Handheld Computers
- 5.1.2 Tablet PCs
- 5.1.3 Laptops and Notebooks
- 5.1.4 Avionics Displays
- 5.1.5 Vehicle-mounted Computers
- 5.1.6 Panel PCs and Mission-critical Displays
- 5.2 By Level of Ruggedness
- 5.2.1 Semi-rugged
- 5.2.2 Fully-rugged
- 5.2.3 Ultra-rugged
- 5.3 By Operating System
- 5.3.1 Android
- 5.3.2 Windows
- 5.3.3 Linux and Other
- 5.4 By End-User
- 5.4.1 Oil and Gas
- 5.4.2 Government, Defense and Aerospace
- 5.4.3 Industrial Manufacturing
- 5.4.4 Automotive, Transportation and Logistics
- 5.4.5 Healthcare and Public Safety
- 5.4.6 Utilities and Energy
- 5.4.7 Other End-Users
- 5.5 By Geography
- 5.5.1 North America
- 5.5.1.1 United States
- 5.5.1.2 Canada
- 5.5.1.3 Mexico
- 5.5.2 Europe
- 5.5.2.1 Germany
- 5.5.2.2 United Kingdom
- 5.5.2.3 France
- 5.5.2.4 Nordics
- 5.5.2.5 Rest of Europe
- 5.5.3 South America
- 5.5.3.1 Brazil
- 5.5.3.2 Rest of South America
- 5.5.4 Asia-Pacific
- 5.5.4.1 China
- 5.5.4.2 Japan
- 5.5.4.3 India
- 5.5.4.4 South-East Asia
- 5.5.4.5 Rest of Asia-Pacific
- 5.5.5 Middle East and Africa
- 5.5.5.1 Middle East
- 5.5.5.1.1 Gulf Cooperation Council Countries
- 5.5.5.1.2 Turkey
- 5.5.5.1.3 Rest of Middle East
- 5.5.5.2 Africa
- 5.5.5.2.1 South Africa
- 5.5.5.2.2 Rest of Africa
- 5.5.5.1 Middle East
- 5.5.1 North America
6 COMPETITIVE LANDSCAPE
- 6.1 Market Concentration
- 6.2 Strategic Moves
- 6.3 Market Share Analysis
- 6.4 Company Profiles {(includes Global level Overview, Market level overview, Core Segments, Financials as available, Strategic Information, Market Rank/Share for key companies, Products and Services, and Recent Developments)}
- 6.4.1 Curtiss-Wright Corporation
- 6.4.2 General Dynamics Corporation
- 6.4.3 Collins Aerospace (Raytheon Technologies)
- 6.4.4 L3Harris Technologies Inc.
- 6.4.5 Esterline Technologies Corporation
- 6.4.6 Xplore Technologies Corporation
- 6.4.7 Beijer Electronics AB
- 6.4.8 Kyocera Corporation
- 6.4.9 Sparton Corporation
- 6.4.10 Panasonic Holdings Corporation
- 6.4.11 Zebra Technologies Corporation
- 6.4.12 Getac Technology Corporation
- 6.4.13 Dell Technologies Inc.
- 6.4.14 Trimble Inc.
- 6.4.15 Honeywell International Inc.
- 6.4.16 Winmate Inc.
- 6.4.17 Advantech Co., Ltd.
- 6.4.18 Rockwell Automation, Inc. (Allen-Bradley)
- 6.4.19 Juniper Systems Inc.
- 6.4.20 AAEON Technology Inc.
- 6.4.21 Datalogic S.p.A.
- 6.4.22 Leonardo S.p.A.
- 6.4.23 Crystal Group, Inc.
7 MARKET OPPORTUNITIES AND FUTURE OUTLOOK
- 7.1 White-space and Unmet-Need Assessment
 2026年全球物流手持顯示器市場報告2026年全球環境加固型顯示器市場報告
 加強型顯示器市場 - 全球產業規模、佔有率、趨勢、機會和預測:按類型、觸控螢幕類型、最終用戶、地區和競爭格局分類,2021-2031 年
 堅固型顯示器市場規模、佔有率和成長分析(按產品類型、堅固性等級、作業系統、顯示器類型、最終用戶和地區分類)-2026-2033年產業預測
 2025 年至 2033 年堅固型顯示器市場報告(按產品、堅固程度、作業系統、最終用戶和地區)
 全球堅固型顯示器市場規模:依顯示器、螢幕尺寸、最終用途產業、地區、範圍和預測
 加固型顯示器市場、機會、成長動力、產業趨勢分析與預測,2024-2032