


 |
市場調查報告書
商品編碼
1940626
企業員工交通服務:市場佔有率分析、產業趨勢與統計、成長預測(2026-2031)Corporate Employee Transportation Service - Market Share Analysis, Industry Trends & Statistics, Growth Forecasts (2026 - 2031) |
||||||
※ 本網頁內容可能與最新版本有所差異。詳細情況請與我們聯繫。
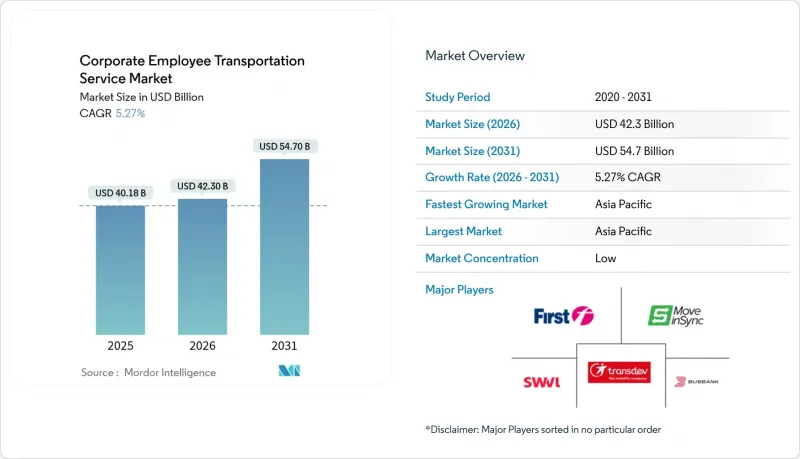
企業員工交通服務市場預計將從 2025 年的 401.8 億美元成長到 2026 年的 423 億美元,到 2031 年達到 547 億美元,2026 年至 2031 年的複合年成長率為 5.27%。
企業為吸引人才、遵守範圍 3排放法規以及實施數位化平台以簡化路線規劃,紛紛將通勤福利計畫納入正式流程,這推動了通勤產業的成長。自動駕駛班車的商業化運作、政府對零排放車輛日益成長的支持以及區域城市交通堵塞加劇,都促進了通勤行業的擴張。分散的區域運營商和創業投資的平台運營商並存,使得市場競爭仍然溫和;而司機短缺和保險費上漲帶來的成本壓力則推動了技術整合。同時,雇主們正將通勤福利定位為策略性福利,並將交通政策與多元化、公平性和包容性 (DEI) 目標相結合,以提高員工留任率並降低缺勤率。
全球企業員工交通服務市場趨勢與洞察
數位化按需接送平台拓展全球業務
各國政府正在為叫車公司(TNC)制定保險、許可和無障礙設施方面的規定,使企業使用基於應用程式的班車服務合法化。加州的按次付費保險和紐約州的許可費制度有利於資金雄厚的現有企業,讓企業風險負責人更加安心。西雅圖的集體談判條例提高了駕駛人薪資,同時提升了服務可靠性,從而為雇主帶來了更高的服務水準。隨著合規性標準的日益明確,企業員工通勤市場正在經歷數位化路線規劃、動態定價和自動費用編碼的普及,推動了平台的使用。
亞洲和非洲二線都會區的城市快速擴張
印度的智慧城市計畫和AMRUT計畫將基礎設施投資重點放在快速發展的二線城市,這與亞洲開發銀行預測的到2050年印度城市人口將達到4億的目標完全吻合。撒哈拉以南非洲也呈現類似的趨勢,世界銀行的數據顯示,該地區的城市人口預計將在15年內翻倍。經合組織倡導的公私合營將使市政當局能夠制定財務計劃,並使企業班車營運商能夠融入城市層面的出行即服務(MaaS)生態系統。這些趨勢將增加員工通勤需求,並為企業員工交通市場中基於路線、技術驅動的服務提供者開闢新的市場機會。
執照商業司機短缺
美國疾病管制與預防中心(CDC)的模型預測,到2030年,由於退休人數超過新入行人數,美國將出現16萬名駕駛人。聯邦汽車運輸安全管理局(FMCSA)的「安全駕駛員學徒試驗計畫」招收18至20歲的年輕人,但要求提供三年的數據以檢驗其安全駕駛能力。隨著薪資上漲,企業員工通勤市場正轉向無需商業駕駛執照的小型車輛以及減少對人工依賴的自動駕駛試點計畫。為了鞏固員工基礎並提高員工滿意度,營運商提供誘人的留任獎金和靈活的輪班競標選項。這些措施不僅創造了更穩定的職場環境,還有助於促進州際商業駕駛執照(CDL)的核准,擴大候選人才庫,並吸引擁有不同技能的專業人才。
細分市場分析
截至2025年,外包運輸服務將佔企業員工運輸市場的45.05%,反映出企業正透過外包車輛維護、駕駛人管理和合規監管等方式,轉向輕資產策略。租賃將成為成長最快的所有權模式,複合年成長率將達到7.08%。租賃模式提供靈活的運力,能夠適應混合辦公模式,並允許在季節性需求高峰期快速擴張。雖然在安全要求高的行業中,車輛所有權仍然佔據主導地位,但資本密集和即將推出的排放法規限制了企業的擴張意願。
隨著企業員工交通服務市場的日益成熟,外包供應商提供的承包解決方案整合了預測性維護、路線分析和行動預訂API,使其成為人力資源和採購部門專注於自身核心競爭力的理想選擇。聯邦機構在GSA採購計畫下的第三方車輛合約中也展現出類似的趨勢,證實了這種方法在公共部門的有效性。由此形成的生態系統有助於大量採購、簡化績效指標,並在跨國部署中實現一致的服務水準協定。
到2025年,巴士和長途客車將佔企業員工交通市場收入的40.95%,這主要得益於連接郊區停車換乘設施和大型園區的高密度、具成本效益線路的推動。同時,廂型車和多用途汽車(MPV)正以8.21%的複合年成長率快速成長,因為車隊運力正在適應靈活工作安排下每日員工人數的波動。預計廂型車在企業員工交通市場的佔有率將迅速擴大,因為車隊電氣化的激勵措施降低了總體擁有成本(TCO)。德國目前的稅收制度對價值高達9.5萬歐元(10萬美元)的電動廂型車提供補貼,有利於提高車輛的全生命週期經濟效益。自動駕駛試驗計畫更傾向於中型車輛,因為它們重量更輕、寬度更窄,更容易獲得路線認證。
小型巴士和轎車將繼續扮演各自的特定角色:小型巴士填補郊區環線客流量的不足,而轎車則服務於高階主管和有醫療需求的乘客。從自動緊急煞車到車道維持輔助等安全功能的廣泛應用將縮小營運成本差距。隨著企業採用排放儀錶板,車輛類型的選擇將成為實現範圍3排放目標的關鍵因素,從而推動電池貨車和燃料電池公車的發展。
區域分析
預計到2025年,亞太地區將佔企業員工交通服務市場39.05%的佔有率,並在2031年之前以8.44%的複合年成長率成長。這主要得益於印度智慧城市投資和東南亞多模態走廊規劃的進展。中國的城市叢集策略已在大型區域環帶內建立了首末一公里接駁服務體系,為出行即服務(MaaS)的整合提供了沃土。經合組織引入的公私合營特許經營模式允許透過用戶付費實現資本回收,並降低了營運商的准入風險。該地區年輕的人口結構和較高的智慧型手機普及率進一步強化了行動預訂的優勢。
北美地區的自動駕駛汽車普及率已趨於穩定,聯邦政府提供的通勤補貼(每月最高可達325美元)有助於維持計畫資金。遍佈八個州的20多條自動駕駛測試路線鞏固了北美在自動駕駛技術領域的領先地位,而駕駛人則促使運營商嘗試多班次和輪班制。保險費上漲持續構成成本壓力,擠壓小規模業者的利潤空間,並推動產業整合。
歐洲在永續性和隱私保護政策方面取得了顯著進展。德國的加速折舊制度和西班牙的MOVES III補貼計畫縮短了電動車隊的投資回收期,並鼓勵快速更新換代。荷蘭的自行車補貼政策,加上低稅率的企業自行車計劃,正在推動積極通勤方式的普及。一般資料保護規則(GDPR)和《職工委員會法》強制執行嚴格的資料處理通訊協定,並鼓勵供應商建構以隱私為中心的解決方案。這些法規提高了進入門檻,同時提升了服務質量,增強了歐洲供應商在企業員工交通運輸市場的聲譽。
其他福利:
- Excel格式的市場預測(ME)表
- 3個月的分析師支持
目錄
第1章 引言
- 研究假設和市場定義
- 調查範圍
第2章調查方法
第3章執行摘要
第4章 市場情勢
- 市場概覽
- 市場促進因素
- 數位化按需接送平台拓展全球業務
- 雇主越來越關注環境、社會和治理 (ESG) 以及範圍 3 的排放。
- 企業間人才競爭加劇,通勤補貼增加
- 亞洲和非洲二線城市的快速都市化進程
- 自動駕駛班車測試進入商業化階段
- 歐洲共用旅遊稅收優惠政策
- 市場限制
- 執照商業司機短缺
- 商用車保險費上漲
- 現有工會反對共乘模式
- 員工追蹤應用程式引發資料隱私反彈
- 價值/供應鏈分析
- 監管環境
- 技術展望
- 波特五力分析
- 供應商的議價能力
- 買方(員工)的議價能力
- 新進入者的威脅
- 替代品的威脅
- 競爭對手之間的競爭
第5章 市場規模與成長預測
- 依所有權類型
- 本公司自有運輸服務
- 外包運輸服務
- 出租/租賃
- 接駁車服務(定時接駁車)
- 按車輛類型
- 搭乘用車
- 廂型車和多用途車輛(MPV)
- 小巴
- 公車和長途客車
- 按服務模式
- 出遊即服務 (MaaS)
- 軟體即服務 (SaaS)/旅遊規劃
- 監護權轉移服務
- 混合模式(出遊即服務 + 車隊管理)
- 透過預訂平台
- 行動應用
- 基於網路的門戶
- 客服中心/線下
- 按最終用戶行業分類
- 資訊科技與資訊科技相關服務 (ITES)
- 銀行、金融服務和保險(BFSI)
- 製造業和工業部門
- 醫療保健和生命科學
- 能源與公共產業
- 其他(教育機構、政府機構等)
- 按地區
- 北美洲
- 美國
- 加拿大
- 北美其他地區
- 南美洲
- 巴西
- 阿根廷
- 其他南美洲
- 歐洲
- 德國
- 英國
- 法國
- 西班牙
- 義大利
- 荷蘭
- 波蘭
- 俄羅斯
- 其他歐洲地區
- 亞太地區
- 印度
- 中國
- 日本
- 韓國
- 澳洲
- 紐西蘭
- 泰國
- 印尼
- 越南
- 新加坡
- 亞太其他地區
- 中東和非洲
- 阿拉伯聯合大公國
- 沙烏地阿拉伯
- 土耳其
- 埃及
- 南非
- 其他中東和非洲地區
- 北美洲
第6章 競爭情勢
- 市場集中度
- 策略趨勢
- 市佔率分析
- 公司簡介
- Transdev Group
- FirstGroup plc
- Swvl Holdings Corp
- MoveInSync Technology Solutions Private Limited
- Shuttl(Chalo Mobility Chalo Mobility Private Limited)
- Busbank(Global Charter Services Inc.)
- Janani Tours and Resorts Pvt Ltd.
- Sun Telematics
- Via Transportation Inc.
- Lyft Inc.
- Uber Technologies Inc.
- Enterprise Holdings Inc.
- Addison Lee Limited
- Prairie Bus Lines Ltd.
- Eco Rent A Car
- Zum Services Inc.
- BusUp Technologies SL
- Ridecell Inc.
- Fleet Complete
第7章 市場機會與未來展望
The corporate employee transportation services market is expected to grow from USD 40.18 billion in 2025 to USD 42.3 billion in 2026 and is forecast to reach USD 54.7 billion by 2031 at 5.27% CAGR over 2026-2031.
Growth rests on corporations formalizing commuter-benefit programs to secure talent, comply with Scope-3 emission mandates, and adopt digital platforms that streamline route planning. Autonomous shuttle pilots entering commercial service, widening government incentives for zero-emission fleets, and rising urban congestion across Tier-2 cities collectively reinforce expansion momentum. Competitive intensity remains moderate because fragmented regional operators coexist with venture-backed platform players, while cost pressures tied to driver shortages and escalating insurance premiums encourage technology integration. In parallel, employers treat commuter offerings as a strategic benefit, aligning transportation policies with diversity, equity, and inclusion (DEI) objectives to boost retention and shrink absenteeism.
Global Corporate Employee Transportation Service Market Trends and Insights
Digital On-Demand Shuttle Platforms Are Scaling Globally
Governments have codified insurance, licensing, and accessibility rules for Transportation Network Companies, legitimizing corporate use of app-based shuttles. California mandates coverage per active ride while New York applies a licensing fee, moves that favor capitalized incumbents and reassure corporate risk managers. Seattle's collective-bargaining ordinance pushes driver wages up but lifts reliability, translating into higher employer service levels. As compliance clarity spreads, the corporate employee transportation services market embeds digital routing, dynamic pricing, and automated expense coding, deepening platform stickiness.
Rapid Urban Sprawl in Tier-2 Cities of Asia and Africa
India's Smart Cities Mission and AMRUT funnel infrastructure outlays toward rising Tier-2 hubs, dovetailing with Asian Development Bank projections of 400 million new urbanites by 2050 . Similar patterns occur in Sub-Saharan Africa where World Bank data track city populations that will double inside 15 years. Public-private partnerships championed by the OECD give municipalities financial blueprints, allowing corporate shuttle operators to integrate with city-level mobility-as-a-service ecosystems. These trends swell employee commuting demand and open white space for route-based, tech-enabled providers in the corporate employee transportation services market.
Labor Shortages in Licensed Commercial Drivers
CDC modeling foresees a 160,000-driver gap by 2030 as retirements outpace new entrants. FMCSA's Safe Driver Apprenticeship Pilot accepts 18- to 20-year-olds but needs three-year data to validate safety . With wages escalating, the corporate employee transportation services market pivots to smaller vehicles that do not require commercial driver's licenses and to autonomous pilots that reduce human dependency. To fortify their operations and enhance employee satisfaction, providers are rolling out enticing retention bonuses and offering flexible shift bidding options. These initiatives not only create a more stable work environment but also help them advocate for interstate CDL reciprocity, which would broaden their candidate pools and attract a diverse range of skilled professionals.
Other drivers and restraints analyzed in the detailed report include:
- Growing Employers' Focus on ESG and Scope-3 Emission Cuts
- Autonomous Shuttle Pilots Entering Commercial Phase
- Data-Privacy Backlash Against Employee Tracking Apps
For complete list of drivers and restraints, kindly check the Table Of Contents.
Segment Analysis
Outsourced transportation service held a 45.05% slice of the corporate employee transportation service market in 2025, underscoring a corporate pivot toward asset-light strategies that offload fleet upkeep, driver management, and regulatory compliance. Rental and leasing follow as the fastest-growing ownership mode with a 7.08% CAGR, offering flex capacity for hybrid work schedules and allowing rapid scaling during seasonal demand spikes. Company-owned operations persist in industries with elevated security needs, but capital intensity and looming emission regulations curb expansion appetite.
As the corporate employee transportation services market matures, outsourced vendors bundle predictive maintenance, route analytics, and mobile booking APIs, forming turnkey solutions attractive to HR and procurement teams focused on core-business concentration. Federal agencies mirror the trend by contracting third-party fleets under GSA schedules, signaling public-sector validation. The resulting ecosystem fosters consolidated purchasing, streamlined performance metrics, and consistent service-level agreements across multinational footprints.
Buses and coaches retained 40.95% of the corporate employee transportation service market revenue in 2025, thanks to cost-efficient high-density corridors linking suburban park-and-ride to mega campuses. Yet vans and MPVs are racing at an 8.21% CAGR, aligning vehicle capacity to volatile daily headcounts under flexible-work regimes. The corporate employee transportation services market size booked for vans will expand rapidly as fleet electrification incentives improve the total cost of ownership. Germany's tax rules now cover electric vans priced up to EUR 95,000 (USD 100,000), tilting lifecycle economics in their favor. Autonomous pilot programs favor mid-size formats because lower curb weights and narrower footprints simplify route certification.
Minibuses and passenger cars sustain niche roles: minibuses bridge passenger-density gaps on suburban circulators, while sedans cater to executives and medically sensitive riders. From automated emergency braking to lane-keeping assist, safety equipment migrates downmarket, narrowing operating-cost gaps. As employers adopt emissions dashboards, vehicle-type choice becomes a lever for meeting Scope-3 targets, reinforcing momentum for battery vans and fuel-cell buses.
The Corporate Employee Transportation Services Market Report is Segmented by Ownership (Company-Owned Transportation Service, and More), Vehicle Type (Passenger Cars, and More), Service Model (Mobility-As-A-Service, and More), Booking Platform (Mobile Application, and More), End-User Industry (IT and ITES, BFSI, and More), and Geography. The Market Forecasts are Provided in Terms of Value (USD).
Geography Analysis
Asia-Pacific exercised 39.05% control of the corporate employee transportation services market size in 2025 and is charting an 8.44% CAGR through 2031, propelled by Smart Cities investments in India and multimodal corridor plans across Southeast Asia. China's urban-cluster strategy institutionalizes first-mile/last-mile shuttles inside megaregional rings, providing fertile ground for MaaS integration. Public-private concession models seeded by the OECD permit capital recovery via availability payments and de-risking operator entry. The region's young demographic and smartphone penetration reinforce mobile-booking dominance.
North America reflects a mature adoption curve, with federal commuter subsidies of up to USD 325 monthly underpinning sustained program budgets. Over 20 autonomous pilot corridors across eight states cement technology leadership, while driver shortages spur experimentation with multi-shifts and split-duty rosters. Insurance inflation remains an ongoing cost headwind, compressing margins for small providers and nudging consolidation.
Europe showcases policy sophistication around sustainability and privacy. German accelerated depreciation and Spanish MOVES III grants compress payback on electric fleets, stimulating rapid replacement cycles. The Netherlands combines bicycle allowances with low-tax company-bike schemes to mainstream active commuting. GDPR and works council statutes impose strict data-handling protocols, prompting vendors to architect privacy-centric solutions. Such regulation simultaneously raises barriers to entry and elevates service quality, enhancing the reputation of European providers within the corporate employee transportation services market.
- Transdev Group
- FirstGroup plc
- Swvl Holdings Corp
- MoveInSync Technology Solutions Private Limited
- Shuttl (Chalo Mobility Chalo Mobility Private Limited)
- Busbank (Global Charter Services Inc.)
- Janani Tours and Resorts Pvt Ltd.
- Sun Telematics
- Via Transportation Inc.
- Lyft Inc.
- Uber Technologies Inc.
- Enterprise Holdings Inc.
- Addison Lee Limited
- Prairie Bus Lines Ltd.
- Eco Rent A Car
- Zum Services Inc.
- BusUp Technologies S.L.
- Ridecell Inc.
- Fleet Complete
Additional Benefits:
- The market estimate (ME) sheet in Excel format
- 3 months of analyst support
TABLE OF CONTENTS
1 Introduction
- 1.1 Study Assumptions & Market Definition
- 1.2 Scope of the Study
2 Research Methodology
3 Executive Summary
4 Market Landscape
- 4.1 Market Overview
- 4.2 Market Drivers
- 4.2.1 Digital On-Demand Shuttle Platforms are Scaling Globally
- 4.2.2 Growing Employers Focus on ESG And Scope-3 Emission Cuts
- 4.2.3 Corporate War for Talent, Boosting Commuter Benefits
- 4.2.4 Rapid Urban Sprawl in Tier-2 Cities of Asia and Africa
- 4.2.5 Autonomous Shuttle Pilots Entering Commercial Phase
- 4.2.6 Tax Incentives for Shared Mobility in Europe
- 4.3 Market Restraints
- 4.3.1 Labor Shortages in Licensed Commercial Drivers
- 4.3.2 Rising Insurance Premiums for Corporate Fleets
- 4.3.3 Legacy Union Opposition to Ride-Sharing Models
- 4.3.4 Data-Privacy Backlash Against Employee Tracking Apps
- 4.4 Value / Supply-Chain Analysis
- 4.5 Regulatory Landscape
- 4.6 Technological Outlook
- 4.7 Porter's Five Forces Analysis
- 4.7.1 Bargaining Power of Suppliers
- 4.7.2 Bargaining Power of Buyers/Employees
- 4.7.3 Threat of New Entrants
- 4.7.4 Threat of Substitutes
- 4.7.5 Intensity of Competitive Rivalry
5 Market Size & Growth Forecasts (Value, USD)
- 5.1 By Ownership
- 5.1.1 Company-owned Transportation Service
- 5.1.2 Outsourced Transportation Service
- 5.1.3 Rentals / Leasing
- 5.1.4 Pick & Drop (Scheduled Shuttle)
- 5.2 By Vehicle Type
- 5.2.1 Passenger Cars
- 5.2.2 Vans and MPVs
- 5.2.3 Minibuses
- 5.2.4 Buses & Coaches
- 5.3 By Service Model
- 5.3.1 Mobility-as-a-Service (MaaS)
- 5.3.2 Software-as-a-Service (SaaS) / Trip-Planning
- 5.3.3 Managed Transportation Services
- 5.3.4 Hybrid (MaaS + Managed Fleet)
- 5.4 By Booking Platform
- 5.4.1 Mobile Application
- 5.4.2 Web-based Portal
- 5.4.3 Call-center / Offline
- 5.5 By End-user Industry
- 5.5.1 IT and IT-enabled Services (ITES)
- 5.5.2 Banking, Financial Services and Insurance (BFSI)
- 5.5.3 Manufacturing and Industrial
- 5.5.4 Healthcare and Life Sciences
- 5.5.5 Energy and Utilities
- 5.5.6 Others (Education, Government, etc.)
- 5.6 By Geography
- 5.6.1 North America
- 5.6.1.1 United States
- 5.6.1.2 Canada
- 5.6.1.3 Rest of North America
- 5.6.2 South America
- 5.6.2.1 Brazil
- 5.6.2.2 Argentina
- 5.6.2.3 Rest of South America
- 5.6.3 Europe
- 5.6.3.1 Germany
- 5.6.3.2 United Kingdom
- 5.6.3.3 France
- 5.6.3.4 Spain
- 5.6.3.5 Italy
- 5.6.3.6 Netherlands
- 5.6.3.7 Poland
- 5.6.3.8 Russia
- 5.6.3.9 Rest of Europe
- 5.6.4 Asia-Pacific
- 5.6.4.1 India
- 5.6.4.2 China
- 5.6.4.3 Japan
- 5.6.4.4 South Korea
- 5.6.4.5 Australia
- 5.6.4.6 New Zealand
- 5.6.4.7 Thailand
- 5.6.4.8 Indonesia
- 5.6.4.9 Vietnam
- 5.6.4.10 Singapore
- 5.6.4.11 Rest of Asia-Pacific
- 5.6.5 Middle-East and Africa
- 5.6.5.1 United Arab Emirates
- 5.6.5.2 Saudi Arabia
- 5.6.5.3 Turkey
- 5.6.5.4 Egypt
- 5.6.5.5 South Africa
- 5.6.5.6 Rest of Middle-East and Africa
- 5.6.1 North America
6 Competitive Landscape
- 6.1 Market Concentration
- 6.2 Strategic Moves
- 6.3 Market Share Analysis
- 6.4 Company Profiles (Includes Global level Overview, Market level overview, Core Segments, Financials as available, Strategic Information, Market Rank/Share, Products & Services, Recent Developments)
- 6.4.1 Transdev Group
- 6.4.2 FirstGroup plc
- 6.4.3 Swvl Holdings Corp
- 6.4.4 MoveInSync Technology Solutions Private Limited
- 6.4.5 Shuttl (Chalo Mobility Chalo Mobility Private Limited)
- 6.4.6 Busbank (Global Charter Services Inc.)
- 6.4.7 Janani Tours and Resorts Pvt Ltd.
- 6.4.8 Sun Telematics
- 6.4.9 Via Transportation Inc.
- 6.4.10 Lyft Inc.
- 6.4.11 Uber Technologies Inc.
- 6.4.12 Enterprise Holdings Inc.
- 6.4.13 Addison Lee Limited
- 6.4.14 Prairie Bus Lines Ltd.
- 6.4.15 Eco Rent A Car
- 6.4.16 Zum Services Inc.
- 6.4.17 BusUp Technologies S.L.
- 6.4.18 Ridecell Inc.
- 6.4.19 Fleet Complete
7 Market Opportunities & Future Outlook
 2026年全球養蜂運輸卡車市場報告2026年全球低溫運輸服務市場報告2026年全球卡車運輸市場報告2026年全球運輸管理服務市場報告2026年全球企業員工交通服務市場報告
 以資產為基礎的運輸服務市場(按服務類型、設備、運輸距離、溫度控制和最終用戶產業分類),全球預測,2026-2032年全球貨物燻蒸服務市場(依產品種類、燻蒸劑類型、處理方式、運輸方式、最終用途產業及通路分類)預測(2026-2032)簾式拖車租賃市場:2026-2032年全球預測(按拖車類型、載重能力、分銷管道、牽引車輛、應用和最終用戶分類)
 全球永續企業交通運輸市場:預測至 2032 年-按服務類型、車輛類型、車隊所有權模式、最終用戶和地區分類的分析散貨港口料斗市場按產品類型、建築材料、營運模式、容量、應用和分銷管道分類-2025-2030 年全球預測