


 |
市場調查報告書
商品編碼
1940569
清潔機器人:市場佔有率分析、產業趨勢與統計、成長預測(2026-2031)Cleaning Robot - Market Share Analysis, Industry Trends & Statistics, Growth Forecasts (2026 - 2031) |
||||||
※ 本網頁內容可能與最新版本有所差異。詳細情況請與我們聯繫。
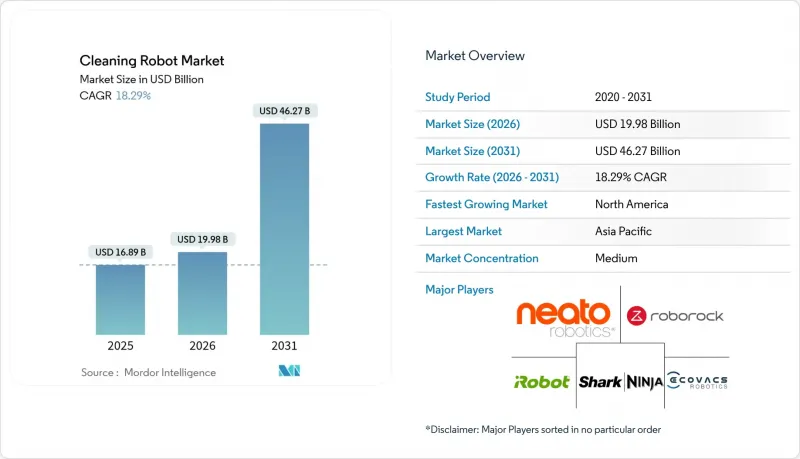
預計清潔機器人市場將從 2025 年的 168.9 億美元成長到 2026 年的 199.8 億美元,到 2031 年將達到 462.7 億美元,2026 年至 2031 年的複合年成長率為 18.29%。
受非接觸式清潔解決方案的強勁需求、智慧家庭的快速普及以及感測器組件成本的大幅下降的推動,清潔機器人市場持續成長。商業物業管理者日益認知到自主清潔是最佳化勞動力配置的關鍵環節,而住宅則受益於LiDAR價格的下降以及電商管道的便捷購買。固體雷射雷達的規模經濟效益,加上機器人即服務(RaaS)訂閱模式,透過降低擁有門檻,進一步擴大了清潔機器人市場。來自垂直整合的亞洲製造商日益激烈的競爭雖然給利潤率帶來了壓力,但也加速了產品多樣化和區域覆蓋的擴大。
全球清潔機器人市場趨勢與洞察
提高商業設施的後疫情時代衛生標準
大多數公共和私人機構都已將新冠疫情期間的清潔通訊協定製度化,從而維持了對自主地面清潔機器人和紫外線消毒機器人的需求。機場實施夜間機器人清潔作業已證明其能夠節省人力並提升乘客信心。新加坡公共部門大規模競標採購自主清潔機器人,反映了政府對持續衛生防疫工作的支持。醫療機構也依賴ISO 13482認證的機器人來降低感染風險,而無需增加人力投資。持續的監管關注和用戶期望共同推動清潔機器人市場保持高速成長。
智慧家庭的快速普及和可支配收入的成長
智慧家庭中樞如今能夠同步實現掃地機器人的日程安排、語音控制和遠距離診斷,使其從普通的小工具躍升為家庭自動化系統的核心節點。來自主流廠商的Matter認證設備正在消除互通性障礙,並擴大目標用戶群。在中國、印度和東南亞,中產階級收入的成長推動了高級產品的購買,這些產品融合了基於人工智慧的障礙物感知和混合導航技術。這些趨勢持續吸引新用戶進入掃地機器人市場。
與傳統設備初始成本比較
中小企業仍然猶豫是否要用價值 300 至 3000 美元的機器人來取代價值 50 至 200 美元的手動工具。希斯洛機場透過機器人每年節省了 124,175 英鎊(155,219 美元)的人事費用,但需要證明投資回收期在兩年以內才能獲得董事會核准。機器人即服務 (ROaaS) 透過將資本支出轉化為營運成本來降低前期成本,但供應商必須管理電池劣化和重新部署的風險,才能保持合約的吸引力。
細分市場分析
到2025年,住宅清潔機器人,尤其是地面清潔機器人,將佔據清潔機器人市場71.32%的主導佔有率。價格下降和頻繁的型號更新將支撐強勁的住宅需求,而泳池清潔機器人和窗戶清潔機器人等細分市場將保持穩定,儘管規模較小。相較之下,商用機器人預計將以18.42%的複合年成長率成長,這主要得益於可衡量的投資回報率和設施維護中不斷上漲的人事費用。消毒型機器人正在經歷顯著成長,這尤其受到醫院對紫外線和等離子體消毒要求的推動。商業用戶也重視耐環境腐蝕的底盤、可更換電池以及針對潮濕環境的認證防護等級。供應商的差異化優勢正在轉向車隊管理儀表板和預測性維護數據分析,以減少非計劃性停機時間。延長的服務合約進一步降低了整體擁有成本,並鞏固了商用應用的路徑。儘管初始成本較高,但投資回收期正在縮短,越來越多的產業,包括火車站、購物中心和政府大樓,都在購買自主清潔解決方案。
家用清潔機器人市場持續受惠於專業清潔車隊所開發功能的連鎖效應,例如多層次地圖繪製和自適應吸力。能夠乾濕兩用清潔的混合模式擴大了其在家庭中的吸引力,而訂閱式耗材配送服務則鞏固了客戶在品牌生態系統中的地位。住宅環境相對寬鬆的監管環境加快了新功能的上市速度。整體而言,這兩個市場相輔相成。消費級市場規模降低了硬體成本,而商用市場的平均售價則為先進的研發提供了資金,從而為清潔機器人市場形成良性循環。
到2025年,住宅用戶將佔總收入的57.41%,這反映了智慧家庭整合技術的廣泛應用和口碑傳播。然而,醫院、診所和養老機構的成長速度最快,複合年成長率將達到18.55%。由於需要投入大量預算來預防感染,因此在非工作時間運作的紫外線和過氧化氫消毒機器人價格較高也是合理的。設施管理人員認為,持續降低病原體載量和提高員工安全是主要的購買促進因素。零售連鎖店、飯店和餐廳正在部署小規模機器人團隊,以在人手不足的情況下維持服務環境。機場正在利用24小時運作來應對客流高峰,而無需支付加班費。一些正在嘗試靈活運轉率的辦公室正在實施由物聯網佔用感測器觸發的按需清潔系統。
工廠和倉庫需要通過ATEX認證的機器,能夠安全地處理粉塵和揮發性化學品,這是清潔機器人市場中一個細分但利潤豐厚的領域。隨著終端用戶群體日益多元化,市場細分也變得更加複雜,因為供應商必須根據具體應用場景自訂有效載荷能力、導航演算法和抗菌材料選擇。
區域分析
到2025年,北美將維持39.45%的收入佔有率,這主要得益於美國政府為機場、交通樞紐和學校購買自動地面清潔機器人。加州和紐約的醫院在量化了減少醫院感染的益處後,加速了機器人的應用。加拿大與美國供應商的監管一致性以及地理位置的接近性促進了跨境擴張,而墨西哥的加工出口區則吸引了組裝投資,以規避關稅風險。目前,該地區的成長主要由續約和維護合約驅動,而非新購,這表明清潔機器人市場已趨於成熟,但仍盈利潛力。
亞太地區是成長最快的地區,預計到2031年將以18.76%的年複合成長率(CAGR)。中國正將巨大的國內需求與垂直整合的供應鏈結合,大幅縮短交貨時間。 「中國製造2025」計畫下的政府補貼鼓勵國內品牌出口東南亞和中東,加劇了它們在其他地區的競爭。在新加坡,一項多機構聯合競標展示了機器人技術在公共場所的可靠性;在日本,隨著人口老化,為減輕護理人員的負擔,對輔助設備的需求不斷成長。澳洲和韓國仍然是高階機型的早期採用者,而印度則以面向都市區中產階級家庭的成本績效產品進入市場。
儘管監管嚴格,歐洲市場仍維持穩定成長。德國和法國憑藉著嚴格的衛生標準,在工業和酒店業應用方面發揮主導作用。在英國,旅館業扮演著主導角色,儘管關稅不確定性,機場和零售業的部署仍在成長。符合歐盟機械指令2006/42/EC和EN 60335安全標準系列的要求增加了認證成本,這使得擁有充足測試預算的成熟品牌更具優勢。能源成本和勞動力短缺持續推動自動化投資,該地區的清潔機器人市場佔有率保持兩位數成長。
其他福利:
- Excel格式的市場預測(ME)表
- 分析師支持(3個月)
目錄
第1章 引言
- 研究假設和市場定義
- 調查範圍
第2章調查方法
第3章執行摘要
第4章 市場環境
- 市場概覽
- 市場促進因素
- 疫情後如何提高商業場所的衛生標準
- 智慧家庭的快速普及和可支配收入的成長
- LiDAR和感測器套件的平均售價降低,從而降低了物料清單成本。
- 電子商務通路的擴張加速了全球擴張
- 設施管理合約轉向機器人即服務(RaaS)
- 政府採購用於公共基礎設施的紫外線消毒機器人
- 市場限制
- 與傳統設備相比,初始成本較高
- 關於攝影機/VSLAM地圖的資料隱私問題
- 固體LiDAR組件供應鏈中的脆弱性
- 對中國機器人出口徵收新的貿易關稅
- 產業價值鏈分析
- 監管環境
- 技術展望
- 波特五力分析
- 供應商的議價能力
- 買方的議價能力
- 新進入者的威脅
- 替代品的威脅
- 競爭對手之間的競爭
- 對宏觀經濟趨勢的市場評估
第5章 市場規模與成長預測
- 按類型
- 家用機器人
- 吸塵器
- 泳池清潔
- 窗戶清潔
- 草坪護理
- 其他家務/家庭清潔
- 商用機器人
- 地板清潔
- 儲槽/管/管道清洗
- 消毒機器人
- 其他專業清潔
- 家用機器人
- 最終用戶
- 住宅
- 商業的
- 飯店業
- 零售和購物中心
- 醫療設施
- 機場和交通樞紐
- 辦公室和企業設施
- 其他商業設施
- 工業(製造業和倉儲業)
- 透過導航技術
- LiDAR SLAM
- 視覺SLAM(vSLAM)
- 混合式(雷射雷達+視覺)
- 隨機/紅外線
- AI感測器融合套件
- 其他導航技術
- 按銷售管道
- 線上
- 離線
- 按地區
- 北美洲
- 美國
- 加拿大
- 墨西哥
- 南美洲
- 巴西
- 阿根廷
- 其他南美洲
- 歐洲
- 德國
- 英國
- 法國
- 義大利
- 西班牙
- 其他歐洲地區
- 亞太地區
- 中國
- 日本
- 印度
- 新加坡
- 韓國
- 澳洲
- 亞太其他地區
- 中東和非洲
- 中東
- 沙烏地阿拉伯
- 阿拉伯聯合大公國
- 土耳其
- 其他中東地區
- 非洲
- 南非
- 奈及利亞
- 其他非洲地區
- 中東
- 北美洲
第6章 競爭情勢
- 市場集中度
- 策略趨勢
- 市佔率分析
- 公司簡介
- iRobot Corporation
- Ecovacs Robotics Co., Ltd.
- Roborock Technology Co., Ltd.
- Neato Robotics Inc.
- Dreame Technology(Suzhou)Co., Ltd.
- Narwal Robotics Inc.
- SharkNinja Operating LLC
- ILIFE Innovation Ltd.
- Cecotec Innovaciones SL
- bObsweep Inc.
- Proscenic Technology Co., Ltd.
- Anker Innovations Ltd.(Eufy)
- SoftBank Robotics Corp.
- Tennant Company
- Alfred Karcher SE and Co. KG
- Nilfisk A/S
- Avidbots Corp.
- Gaussian Robotics Co., Ltd.(Gausium)
- Midea Group Co., Ltd.(Eureka)
- Tineco Intelligent Technology Co., Ltd.
第7章 市場機會與未來展望
The cleaning robot market is expected to grow from USD 16.89 billion in 2025 to USD 19.98 billion in 2026 and is forecast to reach USD 46.27 billion by 2031 at 18.29% CAGR over 2026-2031.
Strong demand for touch-free hygiene solutions, rapid smart-home adoption, and sharp declines in sensor bills of material continue to propel the cleaning robot market. Commercial property managers increasingly view autonomous cleaning as mission-critical for labor optimization, while residential buyers benefit from lower LiDAR prices and easy e-commerce access. Supply-side economies of scale in solid-state LiDAR, coupled with robots-as-a-service subscriptions, further expand the cleaning robot market by lowering ownership barriers. Intensifying competition from vertically integrated Asian manufacturers is compressing margins, yet it also accelerates product variety and regional availability.
Global Cleaning Robot Market Trends and Insights
Rising Post-Pandemic Hygiene Standards in Commercial Spaces
Most public and private facilities have institutionalized COVID-19-era cleaning protocols, sustaining demand for autonomous floor-care and UV-C disinfection robots. Airports that run robots overnight report measurable labor savings and better passenger confidence. Singapore's public-sector tenders for large fleets of autonomous cleaners underscore the government's endorsement of continuous hygiene programs. Healthcare operators also lean on ISO 13482-certified models to mitigate infection risks without adding staff. Sustained regulatory attention and user expectations together keep the cleaning robot market on a high-growth path.
Rapid Smart-Home Penetration and Disposable-Income Growth
Smart-home hubs now synchronize scheduling, voice control, and remote diagnostics for floor-care bots, elevating them from gadgets to integral home-automation nodes. Matter-certified devices from leading vendors remove interoperability friction and broaden the addressable base. In China, India, and Southeast Asia, rising middle-class income fuels premium purchases that bundle AI-based obstacle recognition and hybrid navigation. These dynamics continue to funnel new users into the cleaning robot market.
High Upfront Cost vs Conventional Equipment
Small businesses still hesitate to replace USD 50-200 manual tools with bots priced from USD 300 to USD 3,000. Even at Heathrow, where robots saved GBP 124,175 (USD 155,219) in annual labor, board-level approval required proof of sub-two-year payback. Robots-as-a-service mitigates sticker shock by converting capex into opex, but vendors must manage battery depreciation and redeployment risk to keep contracts attractive.
Other drivers and restraints analyzed in the detailed report include:
- Falling LiDAR and Sensor ASPs Reduce Bill of Materials
- E-Commerce Channel Scaling Accelerates Global Reach
- Data-Privacy Concerns Over Camera/VSLAM Mapping
For complete list of drivers and restraints, kindly check the Table Of Contents.
Segment Analysis
Domestic units, notably floor-vacuum robots, held a commanding 71.32% share of the cleaning robot market size in 2025. Consistent price erosion and frequent model refreshes keep household demand buoyant, while niche segments, such as pool and window cleaners, remain smaller yet stable. In contrast, professional robots are expected to book an 18.42% CAGR, driven by measurable ROI and rising labor costs in facility maintenance. Disinfection models are outpacing all others, thanks in part to hospital mandates for ultraviolet or plasma sterilization. Commercial buyers also value ruggedized chassis, replaceable batteries, and certified ingress protection for wet environments. Vendor differentiation is increasingly centered on fleet-management dashboards and predictive-maintenance data analytics that reduce unplanned downtime. Extended service contracts further improve the total cost of ownership, solidifying professional adoption pathways. Despite higher acquisition prices, payback periods are shrinking, tilting procurement toward autonomous solutions across various industries, including rail stations, shopping malls, and government buildings.
The domestic sphere continues to benefit from feature spillovers originally developed for professional fleets, such as multi-floor mapping and adaptive suction. Hybrids capable of wet and dry cleaning broaden household appeal, while subscription consumable deliveries lock customers into branded ecosystems. Regulatory attention is minimal in residential contexts, accelerating time-to-market for new features. Overall, both domains reinforce each other: the consumer scale reduces hardware costs, while commercial ASPs finance advanced R&D, sustaining a virtuous cycle for the cleaning robot market.
Residential users accounted for 57.41% of 2025 revenue, reflecting the widespread adoption of smart-home integration and word-of-mouth advocacy. Yet hospitals, clinics, and elder-care centers are the fastest movers with an 18.55% CAGR. Infection-prevention budgets justify premium pricing for UV-C or hydrogen-peroxide disinfection robots that operate after visiting hours. Facility managers cite consistent pathogen load reduction and enhanced staff safety as prime purchase triggers. Retail chains, hotels, and restaurants now deploy smaller fleets to maintain service ambiance amid staffing shortages. Airports leverage 24-hour robot operation to match passenger peaks without overtime premiums. Offices experimenting with flexible occupancy adopt on-demand cleaning triggered by IoT occupancy sensors.
Industrial plants and warehouses seek ATEX-certified units that safely handle dust and volatile chemicals, a niche yet high-margin segment of the cleaning robot market. As end-users diversify, vendors must tailor payload capacity, navigation algorithms, and antimicrobial material choices to distinct use cases, reinforcing segmentation complexity.
The Cleaning Robot Market is Segmented by Type (Domestic/Household Robots, Professional Robots), End-User (Residential, Commercial, Industrial), Navigation Technology (LiDAR SLAM, Visual SLAM, Hybrid, Random/Infrared, AI Sensor-Fusion), Sales Channel (Online, Offline), and Geography (North America, South America, Europe, Asia Pacific, Middle East and Africa). The Market Forecasts are Provided in Terms of Value (USD).
Geography Analysis
North America retained a 39.45% revenue share in 2025, led by the United States government's procurement of autonomous floor cleaners for airports, transit hubs, and schools. Hospitals in California and New York accelerated rollouts after quantifying reductions in hospital-acquired infections. Canada's regulatory alignment and proximity to U.S. vendors smooth cross-border expansion, while Mexico's maquiladora clusters attract assembly investments that hedge tariff exposure. Growth here now stems less from first-time purchases and more from refresh cycles and service contracts, signaling a maturing yet lucrative segment of the cleaning robot market.
The Asia-Pacific region is the fastest climber, with a 18.76% CAGR outlook to 2031. China blends massive domestic demand with vertically integrated supply chains, slashing delivery lead times. Government subsidies under the "Made in China 2025" initiative encourage domestic brands to export across Southeast Asia and the Middle East, thereby increasing competitive pressure elsewhere. Singapore's multi-agency tenders validate the credibility of robotics in public settings, while Japan's aging demographics elevate demand for caregiver adjuncts that relieve nursing staff. Australia and South Korea remain early adopters of premium models, whereas India is entering the market through value-oriented SKUs targeting urban middle-class households.
Europe demonstrates steady but regulation-heavy growth. Germany and France champion industrial and hospitality applications, leveraging stringent hygiene norms. The United Kingdom's service-sector dominance drives airport and retail deployments, even amid tariff uncertainties. Compliance with the EU Machinery Directive 2006/42/EC and the EN 60335 family of safety standards adds certification overhead, favoring established brands with deep testing budgets. Energy costs and tight labor pools continue to motivate automation investment, maintaining double-digit growth in the region's slice of the cleaning robot market.
- iRobot Corporation
- Ecovacs Robotics Co., Ltd.
- Roborock Technology Co., Ltd.
- Neato Robotics Inc.
- Dreame Technology (Suzhou) Co., Ltd.
- Narwal Robotics Inc.
- SharkNinja Operating LLC
- ILIFE Innovation Ltd.
- Cecotec Innovaciones S.L.
- bObsweep Inc.
- Proscenic Technology Co., Ltd.
- Anker Innovations Ltd. (Eufy)
- SoftBank Robotics Corp.
- Tennant Company
- Alfred Karcher SE and Co. KG
- Nilfisk A/S
- Avidbots Corp.
- Gaussian Robotics Co., Ltd. (Gausium)
- Midea Group Co., Ltd. (Eureka)
- Tineco Intelligent Technology Co., Ltd.
Additional Benefits:
- The market estimate (ME) sheet in Excel format
- 3 months of analyst support
TABLE OF CONTENTS
1 INTRODUCTION
- 1.1 Study Assumptions and Market Definition
- 1.2 Scope of the Study
2 RESEARCH METHODOLOGY
3 EXECUTIVE SUMMARY
4 MARKET LANDCSAPE
- 4.1 Market Overview
- 4.2 Market Drivers
- 4.2.1 Rising post-pandemic hygiene standards in commercial spaces
- 4.2.2 Rapid smart-home penetration and disposable-income growth
- 4.2.3 Falling LiDAR and sensor?suite ASPs reduce BOM cost
- 4.2.4 E-commerce channel scaling accelerates global reach
- 4.2.5 Facility-management contracts shifting to robots-as-a-service
- 4.2.6 Government procurement of UV-disinfection bots for public infrastructure
- 4.3 Market Restraints
- 4.3.1 High upfront cost vs. conventional equipment
- 4.3.2 Data-privacy concerns over camera/VSLAM mapping
- 4.3.3 Supply-chain fragility for solid-state LiDAR components
- 4.3.4 Emerging trade tariffs on Chinese robot exports
- 4.4 Industry Value Chain Analysis
- 4.5 Regulatory Landscape
- 4.6 Technological Outlook
- 4.7 Porter's Five Forces Analysis
- 4.7.1 Bargaining Power of Suppliers
- 4.7.2 Bargaining Power of Buyers
- 4.7.3 Threat of New Entrants
- 4.7.4 Threat of Substitutes
- 4.7.5 Intensity of Competitive Rivalry
- 4.8 Assessment of Macro-economic Trends on the Market
5 MARKET SIZE AND GROWTH FORECASTS (VALUE)
- 5.1 By Type
- 5.1.1 Domestic / Household Robots
- 5.1.1.1 Vacuum Floor Cleaner
- 5.1.1.2 Pool Cleaning
- 5.1.1.3 Window Cleaning
- 5.1.1.4 Lawn Cleaning
- 5.1.1.5 Other Domestic/Household Cleaning
- 5.1.2 Professional Robots
- 5.1.2.1 Floor Cleaning
- 5.1.2.2 Tank / Tube / Pipe Cleaning
- 5.1.2.3 Disinfection Robots
- 5.1.2.4 Other Professional Cleaning
- 5.1.1 Domestic / Household Robots
- 5.2 By End-User
- 5.2.1 Residential
- 5.2.2 Commercial
- 5.2.2.1 Hospitality
- 5.2.2.2 Retail and Shopping Centres
- 5.2.2.3 Healthcare Facilities
- 5.2.2.4 Airports and Transportation Hubs
- 5.2.2.5 Office and Corporate Facilities
- 5.2.2.6 Other Commercial Facilities
- 5.2.3 Industrial (Manufacturing and Warehousing)
- 5.3 By Navigation Technology
- 5.3.1 LiDAR SLAM
- 5.3.2 Visual SLAM (vSLAM)
- 5.3.3 Hybrid (LiDAR + Vision)
- 5.3.4 Random / Infra-red Based
- 5.3.5 AI Sensor-Fusion Suites
- 5.3.6 Other Navigation Technologies
- 5.4 By Sales Channel
- 5.4.1 Online
- 5.4.2 Offline
- 5.5 By Geography
- 5.5.1 North America
- 5.5.1.1 United States
- 5.5.1.2 Canada
- 5.5.1.3 Mexico
- 5.5.2 South America
- 5.5.2.1 Brazil
- 5.5.2.2 Argentina
- 5.5.2.3 Rest of South America
- 5.5.3 Europe
- 5.5.3.1 Germany
- 5.5.3.2 United Kingdom
- 5.5.3.3 France
- 5.5.3.4 Italy
- 5.5.3.5 Spain
- 5.5.3.6 Rest of Europe
- 5.5.4 Asia Pacific
- 5.5.4.1 China
- 5.5.4.2 Japan
- 5.5.4.3 India
- 5.5.4.4 Singapore
- 5.5.4.5 South korea
- 5.5.4.6 Australia
- 5.5.4.7 Rest of Asia Pacific
- 5.5.5 Middle East and Africa
- 5.5.5.1 Middle East
- 5.5.5.1.1 Saudi Arabia
- 5.5.5.1.2 United Arab Emirates
- 5.5.5.1.3 Turkey
- 5.5.5.1.4 Rest of Middle East
- 5.5.5.2 Africa
- 5.5.5.2.1 South Africa
- 5.5.5.2.2 Nigeria
- 5.5.5.2.3 Rest of Africa
- 5.5.5.1 Middle East
- 5.5.1 North America
6 COMPETITIVE LANDSCAPE
- 6.1 Market Concentration
- 6.2 Strategic Moves
- 6.3 Market Share Analysis
- 6.4 Company Profiles (includes Global level Overview, Market level overview, Core Segments, Financials as available, Strategic Information, Market Rank/Share for key companies, Products and Services, and Recent Developments)
- 6.4.1 iRobot Corporation
- 6.4.2 Ecovacs Robotics Co., Ltd.
- 6.4.3 Roborock Technology Co., Ltd.
- 6.4.4 Neato Robotics Inc.
- 6.4.5 Dreame Technology (Suzhou) Co., Ltd.
- 6.4.6 Narwal Robotics Inc.
- 6.4.7 SharkNinja Operating LLC
- 6.4.8 ILIFE Innovation Ltd.
- 6.4.9 Cecotec Innovaciones S.L.
- 6.4.10 bObsweep Inc.
- 6.4.11 Proscenic Technology Co., Ltd.
- 6.4.12 Anker Innovations Ltd. (Eufy)
- 6.4.13 SoftBank Robotics Corp.
- 6.4.14 Tennant Company
- 6.4.15 Alfred Karcher SE and Co. KG
- 6.4.16 Nilfisk A/S
- 6.4.17 Avidbots Corp.
- 6.4.18 Gaussian Robotics Co., Ltd. (Gausium)
- 6.4.19 Midea Group Co., Ltd. (Eureka)
- 6.4.20 Tineco Intelligent Technology Co., Ltd.
7 MARKET OPPORTUNITIES AND FUTURE OUTLOOK
- 7.1 White-space and Unmet-Need Assessment
 自主清潔機器人市場預測至2034年—全球產品類型、操作方式、導航方式、電池類型、銷售管道、應用領域、最終用戶和區域分析
 智慧清潔與衛生市場規模、佔有率、趨勢及預測:按產品、應用和地區分類,2026-2034年
 2026-2030年全球機器人擦窗機市場
 清潔機器人市場:2026-2032年全球市場預測(按產品類型、控制系統、技術、改進、應用和分銷管道分類)泳池清潔機器人市場預測至2034年:全球分析(按泳池類型、動力來源、清潔類型、驅動機制、分銷管道、最終用戶和地區分類)清潔設備及用品市場:2026-2032年全球市場預測(依產品類型、材料類型、應用、最終用戶及通路分類)智慧家庭清潔機器人市場:按機器人類型、連接方式、技術、應用和銷售管道-2026-2032年全球預測游泳池清潔機器人市場按產品類型、最終用戶、泳池類型、分銷管道、驅動機制和電源分類,全球預測(2026-2032年)
 商用清潔用品市場機會、成長要素、產業趨勢分析及2026年至2035年預測
 全球窗戶清潔機器人市場規模、佔有率、趨勢和成長分析報告(2026-2034年)