


 |
市場調查報告書
商品編碼
1940568
資料中心交換器:市場佔有率分析、產業趨勢與統計、成長預測(2026-2031)Data Center Switch - Market Share Analysis, Industry Trends & Statistics, Growth Forecasts (2026 - 2031) |
||||||
※ 本網頁內容可能與最新版本有所差異。詳細情況請與我們聯繫。
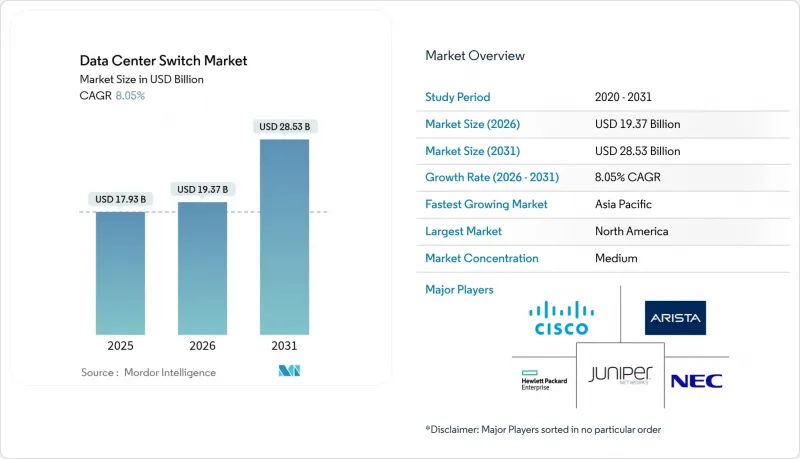
2025年資料中心交換器市值為179.3億美元,預計到2031年將達到285.3億美元,高於2026年的193.7億美元。
預計在預測期(2026-2031 年)內,複合年成長率將達到 8.05%。
人工智慧訓練叢集的日益普及、雲端原生工作負載的穩定成長以及超大規模園區的快速擴張,持續推動著對高頻寬交換基礎設施的資本投資。從三層架構到葉脊式架構的轉變,使網路拓撲結構趨於扁平化,從而實現了低延遲和可預測的平行處理效能。乙太網路晶片的創新使得每個裝置的連接埠密度超過 51.2 Tbps,降低了每Gigabit的功耗,並促進了 400G 和 800G光學模組的普及。資料居住的監管要求推動了區域容量的成長,而邊緣設施的擴展則催生了對緊湊型、可遠端系統管理且面積有限的交換機的額外需求。隨著垂直整合的供應商將晶片、光學模組和軟體捆綁銷售,以縮短引進週期並簡化操作,市場競爭日益激烈。
全球資料中心交換器市場趨勢與洞察
雲端運算和邊緣運算工作負載正在爆炸式成長
處理 5G、物聯網和即時分析工作負載的邊緣站點數量激增,推動了對可在空間受限機架中運行的緊湊型高吞吐量交換機的需求。超大規模資料中心業者目前正在設計區域邊緣節點,以向消費級應用提供低於 10 毫秒的延遲,這使得交換器硬體需要在惡劣且通常無人值守的環境中運行。可程式傳輸平面允許業者在城域邊緣和核心園區之間動態地引導流量,而無需手動重新佈線。基於硬體的、時間敏感型網路功能也有助於支援需要確定性延遲的工業機器人和自動駕駛車輛。隨著邊緣面積的擴大,多租用戶託管服務供應商正在增加冗餘存取層,從而擴大低功耗交換器的潛在市場規模。
需要高頻寬交換的AI/ML訓練叢集
訓練大規模語言模型產生的東向流量是標準資料中心流量模式的 24 到 32 倍。超大規模營運商正在部署 102.4 Tbps 的 ASIC 晶片,這些晶片能夠維護 GPU 之間的單跳路徑,並採用擁塞控制演算法來確保近乎零丟包率。供應商正在試驗鏈路級遙測技術,以預測微突發流量並在微秒內重新路由資料流。初步現場試驗表明,在同一網路架構中用 400G 鏈路替換 100G 鏈路後,模型訓練時間縮短了 1.6 倍。由於 GPU 利用率的提高,這種效能提升轉化為數百萬美元的成本節約,進一步強化了部署高速交換器的商業價值。
下一代交換器升級需要高額的資本支出(CAPEX)和營運支出(OPEX)。
從 10G 或 40G 升級到 400G 不僅需要新的交換機,還需要高等級的光纖、更大的功率和更先進的冷卻系統,這使得企業級網路建設的總計劃從 1000 萬美元飆升至 5 億美元。由於許多中型企業推遲了網路升級,轉而從託管服務提供商處租賃容量,交換機的直接銷售速度有所放緩。隨著連接埠速度的提升,電力消耗也隨之增加,持續營運成本也隨之上升,儘管新一代 ASIC 晶片的效率提昇在一定程度上抵消了這一成本。對於財富 500 強以外的預算緊張型企業而言,資金籌措障礙仍然是最大的挑戰。
細分市場分析
到2025年,核心交換器將佔據資料中心交換器市場佔有率的47.35%,這主要歸功於它們在超大規模園區內聚合數千條葉鏈路的作用。對於需要在數萬台伺服器上實現確定性延遲的橫向擴展架構而言,核心交換器仍然至關重要。隨著人工智慧工作負載對高半徑架構的需求日益成長,基於底盤的設計也越來越受歡迎,因此核心平台相關的資料中心交換器市場規模預計將穩步擴大。儘管接取交換器的單位成本較低,但由於邊緣節點和微型資料中心的激增,預計其複合年成長率將達到8.86%,成為成長最快的交換器。供應商正在將深度緩衝和設備端分析功能整合到存取設備中,使營運商能夠在網路邊緣實施服務品質(QoS)策略。新興市場正在推動低功耗接入模式的部署,即使在電力供應薄弱的地區也能實現。整體成長模式呈現雙軌演進:超大規模環境中的高價值核心交換器更新周期與分散式設施中的大批量存取交換器銷售並行。
到2025年,100GbE交換器將維持38.40%的資料中心交換器市場佔有率,這反映了其在主流工作負載方面出色的成本績效。然而,隨著人工智慧叢集對無阻塞網路架構的需求超過400G超額訂閱閾值,800GbE設備的資料中心交換器市場規模預計將快速成長。初步試點計畫表明,800GbE主幹網和400GbE葉網的組合,憑藉其高頻寬二分特性,可以將生成模型訓練時間縮短30%。早期升級用戶,例如高效能運算中心和金融交易所,對200-400GbE的需求依然強勁。同時,隨著伺服器網路卡速度的提升,傳統的10GbE及以下網路卡的出貨量持續下降,產業需求正轉向更高速度的網路卡。
區域分析
北美地區是全球最大的區域收入來源,這得益於持續的超大規模擴張、充裕的資本以及有利於數位基礎設施的政策框架。主要雲端服務供應商繼續在維吉尼亞和俄亥俄州建置數吉瓦的資料中心。根據《晶片法案》(CHIPS Act),國內半導體激勵措施旨在實現ASIC晶片的在地化生產,並減少對海外晶圓廠的依賴。加拿大和墨西哥正吸引尋求可再生能源和稅收優惠的營運商進行二次建設,以提供冗餘和延遲分散功能。
亞太地區預計將維持最高的整體成長率,到2030年資料中心容量將翻倍。中國市場仍佔據主導地位,但嚴格的數據本地化法規使跨境雲端設計變得複雜。印度正在加強其製造業基礎,像Arista這樣的供應商推出組裝以縮短供應鏈並避免關稅。日本和韓國正在投資延長海底電纜,並探索液冷技術以管理人口密集都市區的部署。該地區監管環境的多樣性要求供應商根據每個國家的具體情況調整合規能力。
數位主權是歐洲關注的焦點,84% 的企業正在尋求區域化雲端解決方案。雖然 FLAPD 都會區將吸收大部分新增兆瓦容量,但北歐國家憑藉其豐富的可再生能源資源吸引著營運商。本地供應商正將合規認證作為差異化優勢。在中東和非洲,基礎設施的快速擴張與國家人工智慧策略相契合,其中阿拉伯聯合大公國和沙烏地阿拉伯主導,為外國超大規模資料中心業者營運商提供數十億美元的激勵措施和優惠的房地產條款。嚴酷的氣候條件正在加速液冷技術的應用,以維持能源效率。
其他福利:
- Excel格式的市場預測(ME)表
- 3個月的分析師支持
目錄
第1章 引言
- 研究假設和市場定義
- 調查範圍
第2章調查方法
第3章執行摘要
第4章 市場情勢
- 市場概覽
- 市場促進因素
- 雲端運算和邊緣運算工作負載的爆炸性成長
- 人工智慧/機器學習訓練叢集對高頻寬交換的需求
- 資料居住義務和主權雲
- 400G/800G光纖技術將推動每個連接埠成本(美元/Gb)的下降。
- 資料中心去中心化和開放式網路的採用
- 採用液冷技術的超高密度開關
- 市場限制
- 下一代交換器升級需要高額的資本支出(CAPEX)和營運支出(OPEX)。
- 葉脊結構管理技能短缺
- 先進ASIC晶片供應鏈中斷
- 5nm/3nm晶片生產監管方面的延誤
- 價值/供應鏈分析
- 監管環境
- 技術展望
- 波特五力模型
- 買方的議價能力
- 供應商的議價能力
- 新進入者的威脅
- 替代品的威脅
- 競爭對手之間的競爭
- 技術概述
- 頻寬
- 交換技術
第5章 市場規模與成長預測
- 按開關類型
- 核心交換機
- 配電開關
- 存取交換機
- 按頻寬等級
- 10 GbE 或更低
- 25-100 GbE
- 100-200 GbE
- 200-400 GbE
- 800 GbE 以上
- 透過技術
- Ethernet
- Fiber Channel
- InfiniBand
- 依資料中心類型
- 超大規模雲端供應商
- 託管服務提供者
- 企業/本地部署
- 按最終用戶行業分類
- 資訊科技/通訊
- BFSI
- 政府/國防
- 醫療保健和生命科學
- 媒體與娛樂
- 零售與電子商務
- 教育/研究
- 按地區
- 北美洲
- 美國
- 加拿大
- 墨西哥
- 南美洲
- 巴西
- 南美洲其他地區
- 歐洲
- 英國
- 德國
- 法國
- 義大利
- 其他歐洲地區
- 亞太地區
- 中國
- 日本
- 印度
- 韓國
- 亞太其他地區
- 中東和非洲
- 中東
- 沙烏地阿拉伯
- 阿拉伯聯合大公國
- 土耳其
- 其他中東地區
- 非洲
- 南非
- 其他非洲地區
- 中東
- 北美洲
第6章 競爭情勢
- 市佔率分析
- 公司簡介
- Cisco Systems, Inc.
- Arista Networks, Inc.
- Juniper Networks, Inc.
- Hewlett Packard Enterprise Development LP
- Dell Technologies, Inc.
- Huawei Technologies Co., Ltd.
- H3C Holding Limited
- Lenovo Group Limited
- NEC Corporation
- Extreme Networks, Inc.
- NVIDIA Corporation(Mellanox and Cumulus)
- Fortinet, Inc.
- Broadcom Inc.
- ZTE Corporation
- Quanta Cloud Technology
- D-Link Corporation
- Edgecore Networks(Accton)
- Super Micro Computer, Inc.
- Pluribus Networks, Inc.
- Silicom Ltd.
- Netgear, Inc.
- Chelsio Communications, Inc.
第7章 市場機會與未來展望
The data center switches market was valued at USD 17.93 billion in 2025 and estimated to grow from USD 19.37 billion in 2026 to reach USD 28.53 billion by 2031, at a CAGR of 8.05% during the forecast period (2026-2031).
Rising deployment of artificial-intelligence training clusters, steady migration toward cloud-native workloads, and rapid scaling of hyperscale campuses continue to drive capital spending on high-bandwidth switch infrastructure. The shift from three-tier to leaf-spine fabrics is flattening network topologies, enabling lower latency and more predictable performance for parallel processing. Ethernet silicon innovation is pushing port density past 51.2 Tbps per device, trimming power draw per gigabit and widening adoption of 400G and 800G optics. Regulatory mandates on data residency spur in-region capacity additions, while expanding edge facilities create incremental demand for compact, remotely managed switches that can tolerate constrained footprints. Competitive intensity is heightening as vertically integrated vendors bundle silicon, optics, and software to shorten deployment cycles and simplify operations.
Global Data Center Switch Market Trends and Insights
Cloud and Edge Computing Workload Surge
Edge sites that process 5G, IoT, and real-time analytics workloads are proliferating, boosting demand for compact, high-throughput switches able to function in space-limited racks. Hyperscalers now design regional edge nodes to keep latency under 10 milliseconds for consumer applications, which places switch hardware in harsh, often unmanned locations. Programmable forwarding planes allow operators to steer traffic dynamically between metro edge and core campuses without manual recabling. Hardware-based time-sensitive networking features also help support industrial robots and autonomous vehicles that require deterministic latency. As edge footprints grow, multi-tenant colocation providers are adding redundant access layers, enlarging the addressable pool for low-power switches.
AI/ML Training Clusters Requiring High-Bandwidth Switching
Training large language models generates east-west traffic that is 24-32 times higher than standard data-center traffic patterns. Hyperscale operators therefore deploy 102.4 Tbps ASICs that maintain single-hop paths between GPUs, while congestion-control algorithms keep packet loss near zero. Vendors experiment with link-level telemetry to predict micro-bursts and reroute flows within micro-seconds. Early field results show a 1.6 times reduction in model training duration when 400G links replace 100G links in the same fabric. These performance gains translate into millions of dollars in GPU utilization savings, reinforcing the ROI for faster switches.
High CAPEX and OPEX for Next-Gen Switch Upgrades
Upgrading from 10G or 40G to 400G demands not just new switches but also higher-grade fiber, power upgrades, and advanced cooling, pushing total project budgets from USD 10 million to USD 500 million for enterprise-scale builds. Many mid-size firms postpone overhauls and instead lease capacity from colocation providers, slowing direct switch sales. Ongoing operating expenses rise as higher port speeds increase electricity draw, although newer ASICs partially offset this through efficiency gains. Financing hurdles remain most acute for budget-constrained organizations outside the Fortune 500.
Other drivers and restraints analyzed in the detailed report include:
- Mandates on Data Residency and Sovereign Clouds
- 400G/800G Optics Driving Port USD/Gb Down
- Skills Shortage in Managing Leaf-Spine Fabrics
For complete list of drivers and restraints, kindly check the Table Of Contents.
Segment Analysis
Core switches accounted for 47.35% of the data center switches market share in 2025 due to their role in aggregating thousands of leaf links within hyperscale campuses. They remain essential for scale-out fabrics that demand deterministic latency across tens of thousands of servers. The data center switches market size associated with core platforms is projected to expand steadily as AI workloads require higher radix architectures that favor chassis-based designs. Access switches, while smaller ticket items, post the highest 8.86% CAGR as edge nodes and micro data centers proliferate. Vendors integrate deep buffering and on-device analytics into access gear, letting operators enforce quality-of-service policies at the network edge. In emerging markets, low-power access models enable deployments where utility grids remain fragile. The combined growth pattern shows a dual-track evolution, with high-value core refresh cycles in hyperscale settings and high-volume access sales in distributed estates.
The 100 GbE segment retained 38.40% data center switches market share in 2025, reflecting its favorable cost-performance trade-off for mainstream workloads. Yet the data center switches market size for 800 GbE gear is projected to rise sharply as AI clusters require non-blocking fabrics that exceed 400G oversubscription thresholds. Early pilots demonstrate that 800 GbE spines paired with 400 GbE leaves reduce training time for generative models by 30% through higher bisectional bandwidth. Customer interest in 200-400 GbE remains healthy among HPC centers and financial exchanges that upgraded earlier. Meanwhile, legacy <=10 GbE shipments continue to taper as server NIC speeds climb, further tilting industry demand toward high-speed segments.
The Data Center Switch Market is Segmented by Switch Type (Core Switches, Access Switches, and More), Bandwidth Class (<=10 GbE, 25-100 GbE, and More), Switching Technology (Ethernet, Infiniband, and More), Data Center Type (Hyperscale Cloud, Colocation, and More), End-User Industry (IT and Telecom, BFSI, and More), and Geography (North America, Europe, and More). The Market Forecasts are Provided in Terms of Value (USD).
Geography Analysis
North America accounts for the largest regional revenue thanks to sustained hyperscale expansion, abundant capital, and supportive digital-infrastructure policy frameworks. Major cloud providers continue to break ground on multi-giga-watt campuses across Virginia and Ohio. Domestic semiconductor incentives under the CHIPS Act aim to localize ASIC production, reducing dependence on overseas fabs. Canada and Mexico attract secondary builds as operators seek renewable energy and tax incentives, providing redundancy and latency diversification.
Asia-Pacific registers the fastest aggregate growth, with data center capacity expected to double before 2030. China's market remains dominant yet constrained by strict data-localization rules that complicate cross-border cloud designs. India gains manufacturing traction as vendors such as Arista launch assembly lines that shorten supply chains and bypass tariffs. Japan and South Korea invest in submarine cable extensions and liquid-cooling research to manage dense urban deployments. Regulatory diversity across the region forces vendors to tailor compliance features on a country-by-country basis.
Europe centers on digital sovereignty, with 84% of enterprises pursuing region-bound cloud solutions. The FLAPD metros absorb most new megawatt additions, yet Nordic states lure operators with abundant renewable power. Local vendors emphasize compliance certifications as differentiators. Middle East and Africa witness rapid build-out aligned with national AI strategies. The United Arab Emirates and Saudi Arabia lead, offering multi-billion-dollar incentives and favorable real-estate terms to foreign hyperscalers. Harsh climates accelerate adoption of liquid-cooling to maintain energy efficiency.
- Cisco Systems, Inc.
- Arista Networks, Inc.
- Juniper Networks, Inc.
- Hewlett Packard Enterprise Development LP
- Dell Technologies, Inc.
- Huawei Technologies Co., Ltd.
- H3C Holding Limited
- Lenovo Group Limited
- NEC Corporation
- Extreme Networks, Inc.
- NVIDIA Corporation (Mellanox and Cumulus)
- Fortinet, Inc.
- Broadcom Inc.
- ZTE Corporation
- Quanta Cloud Technology
- D-Link Corporation
- Edgecore Networks (Accton)
- Super Micro Computer, Inc.
- Pluribus Networks, Inc.
- Silicom Ltd.
- Netgear, Inc.
- Chelsio Communications, Inc.
Additional Benefits:
- The market estimate (ME) sheet in Excel format
- 3 months of analyst support
TABLE OF CONTENTS
1 INTRODUCTION
- 1.1 Study Assumptions and Market Definition
- 1.2 Scope of the Study
2 RESEARCH METHODOLOGY
3 EXECUTIVE SUMMARY
4 MARKET LANDSCAPE
- 4.1 Market Overview
- 4.2 Market Drivers
- 4.2.1 Cloud and Edge Computing Workload Surge
- 4.2.2 AI/ML Training Clusters Requiring High-Bandwidth Switching
- 4.2.3 Mandates on Data Residency and Sovereign Clouds
- 4.2.4 400G / 800G Optics Driving Port $/Gb Down
- 4.2.5 Data-Center Disaggregation and Open Networking Adoption
- 4.2.6 Liquid-Cooling-Enabled Ultra-Dense Switching
- 4.3 Market Restraints
- 4.3.1 High CAPEX and OPEX for Next-Gen Switch Upgrades
- 4.3.2 Skills Shortage in Managing Leaf-Spine Fabrics
- 4.3.3 Supply-Chain Disruptions for Advanced ASICs
- 4.3.4 Regulatory Delays in 5 nm / 3 nm Chip Production
- 4.4 Value / Supply-Chain Analysis
- 4.5 Regulatory Landscape
- 4.6 Technological Outlook
- 4.7 Porter's Five Forces
- 4.7.1 Bargaining Power of Buyers
- 4.7.2 Bargaining Power of Suppliers
- 4.7.3 Threat of New Entrants
- 4.7.4 Threat of Substitute Products
- 4.7.5 Intensity of Competitive Rivalry
- 4.8 Technology Snapshot
- 4.8.1 Bandwidth
- 4.8.2 Switching Technology
5 MARKET SIZE AND GROWTH FORECASTS (VALUE, USD)
- 5.1 By Switch Type
- 5.1.1 Core Switches
- 5.1.2 Distribution Switches
- 5.1.3 Access Switches
- 5.2 By Bandwidth Class
- 5.2.1 <=10 GbE
- 5.2.2 25-100 GbE
- 5.2.3 100-200 GbE
- 5.2.4 200-400 GbE
- 5.2.5 800 GbE and Beyond
- 5.3 By Switching Technology
- 5.3.1 Ethernet
- 5.3.2 Fiber Channel
- 5.3.3 InfiniBand
- 5.4 By Data Center Type
- 5.4.1 Hyperscale Cloud Providers
- 5.4.2 Colocation Providers
- 5.4.3 Enterprise / On-Premise
- 5.5 By End-User Industry
- 5.5.1 IT and Telecom
- 5.5.2 BFSI
- 5.5.3 Government and Defense
- 5.5.4 Healthcare and Life Sciences
- 5.5.5 Media and Entertainment
- 5.5.6 Retail and E-Commerce
- 5.5.7 Education and Research
- 5.6 By Geography
- 5.6.1 North America
- 5.6.1.1 United States
- 5.6.1.2 Canada
- 5.6.1.3 Mexico
- 5.6.2 South America
- 5.6.2.1 Brazil
- 5.6.2.2 Rest of South America
- 5.6.3 Europe
- 5.6.3.1 United Kingdom
- 5.6.3.2 Germany
- 5.6.3.3 France
- 5.6.3.4 Italy
- 5.6.3.5 Rest of Europe
- 5.6.4 Asia-Pacific
- 5.6.4.1 China
- 5.6.4.2 Japan
- 5.6.4.3 India
- 5.6.4.4 South Korea
- 5.6.4.5 Rest of Asia-Pacific
- 5.6.5 Middle East and Africa
- 5.6.5.1 Middle East
- 5.6.5.1.1 Saudi Arabia
- 5.6.5.1.2 United Arab Emirates
- 5.6.5.1.3 Turkey
- 5.6.5.1.4 Rest of Middle East
- 5.6.5.2 Africa
- 5.6.5.2.1 South Africa
- 5.6.5.2.2 Rest of Africa
- 5.6.5.1 Middle East
- 5.6.1 North America
6 COMPETITIVE LANDSCAPE
- 6.1 Market Share Analysis
- 6.2 Company Profiles (includes Global Level Overview, Market Level Overview, Core Segments, Financials as available, Strategic Information, Market Rank/Share for key companies, Products and Services, and Recent Developments)
- 6.2.1 Cisco Systems, Inc.
- 6.2.2 Arista Networks, Inc.
- 6.2.3 Juniper Networks, Inc.
- 6.2.4 Hewlett Packard Enterprise Development LP
- 6.2.5 Dell Technologies, Inc.
- 6.2.6 Huawei Technologies Co., Ltd.
- 6.2.7 H3C Holding Limited
- 6.2.8 Lenovo Group Limited
- 6.2.9 NEC Corporation
- 6.2.10 Extreme Networks, Inc.
- 6.2.11 NVIDIA Corporation (Mellanox and Cumulus)
- 6.2.12 Fortinet, Inc.
- 6.2.13 Broadcom Inc.
- 6.2.14 ZTE Corporation
- 6.2.15 Quanta Cloud Technology
- 6.2.16 D-Link Corporation
- 6.2.17 Edgecore Networks (Accton)
- 6.2.18 Super Micro Computer, Inc.
- 6.2.19 Pluribus Networks, Inc.
- 6.2.20 Silicom Ltd.
- 6.2.21 Netgear, Inc.
- 6.2.22 Chelsio Communications, Inc.
7 MARKET OPPORTUNITIES AND FUTURE OUTLOOK
- 7.1 White-Space and Unmet-Need Assessment
 資料中心交換器市場:按類型、連接埠速度、拓撲結構、最終用戶和應用分類-2026年至2032年全球市場預測
 全球資料中心交換器市場:市場規模、佔有率和趨勢分析(按類型、技術、連接埠速度、最終用途和地區分類),細分市場預測(2026-2033 年)
 資料中心交換器市場分析及預測(至 2035 年):按類型、產品類型、服務、技術、組件、應用、部署類型、最終用戶、安裝類型和解決方案分類
 資料中心交換器市場 - 全球產業規模、佔有率、趨勢、機會、預測:按最終用戶、產品類型、連接埠速度、交換器類型、地區和競爭對手分類,2021-2031 年資料中心白盒交換器市場按產品類型、連接埠速度、功能、架構、外形規格尺寸、連接埠密度、交換容量、應用和最終用戶分類 - 全球預測(2026-2032 年)
 資料中心交換器市場規模、佔有率和成長分析(按交換器類型、技術、最終用戶、頻寬和地區分類)—產業預測(2026-2033 年)
 全球人工智慧(AI)資料中心交換器市場
 資料中心交換器市場:全球產業分析、市場規模、佔有率、成長、趨勢與未來預測(2025-2032)
 2025-2029年全球資料中心交換器市場