


 |
市場調查報告書
商品編碼
1940567
聲學攝影機:市場佔有率分析、行業趨勢和統計數據、成長預測(2026-2031)Acoustic Camera - Market Share Analysis, Industry Trends & Statistics, Growth Forecasts (2026 - 2031) |
||||||
※ 本網頁內容可能與最新版本有所差異。詳細情況請與我們聯繫。
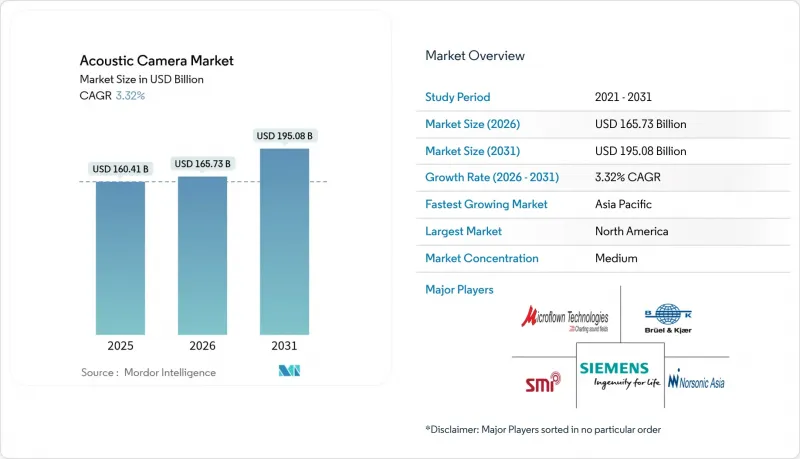
預計聲學相機市場將從 2025 年的 1,604.1 億美元成長到 2026 年的 1,657.3 億美元,到 2031 年將達到 1950.8 億美元,2026 年至 2031 年的複合年成長率為 3.32%。
隨著MEMS麥克風陣列成本的下降和緊湊型邊緣AI處理器的出現,系統物料清單成本已降至5000美元以下,聲學成像技術正從研究實驗室走向工廠車間和城市街道。市政部門正在部署噪音執法鏡頭,汽車工程師正在將電動車的NVH測試數位化,公共產業正在將波束成形模組與預測性維護平台結合。邊緣分析現在可以在設備端運行,這不僅擴展了遠端資產的應用場景,還降低了雲端頻寬和延遲。競爭的重點不再是規模,而是演算法效率和軟體生態系統,這使得小眾創新者能夠與各種測試設備巨頭競爭。
全球聲學相機市場趨勢與洞察
加強全球城市噪音管制
市政機構正逐步淘汰點式聲級計,轉而採用太空成像技術,將違規行為歸因於特定車輛。到2024年,歐洲和北美的城市將陸續安裝基於攝影機的噪音雷達,例如SoundVue等解決方案可提供符合法律證據要件的1級精度。歐盟的目標是到2030年將交通噪音降低30%,這推動了對堅固耐用的戶外聲學攝影機的長期採購。固定式路邊設備正逐漸取代移動拖車,多年期硬體需求和服務合約也成為常態。
電動出行平台NVH數位化快速發展
電動動力傳動系統消除了內燃機的掩蔽效應,從而揭示了馬達、逆變器和空調管道獨特的聲學特徵。汽車製造商正在增加2024年的聲學測試預算,現代汽車已部署3D掃描設備來繪製整個車內空間的聲學圖譜。即時波束成形技術使工程師能夠在實際駕駛條件下可視化輻射模式,從而在生產開始前完成修正。越來越多的商用貨車和城市公車也採用類似的調查方法,以滿足舒適性和當地噪音認證法規的要求。
3D MEMS陣列元件的初始投資較高
由於數百個相位匹配麥克風、精密外殼和高頻寬轉換器的材料和組裝成本高昂,測量級 3D 配置的成本可能超過 10 萬美元。目前,光學 MEMS 麥克風的信噪比可達 80 dB,但製程工具的學習曲線和產量比率限制了價格的大幅下降。在成本低於 5 萬美元的模組化陣列普及之前,小型公司通常會使用共用實驗室或租賃 3D 系統。
細分市場分析
截至2025年,2D聲學相機將憑藉其久經考驗的可靠性和低廉的價格,維持52.40%的市場佔有率。它們在工廠洩漏檢測和汽車零件檢測領域佔據主導地位。同時,受客艙噪音映射、城市空中運輸測試以及複雜機械機殼內全空間定位等需求的推動,3D相機將以16.03%的複合年成長率成長。配備192個麥克風的八角形系統可提供20 Hz至10 頻寬的解析度。隨著MEMS成本的下降,3D平台聲學相機的市場規模預計將縮小與主流產品的差距。利用人工智慧的模式識別技術的改進提高了檢測精度,使得更小的孔徑也能實現相當的性能。系統整合商正在CAD儀表板中整合即時視覺化功能,使工程師能夠在幾分鐘內而非幾天內完成聲學處理方案的檢驗。這種簡化的工作流程也使得航太和豪華汽車領域的產品價格更高。 2024 年出貨的 3D 陣列原型售價低於 6 萬美元,這標誌著中型供應商和大學實驗室對 3D 陣列的採用率正在不斷提高。
由於採用完善的標準和可控制的環境,近距離測量系統預計在2025年將佔總收入的60.30%。艙室測試、變速箱分析和桌面研發是其主要應用場景。受風力發電機噪音審核、智慧城市聲學測繪和飛機飛越測試等領域進展的推動,對長程測量的需求正以14.55%的複合年成長率成長。最小方差失真抑制響應演算法能夠分離50公尺以外的聲源,即使在背景雜訊強烈的環境中也能實現。因此,預計到2031年,長程聲音相機市場的規模將翻倍。基礎設施管理人員正在將數據整合到地理空間儀表板中,並將聲學指標疊加到設施藍圖上,以加快維修人員的調度。
現場操作人員青睞堅固耐用的 IP65+機殼和低功耗邊緣處理器,這些處理器可透過 4G 或 LoRaWAN 傳輸警報訊息。注重安裝便利性和雲端 API 的供應商在市政競標和可再生能源發電電廠專案中屢獲訂單。
聲學相機市場按陣列類型(2D陣列、3D陣列)、測量類型(近距離測量、遠距離測量)、應用(雜訊源識、洩漏偵測等)、終端使用者產業(汽車及出行等)和地區進行細分。市場預測以以金額為準。
區域分析
到2025年,歐洲將佔據全球聲學攝影機市場30.60%的佔有率,主要得益於嚴格的環境法規和先進的汽車供應鏈。德國汽車製造商正在實施全車NVH(噪音、振動與聲振粗糙度)項目,將攝影機資料整合到數位雙胞胎孿生模型中;法國各市政當局正在進行為期多年的城市噪音攝影機試點項目,目標是到2030年將交通噪音降低30%。歐盟「地平線」計畫的資助正在加速產學研聯盟改進3D波束形成軟體。亞太地區預計將以14.08%的複合年成長率成長。中國已根據GB/T 37153-2018標準立法規定了聲學車輛預警系統,並鼓勵一級供應商使用成像工具檢驗揚聲器特性。深圳和新加坡的智慧城市計畫正在十字路口安裝永久性聲學測繪節點。以六標準差品質著稱的日本電子工廠正在貼片線上安裝鏡頭,以檢測真空洩漏引起的嘶嘶聲,從而推動了該地區的穩定訂單。印度不斷擴大的地鐵網路要求在壓縮空氣煞車系統中採用聲學洩漏偵測裝置。
隨著航太主要製造商遵守美國聯邦航空管理局 (FAA) 的噪音認證要求,以及美國職業安全與健康管理局 (OSHA) 擴大噪音暴露指南,北美地區繼續發揮重要作用。工業終端用戶正在將聲學攝影機與振動、溫度和電能品質感測器整合到一個統一的控制面板中。美國墨西哥灣沿岸的石油和天然氣生產商正在將攝影機安裝在履帶上,用於儲存槽檢查,以降低密閉空間作業的風險。南美洲、中東和非洲是新興但充滿潛力的市場。智利礦業公司正在試用攜帶式成像器來識別排氣扇共振,而沿岸地區的公用事業公司正在試用攝影機進行沙漠電力線路檢查,因為在沙漠中,目視無人機難以應對眩光和灰塵。雖然預計這些地區的普及速度將比已開發地區慢兩到三年,但它們將為全球整體普及做出貢獻。
其他福利:
- Excel格式的市場預測(ME)表
- 分析師支持(3個月)
目錄
第1章 引言
- 研究假設和市場定義
- 調查範圍
第2章調查方法
第3章執行摘要
第4章 市場情勢
- 市場概覽
- 市場促進因素
- 加強全球城市噪音管制
- 電動出行平台NVH的快速數位化
- 智慧工廠中從手持式聲級計轉向成像感測器
- 更嚴格的飛機客艙舒適度認證標準
- 邊緣AI波束成形模組使聲學攝影機的組件成本低於5000美元*
- 整合到自主機器人檢測有效載荷中*
- 市場限制
- 3D MEMS陣列元件的初始資本投入較高
- 缺乏區域現場校準標準
- 與延遲和合成波束成形技術相關的專利堵塞
- 惡劣天氣條件下公共產業的加固選擇有限*
- 價值/供應鏈分析
- 監管環境
- 技術展望
- 波特五力分析
- 新進入者的威脅
- 買方的議價能力
- 供應商的議價能力
- 替代品的威脅
- 競爭對手之間的競爭
第5章 市場規模與成長預測
- 按數組類型
- 2D數組
- 3D陣列
- 按測量類型
- 近距離
- 長途
- 透過使用
- 識別噪音源
- 洩漏檢測
- 機械故障診斷
- 其他(生物聲學、研究與發展)
- 按最終用戶行業分類
- 汽車與出行
- 航太/國防
- 電子裝置和半導體
- 能源與電力
- 其他行業
- 按地區
- 北美洲
- 美國
- 加拿大
- 歐洲
- 德國
- 英國
- 法國
- 其他歐洲地區
- 亞太地區
- 中國
- 日本
- 印度
- 亞太其他地區
- 中東和非洲
- 阿拉伯聯合大公國
- 沙烏地阿拉伯
- 南非
- 其他中東和非洲地區
- 南美洲
- 巴西
- 阿根廷
- 南美洲其他地區
- 北美洲
第6章 競爭情勢
- 市場集中度
- 策略趨勢
- 市佔率分析
- 公司簡介
- Hottinger Brel and Kjr Sound and Vibration Measurement A/S
- gfai tech GmbH
- Teledyne FLIR LLC
- SM Instruments Inc.
- Fluke Corporation
- CAE Software and Systems GmbH
- Norsonic AS
- Microflown Technologies BV
- SINUS Messtechnik GmbH
- Sorama BV
- Polytec GmbH
- Visisonics Corporation
- Signal Interface Group LLC
- NL Acoustics Oy
- Ziegler-Instruments GmbH
- Siemens Digital Industries Software
第7章 市場機會與未來展望
The acoustic camera market is expected to grow from USD 160.41 billion in 2025 to USD 165.73 billion in 2026 and is forecast to reach USD 195.08 billion by 2031 at 3.32% CAGR over 2026-2031.
Cost reductions in MEMS microphone arrays and the arrival of compact edge-AI processors have lowered system bills-of-materials below USD 5,000, moving acoustic imaging from research laboratories into factory floors and city streets. Municipal authorities are deploying noise-enforcement cameras, automotive engineers are digitizing NVH testing for electric vehicles, and utilities are pairing beamforming modules with predictive-maintenance platforms. Edge analytics now runs on-device, trimming cloud bandwidth and latency while widening use cases in remote assets. Competitive activity centers on algorithm efficiency and software ecosystems rather than scale, allowing niche innovators to stand alongside diversified test-instrument majors.
Global Acoustic Camera Market Trends and Insights
Tightening Global Urban-Noise Regulations
Municipal agencies are moving from point sound-level meters to spatial imaging that links violations to individual vehicles. European and North American cities installed camera-based noise radars during 2024, and solutions such as SoundVue deliver Class 1 accuracy that satisfies legal-evidence requirements. The European Union targets a 30% cut in transport noise by 2030, spurring long-term procurement of rugged outdoor acoustic cameras. Preference is shifting toward permanent roadside units over mobile trailers, anchoring multi-year hardware demand and service contracts.
Rapid NVH Digitalization in E-Mobility Platforms
Electric powertrains silence combustion masking, unveiling tonal signatures from motors, inverters, and HVAC ducts. Automakers boosted acoustic test budgets during 2024; Hyundai adopted 3-D scanning rigs for full interior mapping. Real-time beamforming lets engineers visualize radiation patterns under actual driving, closing corrective loops before start-of-production. Growing fleets of commercial vans and city buses adopt the same methodologies to meet comfort and regional noise-homologation rules.
High Upfront Capex for 3-D MEMS-Array Rigs
Research-grade 3-D configurations can exceed USD 100,000 because hundreds of phase-matched microphones, precision housings, and high-bandwidth converters raise material and assembly costs. Optical MEMS microphones now deliver 80 dB SNR, yet process tooling and yield learning curves postpone sweeping price drops. Small enterprises lean on shared-service laboratories or rent 3-D systems until modular arrays below USD 50,000 proliferate.
Other drivers and restraints analyzed in the detailed report include:
- Shift from Handheld Sound-Level Meters to Imaging Sensors on Smart Factories
- Rising Aerospace Cabin-Comfort Certification Thresholds
- Scarcity of Field-Calibration Standards Across Regions
For complete list of drivers and restraints, kindly check the Table Of Contents.
Segment Analysis
2-D architectures retained 52.40% share of the acoustic camera market in 2025 owing to proven reliability and lower pricing. They dominate plant leak surveys and automotive component checks. Meanwhile, 3-D units are moving at a 16.03% CAGR as cabin noise mapping, urban-air-mobility trials, and complex machinery enclosures call for full-volume localization. The Octagon system with 192 microphones demonstrates resolution across 20 Hz to 10 kHz bands. As MEMS costs ease, the acoustic camera market size for 3-D platforms is expected to close the gap with mainstream options. Artificial-intelligence pattern recognition is improving hit rates, allowing smaller apertures to match legacy performance.System integrators embed real-time visualization within CAD dashboards, so engineers iterate acoustic treatments in minutes rather than days. This workflow compression justifies premiums in aerospace and luxury vehicle segments. Prototype 3-D arrays shipped in 2024 at under USD 60,000, signalling a trajectory toward broader adoption among mid-tier suppliers and university labs.
Near-field setups commanded 60.30% revenue in 2025 thanks to clear standards and controlled environments. Chamber testing, gearbox analysis, and benchtop RandD remain anchor use cases. Far-field demand is climbing at a 14.55% CAGR in step with wind turbine noise audits, smart city sound mapping, and aircraft pass-by trials. Minimum variance distortion less response algorithms now separate sources more than 50 m away despite heavy background traffic. As a result, the acoustic camera market size for long-range systems is projected to double through 2031. Infrastructure managers integrate data into geospatial dashboards that overlay acoustic metrics on facility blueprints for quick dispatch of repair crews.
Field operators value rugged enclosures rated IP65 or higher and low-power edge processors that relay alerts over 4G or LoRaWAN. Vendors emphasizing ease of installation and cloud APIs are winning bids in municipal tenders and renewable-energy farms.
The Acoustic Camera Market Segmented by Array Type (2-D Arrays, 3-D Arrays), Measurement Type (Near-Field, Far-Field), Application (Noise Source Identification, Leak Detection and More), End-User Industry (Automotive & Mobility and More), Geography. The Market Forecasts are Provided in Terms of Value (USD).
Geography Analysis
Europe held 30.60% of the acoustic camera market in 2025, anchored by stringent environmental regulations and a sophisticated automotive supply chain. German OEMs run full-vehicle NVH programs that cascade camera data into digital twins, while French municipalities engage multi-year urban noise-camera pilots to secure 30% transport noise cuts by 2030. Funding instruments from Horizon Europe accelerate academic-industry consortia that refine 3-D beamforming software.APAC is set for a 14.08% CAGR. China legislated acoustic vehicle alerting systems under GB/T 37153-2018, pushing tier-one suppliers to validate loudspeaker signatures with imaging tools. Smart-city programs in Shenzhen and Singapore embed permanent acoustic mapping nodes at intersections. Japanese electronics plants, known for Six Sigma quality, fit cameras over pick-and-place lines to catch vacuum-leak hiss, driving consistent regional orders. India's expanding metro-rail footprint is specifying acoustic leak detection on compressed-air braking systems.
North America retains an influential role as aerospace primes comply with FAA noise certification and as OSHA broadens exposure guidelines. Industrial end users integrate acoustic cameras with vibration, thermal, and power-quality sensors in unified dashboards. Oil and gas producers in the Gulf Coast mount cameras on robotic crawlers for storage tank inspections, mitigating confined-space entry risks.South America and the Middle East and Africa form nascent but promising territories. Mining operators in Chile test portable imagers to pinpoint vent fan resonance, while Gulf utilities trial cameras for desert power-line inspections where visual drones struggle with glare and sand. Uptake here is expected to trail advanced regions by two to three years yet remains additive to global volumes.
- Hottinger Brel and Kjr Sound and Vibration Measurement A/S
- gfai tech GmbH
- Teledyne FLIR LLC
- SM Instruments Inc.
- Fluke Corporation
- CAE Software and Systems GmbH
- Norsonic AS
- Microflown Technologies BV
- SINUS Messtechnik GmbH
- Sorama BV
- Polytec GmbH
- Visisonics Corporation
- Signal Interface Group LLC
- NL Acoustics Oy
- Ziegler-Instruments GmbH
- Siemens Digital Industries Software
Additional Benefits:
- The market estimate (ME) sheet in Excel format
- 3 months of analyst support
TABLE OF CONTENTS
1 INTRODUCTION
- 1.1 Study Assumptions and Market Definition
- 1.2 Scope of the Study
2 RESEARCH METHODOLOGY
3 EXECUTIVE SUMMARY
4 MARKET LANDSCAPE
- 4.1 Market Overview
- 4.2 Market Drivers
- 4.2.1 Tightening global urban-noise regulations
- 4.2.2 Rapid NVH digitalisation in e-mobility platforms
- 4.2.3 Shift from handheld sound-level meters to imaging sensors on smart factories
- 4.2.4 Rising aerospace cabin-comfort certification thresholds
- 4.2.5 Edge-AI beamforming modules enable sub-$5 k BOM acoustic cameras*
- 4.2.6 Integration into autonomous-robot inspection payloads*
- 4.3 Market Restraints
- 4.3.1 High upfront capex for 3D MEMS-array rigs
- 4.3.2 Scarcity of field-calibration standards across regions
- 4.3.3 Patent thickets around delay-and-sum beam-forming IP*
- 4.3.4 Limited ruggedised options for harsh-weather utilities*
- 4.4 Value / Supply-Chain Analysis
- 4.5 Regulatory Landscape
- 4.6 Technological Outlook
- 4.7 Porter's Five Forces Analysis
- 4.7.1 Threat of New Entrants
- 4.7.2 Bargaining Power of Buyers
- 4.7.3 Bargaining Power of Suppliers
- 4.7.4 Threat of Substitutes
- 4.7.5 Competitive Rivalry
5 MARKET SIZE AND GROWTH FORECASTS (VALUE)
- 5.1 By Array Type
- 5.1.1 2-D Arrays
- 5.1.2 3-D Arrays
- 5.2 By Measurement Type
- 5.2.1 Near-Field
- 5.2.2 Far-Field
- 5.3 By Application
- 5.3.1 Noise Source Identification
- 5.3.2 Leak Detection
- 5.3.3 Mechanical Fault Diagnostics
- 5.3.4 Others (Bio-acoustics, RandD)
- 5.4 By End-user Industry
- 5.4.1 Automotive and Mobility
- 5.4.2 Aerospace and Defense
- 5.4.3 Electronics and Semiconductor
- 5.4.4 Energy and Power
- 5.4.5 Other Industries
- 5.5 By Geography
- 5.5.1 North America
- 5.5.1.1 United States
- 5.5.1.2 Canada
- 5.5.2 Europe
- 5.5.2.1 Germany
- 5.5.2.2 United Kingdom
- 5.5.2.3 France
- 5.5.2.4 Rest of Europe
- 5.5.3 Asia-Pacific
- 5.5.3.1 China
- 5.5.3.2 Japan
- 5.5.3.3 India
- 5.5.3.4 Rest of Asia-Pacific
- 5.5.4 Middle East and Africa
- 5.5.4.1 United Arab Emirates
- 5.5.4.2 Saudi Arabia
- 5.5.4.3 South Africa
- 5.5.4.4 Rest of Middle East and Africa
- 5.5.5 South America
- 5.5.5.1 Brazil
- 5.5.5.2 Argentina
- 5.5.5.3 Rest of South America
- 5.5.1 North America
6 COMPETITIVE LANDSCAPE
- 6.1 Market Concentration
- 6.2 Strategic Moves
- 6.3 Market Share Analysis
- 6.4 Company Profiles (includes Global level Overview, Market level overview, Core Segments, Financials as available, Strategic Information, Market Rank/Share, Products and Services, Recent Developments)
- 6.4.1 Hottinger Brel and Kjr Sound and Vibration Measurement A/S
- 6.4.2 gfai tech GmbH
- 6.4.3 Teledyne FLIR LLC
- 6.4.4 SM Instruments Inc.
- 6.4.5 Fluke Corporation
- 6.4.6 CAE Software and Systems GmbH
- 6.4.7 Norsonic AS
- 6.4.8 Microflown Technologies BV
- 6.4.9 SINUS Messtechnik GmbH
- 6.4.10 Sorama BV
- 6.4.11 Polytec GmbH
- 6.4.12 Visisonics Corporation
- 6.4.13 Signal Interface Group LLC
- 6.4.14 NL Acoustics Oy
- 6.4.15 Ziegler-Instruments GmbH
- 6.4.16 Siemens Digital Industries Software
7 MARKET OPPORTUNITIES AND FUTURE OUTLOOK
- 7.1 White-space and Unmet-Need Assessment
 聲學相機市場:按類型、組件、最終用戶和銷售管道分類-2026-2032年全球市場預測
 全球聲學相機市場規模、佔有率、趨勢和成長分析報告(2026-2034)無線聲學成像器市場:按產品類型、技術、應用、最終用戶和部署方式分類的全球預測,2026-2032年聲學測試設備市場:按產品類型、技術、銷售管道、應用和最終用戶分類-全球預測,2026-2032年
 聲學相機市場規模、佔有率、趨勢和預測:按陣列類型、測量類型、應用、最終用途和地區分類,2026-2034 年
 全球聲學攝影機市場:成長、規模和趨勢分析 - 依陣列類型、應用、最終用戶和地區的展望,競爭策略、預測(~2034年)