


 |
市場調查報告書
商品編碼
1940554
應用容器:市場佔有率分析、產業趨勢與統計、成長預測(2026-2031)Application Container - Market Share Analysis, Industry Trends & Statistics, Growth Forecasts (2026 - 2031) |
||||||
※ 本網頁內容可能與最新版本有所差異。詳細情況請與我們聯繫。
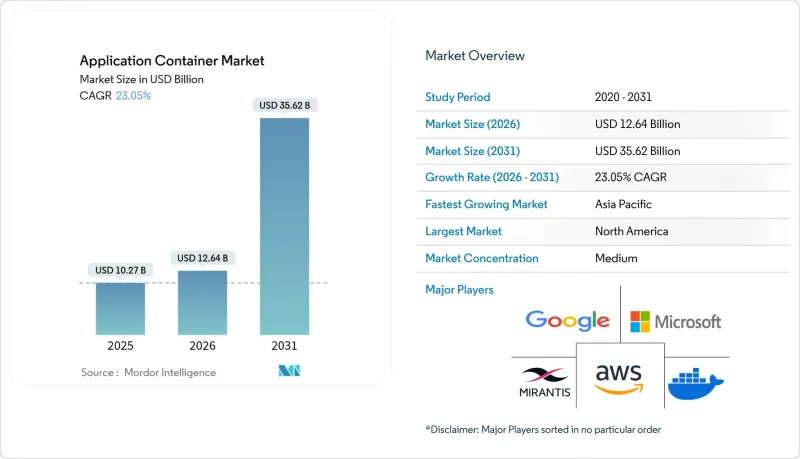
應用容器市場預計將從 2025 年的 102.7 億美元成長到 2026 年的 126.4 億美元,預計到 2031 年將達到 356.2 億美元,2026 年至 2031 年的複合年成長率為 23.05%。
這一成長主要得益於企業加速向微服務轉型、DevOps 管線的普及以及對混合雲和多重雲端架構日益成長的偏好。到 2024 年,平台解決方案將佔總收入的 57.1%,這表明基於 Kubernetes 的編配將發揮核心作用。然而,隨著企業尋求部署、遷移和託管方面的專業知識,服務領域的成長速度更快,年複合成長率 (CAGR) 達到 18.20%。公共雲端部署以 64.3% 的市佔率主導,但混合雲和多重雲端環境的成長速度最快,年複合成長率達到 24.50%,這主要受工作負載可移植性和合規性需求的驅動。大型企業保持著 68.2% 的市場佔有率,而中小企業也以 21.30% 的年複合成長率擴大採用率,因為託管容器服務的可用性降低了進入門檻。按產業垂直領域分類,IT 和電信(佔 35.8%)的採用率仍然最高,而醫療保健產業則展現出最強勁的成長潛力,複合年成長率達到 19.70%,這主要得益於數位醫療政策和嚴格的資料隱私法規。
全球應用容器市場趨勢與洞察
加速採用微服務架構
截至2025年,受訪技術領導企業中容器化採用率將達到88%,微服務被視為關鍵促進因素。德意志銀行在其集中式平台上運作超過3100個活躍計劃,透過容器化,已將其發布週期從六個月縮短至三週。將單體系統解耦為可獨立部署的服務,實現了彈性擴展和高效的故障隔離。曼迪利銀行等金融機構就是一個典型的例子:其數位銀行基礎設施現在每秒可處理12,000個請求,同時維持99.95%的運轉率。這種架構轉型也促成了持續交付方法的實施,使開發迭代與業務需求保持一致。因此,企業不僅將微服務視為一種開發方法,更將其視為加速產品上市的策略槓桿。
對混合雲和多重雲端敏捷性的需求
到 2024 年,76% 的企業將運行兩個或多個公共雲端,他們認為避免廠商鎖定和提高監管柔軟性是主要原因。加利西亞銀行 (Banco Galicia) 整合了分佈在本地和多個公共雲端上的工作負載,並在採用統一的 Kubernetes 控制平面後,將停機時間減少了 40%。服務網格覆蓋層現在可以安全地路由不同區域叢集之間的東西向流量,並提供統一的策略執行,而無需考慮底層提供者。基礎架構即程式碼 (IaC) 實務進一步標準化了資源配置,使企業能夠根據價格、延遲和管治觸發條件遷移工作負載,而無需重構程式碼。由此帶來的營運敏捷性正在推動應用容器市場的發展,使應用環境能夠應對不斷變化的合規性和效能限制。
容器安全漏洞和錯誤配置
容器平均有超過 600 個已知漏洞,97% 的受訪團隊對 Kubernetes 的安全狀況表示擔憂。 Gartner 預測,配置錯誤是最大的風險因素,到 2026 年,99% 的雲端安全漏洞將由客戶錯誤而非服務供應商缺陷造成。 NVIDIA Container Toolkit 中最近發現的一個漏洞(CVE-2024-0132,CVSS 9.0)揭示了一種潛在的主機資料外洩途徑,威脅著多租戶叢集的安全。儘管企業正在透過整合鏡像掃描、運行時監控和零信任網路策略來應對,但技能短缺和工具氾濫使得應對措施更加複雜。在企業加強其端到端安全管道之前,安全問題可能會限制應用容器市場的複合年成長率 (CAGR)。
細分市場分析
到2025年,平台軟體將佔總營收的56.45%,企業將普遍採用OpenShift和Tanzu等Kubernetes發行版。然而,服務業務的複合年成長率將達到17.55%,超過所有其他細分市場。隨著企業面臨技能短缺和監管審核,應用容器即服務市場預計將持續擴張。諮詢和託管服務能夠加速新部署,同時降低將傳統工作負載遷移到微服務架構的風險。多重雲端環境日益複雜,進一步鞏固了對整合合作夥伴和全天候支援服務的長期需求。
供應商的產品藍圖通常會將培訓和財務營運指導與純技術產品打包在一起。德意志銀行與紅帽公司的合作就是這種模式的典範,該銀行利用紅帽的架構師將發布週期縮短了三分之二,這表明知識轉移可以像軟體許可一樣成為寶貴的資產。這種工具和專業知識的良性循環將使服務在預測期內成為應用容器市場中最具活力的收入來源。
到2025年,公共雲端將佔據63.55%的收入佔有率,這主要得益於Amazon EKS、Google GKE和Azure AKS等託管Kubernetes服務的成熟。然而,混合雲和多重雲端的採用率正以24.05%的複合年成長率快速成長,是整體應用容器市場成長率的兩倍,這主要得益於企業分散運作以最佳化延遲、主權和正常運作時間。隨著受監管產業將關鍵資料庫遷移到私人區域,而無狀態微服務仍保留在超大規模環境中,公共雲端應用容器的市場佔有率可能會略有下降。
邊緣閘道器、5G核心功能和AI推理叢集正在推動對裸機、虛擬化堆疊和公共IaaS進行統一管治的需求。加利西亞銀行在部署多重雲端網狀網路後,停機時間減少了40%,這充分體現了統一策略引擎帶來的營運優勢。未來五年,工作負載部署決策將更受資料管轄權和永續性的限制,而非簡單的運算價格,這將強化應用容器市場的混合設計模式。
區域分析
北美地區將貢獻 2025 年 43.65% 的收入,這充分證明了其強大的 DevOps 文化、充裕的創業投資以及美國超大規模資料中心業者的主導地位。 Docker 近期完成的 Seacoa Capital主導的4,000 萬美元 C 輪資金籌措,也顯示投資者對其持續充滿信心。聯邦政府的現代化計畫和金融科技領域的放鬆管制進一步推動了容器技術的普及。加拿大大力發展數位化醫療以及墨西哥蓬勃發展的電子商務,正將容器技術的應用範圍擴展到北美最大的幾個經濟體之外。
亞太地區以22.35%的複合年成長率 (CAGR) 保持最快的成長速度。政府對智慧城市建設的津貼、行動商務交易量的激增以及5G部署正在推動中國、印度、日本和韓國等國發展容器化邊緣基礎設施。新加坡資訊通訊媒體發展局 (IMDA) 正在發放雲端服務額度以降低Start-Ups的准入門檻,而澳洲各州政府機構正在試行基於Kubernetes的數位身分平台。這些因素共同推動亞太地區的應用容器市場規模以超過其他任何地區的速度成長。
歐洲在GDPR的基礎上穩步推進,資料主權正從混合雲部署的障礙轉變為驅動力。德國的工業4.0工廠、法國的公共雲端權力舉措以及英國的開放銀行標準,都在增強對策略驅動型容器堆疊的需求。西班牙和荷蘭的多廠商聯盟表明,中型經濟體可以透過採用雲端原生藍圖標準,實現跨越式發展,超越傳統基礎設施。中東和非洲地區雖然落後,但正在加速發展,例如沙烏地阿拉伯一家能源集團正在部署容器進行預測性維護,南非一家銀行正在實現零售通路的數位化。
其他福利:
- Excel格式的市場預測(ME)表
- 分析師支持(3個月)
目錄
第1章 引言
- 研究假設和市場定義
- 調查範圍
第2章調查方法
第3章執行摘要
第4章 市場洞察
- 市場概覽
- 市場促進因素
- 加速採用微服務架構
- 對混合雲和多重雲端敏捷性的需求
- DevOps 和 CI/CD 流水線的普及
- 資源最佳化和成本效益的需求
- 需要輕量級運行時的邊緣原生AI工作負載
- 基於 ARM 的伺服器可提升容器效能
- 市場限制
- 容器安全漏洞和錯誤配置
- 大規模編配的複雜性
- 對開放原始碼許可證合規性的不確定性
- 多區域部署中的資料主權約束
- 價值鏈分析
- 監管環境
- 技術展望
- 波特五力分析
- 供應商的議價能力
- 買方的議價能力
- 新進入者的威脅
- 替代品的威脅
- 競爭對手之間的競爭
- 產業生態系分析
- 主要用例和案例研究
- 宏觀經濟趨勢評估
- 投資分析
第5章 市場規模與成長預測
- 按組件
- 平台
- 服務
- 按部署模式
- 公共雲端
- 私有雲端
- 混合雲端和多重雲端
- 按組織規模
- 主要企業
- 中小企業
- 按行業
- 資訊科技和電信
- BFSI
- 衛生保健
- 零售與電子商務
- 製造業
- 政府和公共部門
- 按字段分類的容器用例
- 管理與協調
- 監測
- DevOps 工具鏈
- 安全
- 網路
- 貯存
- 按地區
- 北美洲
- 美國
- 加拿大
- 墨西哥
- 南美洲
- 巴西
- 阿根廷
- 哥倫比亞
- 南美洲其他地區
- 歐洲
- 德國
- 英國
- 法國
- 義大利
- 西班牙
- 俄羅斯
- 荷蘭
- 其他歐洲地區
- 亞太地區
- 中國
- 日本
- 韓國
- 印度
- 澳洲
- 新加坡
- 亞太其他地區
- 中東和非洲
- 中東
- 沙烏地阿拉伯
- 阿拉伯聯合大公國
- 其他中東地區
- 非洲
- 南非
- 埃及
- 其他非洲地區
- 中東
- 北美洲
第6章 競爭情勢
- 市場集中度
- 策略趨勢
- 市佔率分析
- 公司簡介
- Red Hat, Inc.
- Mirantis, Inc.
- VMware, Inc.
- SUSE SE
- Canonical Ltd.
- Docker, Inc.
- Amazon Web Services, Inc.
- Google LLC
- Microsoft Corporation
- Oracle Corporation
- IBM Corporation
- Rancher Labs, Inc.
- Alibaba Cloud Computing Co., Ltd.
- Hewlett Packard Enterprise Company
- Cisco Systems, Inc.
- Palo Alto Networks, Inc.
- Portainer Ltd.
- Heroku LLC(Salesforce, Inc.)
- NetApp, Inc.
- HashiCorp, Inc.
第7章 市場機會與未來展望
The application container market is expected to grow from USD 10.27 billion in 2025 to USD 12.64 billion in 2026 and is forecast to reach USD 35.62 billion by 2031 at 23.05% CAGR over 2026-2031.
Strong enterprise migration toward micro-services, the proliferation of DevOps pipelines and the growing preference for hybrid, multi-cloud architectures are sustaining this momentum. Platform solutions accounted for 57.1% revenue in 2024, reflecting the central role of Kubernetes-based orchestration, yet services are expanding faster at an 18.20% CAGR as organizations seek implementation, migration, and managed expertise . Public-cloud deployments led with 64.3% share, but hybrid and multi-cloud setups are the fastest risers at 24.50% CAGR, driven by workload portability and compliance demands. Large enterprises retained a 68.2% share, although small and medium enterprises are scaling adoption at a 21.30% CAGR as managed container offerings lower entry barriers. Industry uptake remains highest in IT and telecom (35.8% share), while healthcare shows the strongest vertical upside at 19.70% CAGR, propelled by digital health mandates and stringent data-privacy regulations.
Global Application Container Market Trends and Insights
Accelerating Adoption of Micro-services Architecture
Container penetration reached 88% among surveyed technology leaders in 2025, with micro-services framed as the principal catalyst . Deutsche Bank's centralized platform runs more than 3,100 active projects and cut release cycles from six months to three weeks once workloads were containerized. Decoupling monoliths into independently deployable services enables elastic scaling and streamlined incident isolation, illustrated by financial institutions such as Bank Mandiri, whose digital banking backbone now processes 12,000 requests per second while sustaining 99.95% uptime. The architectural shift has also unlocked continuous delivery patterns that align development sprints with business imperatives. As a result, enterprises view micro-services not merely as a development paradigm but as a strategic lever for time-to-market acceleration.
Demand for Hybrid and Multi-Cloud Agility
Seventy-six percent of organizations operated two or more public clouds in 2024, citing vendor lock-in avoidance and regulatory flexibility as top rationales. Banco Galicia consolidated disparate workloads across on-premises and multiple public clouds, realizing a 40% downtime reduction after adopting a unified Kubernetes control plane. Service-mesh overlays now route east-west traffic securely among clusters residing in different regions, providing uniform policy enforcement regardless of underlying provider. Infrastructure-as-Code practices further standardize provisioning, allowing enterprises to shift workloads in response to price, latency or governance triggers without refactoring code. The resulting operational agility propels the application container market as organizations future-proof application estates against evolving compliance and performance constraints.
Container Security Vulnerabilities and Misconfigurations
Containers harbor more than 600 disclosed vulnerabilities on average, and 97% of surveyed teams voice concerns about Kubernetes security posture. Misconfigurations top the risk list, prompting Gartner to forecast that 99% of cloud breaches will stem from customer error rather than provider flaws by 2026. A recent NVIDIA Container Toolkit flaw (CVE-2024-0132, CVSS 9.0) illustrated potential host-escape vectors that threaten multi-tenant clusters. Enterprises respond by integrating image scanning, runtime monitoring, and zero-trust network policies, yet skills gaps and tool sprawl complicate remediation. Until organizations harden pipelines end-to-end, security fears will temper the CAGR of the application container market.
Other drivers and restraints analyzed in the detailed report include:
- Surge in DevOps and CI/CD Pipelines
- Need for Resource Optimization and Cost Efficiency
- Complexity of Large-Scale Orchestration
For complete list of drivers and restraints, kindly check the Table Of Contents.
Segment Analysis
Platform software constituted 56.45% of 2025 revenue as enterprises standardized on Kubernetes distributions such as OpenShift and Tanzu, yet services exhibited an 17.55% CAGR that outpaced every other component. The application container market size for services is projected to swell as firms confront skills shortages and regulatory audits. Consulting and managed engagements accelerate greenfield rollouts while de-risking migrations of legacy workloads into micro-services. The rising complexity of multi-cloud estates further cements long-term demand for integration partners and 24x7 support desks.
Vendor roadmaps now bundle training and FinOps guidance alongside pure technology deliverables. Deutsche Bank's partnership with Red Hat exemplifies the model: the bank leaned on vendor architects to cut release cycles by two-thirds, proving that knowledge transfer can be as valuable as software licenses. The virtuous loop of tooling plus expertise positions services as the most vibrant profit pool within the application container market over the forecast horizon.
Public cloud captured 63.55% of revenue in 2025, a figure buoyed by the maturity of managed Kubernetes offerings like Amazon EKS, Google GKE, and Azure AKS. However, hybrid and multi-cloud footprints are scaling at a 24.05% CAGR-double the broader application container market-because companies now distribute workloads to optimize latency, sovereignty, and uptime. The application container market share for public cloud may narrow modestly as regulated industries shift critical databases to private regions while keeping stateless micro-services at hyperscale.
Edge gateways, 5G core functions, and AI inference clusters intensify the need for uniform governance spanning bare metal, virtualized stacks, and public IaaS. Banco Galicia's 40% downtime reduction after adopting a multi-cloud mesh demonstrates the operational upside of unified policy engines. Over the next five years, workload placement decisions will hinge less on raw compute pricing and more on data jurisdiction and sustainability constraints, reinforcing hybrid design patterns across the application container market.
Application Container Market Report is Segmented by Component (Platform and Services), Deployment Model (Public Cloud, Private Cloud and Hybrid and Multi-Cloud), Organization Size (Large Enterprises, and SMEs), Industry Vertical (IT and Telecom, BFSI, and More), Container Use-Case Area (Management and Orchestration, Monitoring, Devops Tool-Chain, and More), and Geography. The Market Forecasts are Provided in Terms of Value (USD).
Geography Analysis
North America produced 43.65% of 2025 revenue, a testament to entrenched DevOps cultures, abundant venture capital and the dominance of U.S. hyperscalers. Docker's recent USD 40 million Series C, steered by Sequoia Capital, typifies continued investor confidence. Federal modernization programs and fintech deregulation further spur adoption. Canada's healthcare digitization push and Mexico's e-commerce boom extend North America's container footprint beyond its largest economy.
Asia-Pacific records the steepest growth profile at 22.35% CAGR. Government smart-city grants, surging mobile-commerce volumes, and 5G rollouts stimulate containerized edge infrastructure in China, India, Japan, and South Korea. Singapore's Infocomm Media Development Authority allocates cloud credits that lower onboarding costs for start-ups, while Australian state agencies pilot Kubernetes-based digital-identity platforms. Collectively these efforts grow the application container market size across APAC faster than any other region.
Europe maintains steady progress underpinned by GDPR, which turns data sovereignty from an obstacle to an enabler for hybrid adoption. Germany's Industrie 4.0 factories, France's public-cloud sovereignty initiative, and the United Kingdom's open-banking benchmarks reinforce demand for policy-aware container stacks. Multi-vendor alliances in Spain and the Netherlands show how mid-tier economies can leapfrog legacy infrastructure by standardizing on cloud-native blueprints. The Middle East and Africa trail but accelerate as energy conglomerates in Saudi Arabia deploy containers for predictive maintenance and South African banks digitize retail channels.
- Red Hat, Inc.
- Mirantis, Inc.
- VMware, Inc.
- SUSE SE
- Canonical Ltd.
- Docker, Inc.
- Amazon Web Services, Inc.
- Google LLC
- Microsoft Corporation
- Oracle Corporation
- IBM Corporation
- Rancher Labs, Inc.
- Alibaba Cloud Computing Co., Ltd.
- Hewlett Packard Enterprise Company
- Cisco Systems, Inc.
- Palo Alto Networks, Inc.
- Portainer Ltd.
- Heroku LLC (Salesforce, Inc.)
- NetApp, Inc.
- HashiCorp, Inc.
Additional Benefits:
- The market estimate (ME) sheet in Excel format
- 3 months of analyst support
TABLE OF CONTENTS
1 INTRODUCTION
- 1.1 Study Assumptions and Market Definition
- 1.2 Scope of the Study
2 RESEARCH METHODOLOGY
3 EXECUTIVE SUMMARY
4 MARKET INSIGHTS
- 4.1 Market Overview
- 4.2 Market Drivers
- 4.2.1 Accelerating adoption of micro-services architecture
- 4.2.2 Demand for hybrid and multi-cloud agility
- 4.2.3 Surge in DevOps and CI/CD pipelines
- 4.2.4 Need for resource optimisation and cost efficiency
- 4.2.5 Edge-native AI workloads needing lightweight runtimes
- 4.2.6 Arm-based servers boosting container performance
- 4.3 Market Restraints
- 4.3.1 Container security vulnerabilities and misconfigurations
- 4.3.2 Complexity of large-scale orchestration
- 4.3.3 Open-source licence-compliance uncertainty
- 4.3.4 Data-sovereignty limits on multi-region deployment
- 4.4 Value Chain Analysis
- 4.5 Regulatory Landscape
- 4.6 Technological Outlook
- 4.7 Porter's Five Forces Analysis
- 4.7.1 Bargaining Power of Suppliers
- 4.7.2 Bargaining Power of Buyers
- 4.7.3 Threat of New Entrants
- 4.7.4 Threat of Substitutes
- 4.7.5 Competitive Rivalry
- 4.8 Industry Ecosystem Analysis
- 4.9 Key Use Cases and Case Studies
- 4.10 Assessment of Macroeconomic Trends
- 4.11 Investment Analysis
5 MARKET SIZE AND GROWTH FORECASTS (VALUE)
- 5.1 By Component
- 5.1.1 Platform
- 5.1.2 Services
- 5.2 By Deployment Model
- 5.2.1 Public Cloud
- 5.2.2 Private Cloud
- 5.2.3 Hybrid and Multi-Cloud
- 5.3 By Organization Size
- 5.3.1 Large Enterprises
- 5.3.2 Small and Medium Enterprises (SMEs)
- 5.4 By Industry Vertical
- 5.4.1 IT and Telecom
- 5.4.2 BFSI
- 5.4.3 Healthcare
- 5.4.4 Retail and e-Commerce
- 5.4.5 Manufacturing
- 5.4.6 Government and Public Sector
- 5.5 By Container Use-Case Area
- 5.5.1 Management and Orchestration
- 5.5.2 Monitoring
- 5.5.3 DevOps Tool-chain
- 5.5.4 Security
- 5.5.5 Networking
- 5.5.6 Storage
- 5.6 By Geography
- 5.6.1 North America
- 5.6.1.1 United States
- 5.6.1.2 Canada
- 5.6.1.3 Mexico
- 5.6.2 South America
- 5.6.2.1 Brazil
- 5.6.2.2 Argentina
- 5.6.2.3 Colombia
- 5.6.2.4 Rest of South America
- 5.6.3 Europe
- 5.6.3.1 Germany
- 5.6.3.2 United Kingdom
- 5.6.3.3 France
- 5.6.3.4 Italy
- 5.6.3.5 Spain
- 5.6.3.6 Russia
- 5.6.3.7 Netherlands
- 5.6.3.8 Rest of Europe
- 5.6.4 Asia-Pacific
- 5.6.4.1 China
- 5.6.4.2 Japan
- 5.6.4.3 South Korea
- 5.6.4.4 India
- 5.6.4.5 Australia
- 5.6.4.6 Singapore
- 5.6.4.7 Rest of Asia-Pacific
- 5.6.5 Middle East and Africa
- 5.6.5.1 Middle East
- 5.6.5.1.1 Saudi Arabia
- 5.6.5.1.2 United Arab Emirates
- 5.6.5.1.3 Rest of Middle East
- 5.6.5.2 Africa
- 5.6.5.2.1 South Africa
- 5.6.5.2.2 Egypt
- 5.6.5.2.3 Rest of Africa
- 5.6.5.1 Middle East
- 5.6.1 North America
6 COMPETITIVE LANDSCAPE
- 6.1 Market Concentration
- 6.2 Strategic Moves
- 6.3 Market Share Analysis
- 6.4 Company Profiles (includes Global level Overview, Market level overview, Core Segments, Financials as available, Strategic Information, Market Rank/Share for key companies, Products and Services, and Recent Developments)
- 6.4.1 Red Hat, Inc.
- 6.4.2 Mirantis, Inc.
- 6.4.3 VMware, Inc.
- 6.4.4 SUSE SE
- 6.4.5 Canonical Ltd.
- 6.4.6 Docker, Inc.
- 6.4.7 Amazon Web Services, Inc.
- 6.4.8 Google LLC
- 6.4.9 Microsoft Corporation
- 6.4.10 Oracle Corporation
- 6.4.11 IBM Corporation
- 6.4.12 Rancher Labs, Inc.
- 6.4.13 Alibaba Cloud Computing Co., Ltd.
- 6.4.14 Hewlett Packard Enterprise Company
- 6.4.15 Cisco Systems, Inc.
- 6.4.16 Palo Alto Networks, Inc.
- 6.4.17 Portainer Ltd.
- 6.4.18 Heroku LLC (Salesforce, Inc.)
- 6.4.19 NetApp, Inc.
- 6.4.20 HashiCorp, Inc.
7 MARKET OPPORTUNITIES AND FUTURE OUTLOOK
- 7.1 White-space and Unmet-Need Assessment
 2026年全球應用容器市場報告
 應用容器市場:2026-2032年全球市場預測(依容器類型、部署模式、應用程式類型、作業系統和最終用戶分類)
 應用容器市場分析及預測(至 2035 年):按類型、產品類型、服務、技術、組件、應用、部署類型、最終用戶和解決方案分類
 應用容器市場 - 全球產業規模、佔有率、趨勢、機會、預測:按服務、平台、組織規模、地區和競爭對手分類,2021-2031 年PP圓形容器市場依產品類型、產能、製造流程、終端用戶產業及通路分類,全球預測(2026-2032年)
 應用容器市場規模、佔有率和成長分析(按服務、部署模式、應用領域和地區分類)-產業預測(2026-2033 年)
 應用容器市場規模、佔有率、趨勢分析報告:按服務、部署、公司規模、最終用途、地區、細分市場預測,2025 年至 2030 年
 全球應用容器市場,2024-2028
 全球應用容器市場規模(按地區、範圍和預測)
 全球應用程式容器市場規模研究,按服務、類型、組織規模、部署、應用程式、最終用戶和區域預測 2022-2032