


 |
市場調查報告書
商品編碼
1939730
公用事業計費軟體:市場佔有率分析、產業趨勢與統計、成長預測(2026-2031 年)Utility Billing Software - Market Share Analysis, Industry Trends & Statistics, Growth Forecasts (2026 - 2031) |
||||||
※ 本網頁內容可能與最新版本有所差異。詳細情況請與我們聯繫。
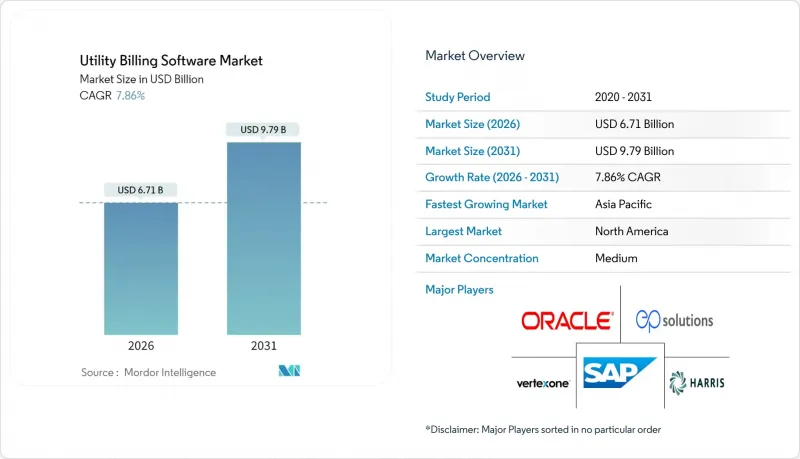
2025 年公用事業計費軟體市場價值為 62.2 億美元,預計到 2031 年將達到 97.9 億美元,高於 2026 年的 67.1 億美元。
預計在預測期(2026-2031 年)內,複合年成長率將達到 7.86%。
嚴格的監管時間表、加速推進的智慧電網計劃以及淘汰傳統大型主機的壓力,正推動著對現代平台的持續投資。雲端優先部署策略、彈性分析工作負載以及近乎即時的計費引擎,正助力市政公用事業公司和投資者所有的公共產業快速採用供應商產品。 VertexOne 近期的資金籌措和收購熱潮,體現了行業整合活動,也顯示私募股權對公用事業計費軟體市場日益成長的信心。同時,公共產業面臨日益嚴峻的網路風險,安全功能已從可選附加功能提升為核心採購標準。對電力、水、燃氣和通訊服務統一計費的需求,進一步擴大了平台供應商的潛在基本客群。
全球公用事業計費軟體市場趨勢與洞察
增加對智慧電網/AMI實施的投資
高級計量基礎設施 (AMI) 專案透過向公共產業提供傳統批量處理系統無法處理的大量高頻用電數據,創造了持續的平台需求。光是印度的配電產業轉型計畫就設定了到 2026 年安裝 2.5 億套 AMI 系統的目標,並承諾投入 150 億美元。設計-建造-資金籌措-營運-擁有-移交 (DBFOOT) 模式將資本風險轉移給服務供應商,並確保公用事業計費軟體市場獲得持續的 SaaS 收入。每個住宅智慧電錶每年產生超過 35,000 次測量數據,迫使公共產業優先考慮彈性可擴展的雲端原生計費引擎。
快速過渡到雲端優先的公用事業 IT 架構
2025會計年度第二季度, Oracle的雲端營收年增24%,達到59億美元,這主要得益於公共產業將其客戶資訊系統和定價引擎遷移到多租戶SaaS環境。雲端框架將新收費系統的引進週期從數月縮短至數週,這在監管機構核准動態分時電價時是一項關鍵優勢。更低的預付成本使中型地方政府公用事業公司能夠獲得以前只有私人公司才能使用的高級功能,從而將公用事業收費軟體市場擴展到更多客戶群。
初始整合和資料遷移成本高昂
改造舊式客戶資訊系統 (CIS) 通常會消耗計劃預算的 40% 到 60%,需要清理數十年的記錄並調整系統架構。客戶數量少於 5 萬的小規模公共缺乏專職 IT 人員,不得不依賴外部顧問,導致總實施成本增加一倍。除非採用基於訂閱的 SaaS 解決方案來抵消這些成本障礙,否則這些成本障礙會延緩現代化進程。而這種趨勢又會將成本從資本支出轉移到營運預算。
細分市場分析
預計到2025年,雲端平台將佔公用事業計費軟體市場收入的43.62%,並在2031年之前以13.52%的複合年成長率成長,鞏固其作為公用事業計費軟體市場關鍵成長引擎的地位。大規模投資者擁有的公共產業仍然依賴本地部署,但由於現有資料中心投資的沉沒成本,其擴展能力受到限制。混合部署作為一種橋樑架構,使受監管的公共產業能夠在公共雲端上擴展計量資料處理,同時保護本地的敏感客戶資料。
成本彈性以及始終保持最新功能是市政公用事業公司轉向SaaS的原因。 MuniBilling報告稱,供水事業務部門對無需硬體更新周期即可實現即時報告的需求日益成長。 OracleOracle基礎設施2025會計年度52%的營收成長顯示企業級市場發展勢頭強勁,並鞏固了超大規模超大規模資料中心業者在公用事業計費軟體市場的地位。
到2025年,電力分銷公司將佔總收入的40.41%,這反映出舊有系統的複雜性以及強制性的智慧電網投資。同時,隨著5G網路的普及,市場對將數據、語音和能源服務整合到單一帳單中的收費系統的需求不斷成長,通訊業者將以12.71%的複合年成長率推動成長。由於智慧電錶的普及速度較慢,供水事業的發展相對落後,但其升級需求仍穩定。
最初為通訊業者開發的即時計費引擎(例如Neural Technologies的平台)現在正被改造以支援分時收費系統,從而擴展了其功能範圍。隨著各行業營運商對統一客戶體驗的需求日益成長,這種融合正在推動公用事業計費軟體產業的發展。
區域分析
到2025年,北美將佔全球收入的37.62%,這主要得益於其完善的法規結構以及由電網資產老化驅動的更新週期。智慧電錶的廣泛應用和各州逐步訂定的透明度規則將維持高支出水準。加拿大的全國性電錶更新計畫和墨西哥的電力分配產業改革正在推動需求成長,但美國仍然是核心收入來源。創業投資流入數位化優先供應商,證明了該地區的成熟度及其對自身能力發展藍圖的巨大影響力。
亞太地區以10.02%的複合年成長率實現最快成長,主要得益於印度2.5億電錶計畫和中國以人工智慧為核心的電網現代化。政府主導的資金籌措機制降低了採購門檻,而緊迫的時間表則加快了競標數量的成長。日本的關稅自由化和澳洲屋頂太陽能的蓬勃發展將進一步擴大環太平洋地區的公用事業收費軟體市場。
在歐洲,隨著可再生能源滲透率的不斷提高以及遵守《一般資料保護規則》(GDPR) 的實施,公用事業公司正面臨持續的升級需求。德國、荷蘭和北歐國家廣泛開展的產消者付費和V2G(車輛到電網)試點項目,增加了收費操作的複雜性。嚴格的隱私法規延長了採購週期,但有利於擁有認證資料處理流程的現有供應商,從而增強了它們的競爭優勢。
其他福利:
- Excel格式的市場預測(ME)表
- 3個月的分析師支持
目錄
第1章 引言
- 研究假設和市場定義
- 調查範圍
第2章調查方法
第3章執行摘要
第4章 市場情勢
- 市場概覽
- 市場促進因素
- 傳統計費系統和IT基礎設施改進
- 增加對智慧電網/AMI實施的投資
- 快速過渡到雲端優先的公共產業IT 架構
- 對明細化和近乎即時計費的合規壓力
- 「產消者」的興起和V2G支付要求
- 利用基於人工智慧的異常檢測減少非技術性損失
- 市場限制
- 中小公共產業缺乏數位技能
- 初始整合和資料遷移成本高昂
- 網路安全和資料隱私風險日益加劇
- 工會抄表員的勞工抵抗
- 價值/供應鏈分析
- 監管環境
- 技術展望
- 波特五力分析
- 供應商的議價能力
- 買方的議價能力
- 新進入者的威脅
- 替代品的威脅
- 激烈的競爭
- 定價分析
第5章 市場規模與成長預測
- 透過部署模式
- 本地部署
- 雲
- 混合
- 按最終用戶行業分類
- 供水事業
- 電力和配電
- 天然氣業務
- 溝通
- 地方政府公用事業多服務計費
- 按公用事業類型
- 電力
- 自來水廠
- 氣體
- 區域供暖和製冷
- 透過計費功能模組
- 客戶資訊系統(CIS)
- 計量資料管理(MDM)
- 支付處理和債務催收
- 分析與報告
- 費用和費率管理
- 按公司規模
- 投資者所有的公共產業(IOU)
- 地方政府/合作公共產業
- 私人零售能源供應商
- 按地區
- 北美洲
- 美國
- 加拿大
- 墨西哥
- 歐洲
- 德國
- 英國
- 法國
- 俄羅斯
- 其他歐洲
- 亞太地區
- 中國
- 日本
- 印度
- 韓國
- 澳洲
- 亞太其他地區
- 中東和非洲
- 中東
- 沙烏地阿拉伯
- 阿拉伯聯合大公國
- 其他中東地區
- 非洲
- 南非
- 埃及
- 其他非洲地區
- 中東
- 南美洲
- 巴西
- 阿根廷
- 北美洲
第6章 競爭情勢
- 市場集中度
- 策略趨勢
- 市佔率分析
- 公司簡介
- Oracle Corporation
- SAP SE
- Hansen Technologies Limited
- N. Harris Computer Corporation
- VertexOne, LLC
- Tyler Technologies, Inc.
- EnergyCAP, LLC
- Bynry Technologies Pvt. Ltd.
- Starnik Systems, Inc.
- MuniBilling, LLC
- Gentrack Group Limited
- Itineris NV
- Fluentgrid Limited
- Open International LLC
- Paymentus Holdings, Inc.
- ePsolutions, Inc.
- Utilibill Pty. Ltd.
- Jayhawk Software, Inc.
- Banyon Data Systems, Inc.
- Exceleron Software, Inc.
第7章 市場機會與未來趨勢
- 閒置頻段與未滿足需求評估
The utility billing software market was valued at USD 6.22 billion in 2025 and estimated to grow from USD 6.71 billion in 2026 to reach USD 9.79 billion by 2031, at a CAGR of 7.86% during the forecast period (2026-2031).
Tight regulatory timelines, accelerating smart-grid programs, and pressure to retire legacy mainframes propel sustained investments in modern platforms. Cloud-first deployment strategies, elastic analytics workloads, and near-real-time tariff engines underpin rapid vendor adoption among both municipal and investor-owned utilities. Consolidation activity-exemplified by VertexOne's recent financing and acquisition spree-signals growing private-equity confidence in the utility billing software market. At the same time, utilities confront mounting cyber-risk exposures that elevate security features from optional extras to core buying criteria. Demand for convergent billing across electricity, water, gas, and telecom services further widens the addressable base for platform vendors.
Global Utility Billing Software Market Trends and Insights
Growing Investment in Smart-Grid / AMI Roll-outs
Advanced metering infrastructure programs generate sustained platform demand by flooding utilities with high-frequency usage data that legacy batch systems cannot manage. India's Revamped Distribution Sector Scheme alone targets 250 million installations by 2026, supported by USD 15 billion investment commitments. The design-build-finance-operate-own-transfer model shifts capital risk to service providers, guaranteeing recurring SaaS revenue streams for the utility billing software market. Each residential smart meter produces more than 35,000 readings annually, forcing utilities to favor cloud-native billing engines that scale elastically.
Rapid Shift Toward Cloud-First Utility IT Architectures
Oracle's cloud revenue climbed to USD 5.9 billion in Q2 FY2025-up 24% year on year-as utilities migrate customer information systems and tariff engines into multi-tenant SaaS environments. Cloud frameworks shorten new-tariff launch cycles from months to weeks, a critical advantage when regulators approve dynamic time-of-use pricing. Lower upfront costs enable mid-sized municipal utilities to access feature depth once reserved for investor-owned enterprises, expanding the utility billing software market footprint among long-tail customers.
High Upfront Integration and Data-Migration Costs
Legacy CIS conversion often consumes 40-60% of project budgets because decades-old records require cleansing and schema alignment. Small public-power utilities serving fewer than 50 000 customers lack dedicated IT staff, pushing them toward external consultants that double total implementation expense. These cost hurdles delay modernization unless offset by subscription-based SaaS alternatives, a trend that nonetheless shifts expense from capital to operating budgets.
Other drivers and restraints analyzed in the detailed report include:
- Compliance Pressure for Itemised, Near-Real-Time Billing
- AI-Based Anomaly Detection Reducing Non-Technical Losses
- Escalating Cyber-Security and Data-Privacy Risks
For complete list of drivers and restraints, kindly check the Table Of Contents.
Segment Analysis
Cloud platforms captured 43.62% of 2025 revenue and will post a 13.52% CAGR to 2031, underscoring their status as the primary growth engine for the utility billing software market. On-premise implementations persist among large investor-owned utilities with sunk-cost datacenters, yet expansion remains muted. Hybrid rollouts act as bridge architectures, allowing regulated utilities to protect sensitive customer data on-premise while scaling meter-data crunching in public clouds.
Cost elasticity and always-current feature sets explain why municipal operators pivot toward SaaS. MuniBilling reports rising demand from water districts seeking real-time reporting without hardware refresh cycles. Oracle Cloud Infrastructure's 52% revenue jump in fiscal 2025 illustrates enterprise-scale migration momentum, reinforcing the role of hyperscalers in the utility billing software market.
Electricity distributors held 40.41% revenue share in 2025, reflecting legacy complexity and mandatory smart-grid investments. Telecommunications utilities, however, lead growth at 12.71% CAGR as 5G rollouts demand convergent charging systems that reconcile data, voice, and energy services on a single invoice. Water utilities trail due to slower smart-meter penetration, but present stable replacement demand.
Real-time rating engines originally built for telcos-such as Neural Technologies' platform-are now repurposed for time-of-use energy tariffs, widening addressable functionality. This convergence bolsters the utility billing software industry as cross-sector operators seek unified customer journeys.
The Utility Billing Software Market Report is Segmented by Deployment Mode (On-Premise, Cloud, Hybrid), End-User Industry (Water Utilities, and More), Utility Type (Electricity, Water, and More), Billing-Function Module (Customer Information System, Meter Data Management, and More), Organisation Size (Investor-Owned Utilities, Municipal, and More), and Geography. The Market Forecasts are Provided in Terms of Value (USD).
Geography Analysis
North America generated 37.62% of global revenue in 2025, anchored by advanced regulatory frameworks and aging grid assets that mandate upgrade cycles. Widespread smart-meter penetration and state-specific transparency rules keep spending elevated. Canada's nationwide meter refresh and Mexico's distribution-sector reforms add incremental demand, though the United States remains the core revenue pool. Venture capital inflows into digital-first vendors underscore the region's maturity and its outsized influence on functional roadmaps.
Asia-Pacific posts the fastest growth at 10.02% CAGR, propelled by India's 250 million-meter program and China's AI-centric grid modernization. Government-led funding mechanisms lower procurement barriers, while aggressive timelines accelerate tender volumes. Japan's tariff liberalization and Australia's rooftop solar boom further expand the utility billing software market across the Pacific Rim.
Europe delivers steady replacement demand as utilities integrate high renewable penetration and comply with GDPR. Extensive prosumer settlements and vehicle-to-grid pilots in Germany, the Netherlands, and the Nordics elevate billing complexity. Stringent privacy rules lengthen procurement cycles but favor established vendors with certified data processes, fortifying competitive moats.
- Oracle Corporation
- SAP SE
- Hansen Technologies Limited
- N. Harris Computer Corporation
- VertexOne, LLC
- Tyler Technologies, Inc.
- EnergyCAP, LLC
- Bynry Technologies Pvt. Ltd.
- Starnik Systems, Inc.
- MuniBilling, LLC
- Gentrack Group Limited
- Itineris NV
- Fluentgrid Limited
- Open International LLC
- Paymentus Holdings, Inc.
- ePsolutions, Inc.
- Utilibill Pty. Ltd.
- Jayhawk Software, Inc.
- Banyon Data Systems, Inc.
- Exceleron Software, Inc.
Additional Benefits:
- The market estimate (ME) sheet in Excel format
- 3 months of analyst support
TABLE OF CONTENTS
1 INTRODUCTION
- 1.1 Study Assumptions and Market Definition
- 1.2 Scope of the Study
2 RESEARCH METHODOLOGY
3 EXECUTIVE SUMMARY
4 MARKET LANDSCAPE
- 4.1 Market Overview
- 4.2 Market Drivers
- 4.2.1 Improvement in legacy billing systems and IT infrastructure
- 4.2.2 Growing investment in smart-grid / AMI roll-outs
- 4.2.3 Rapid shift toward cloud-first utility IT architectures
- 4.2.4 Compliance pressure for itemised, near-real-time billing
- 4.2.5 Rise of "prosumer" and V2G settlement requirements
- 4.2.6 AI-based anomaly detection reducing non-technical losses
- 4.3 Market Restraints
- 4.3.1 Digital-skills gap at small and mid-size utilities
- 4.3.2 High upfront integration and data-migration costs
- 4.3.3 Escalating cyber-security and data-privacy risks
- 4.3.4 Workforce resistance from unionised meter-reading staff
- 4.4 Value / Supply-Chain Analysis
- 4.5 Regulatory Landscape
- 4.6 Technological Outlook
- 4.7 Porter's Five Forces Analysis
- 4.7.1 Bargaining Power of Suppliers
- 4.7.2 Bargaining Power of Buyers
- 4.7.3 Threat of New Entrants
- 4.7.4 Threat of Substitutes
- 4.7.5 Intensity of Rivalry
- 4.8 Pricing Analysis
5 MARKET SIZE AND GROWTH FORECASTS (VALUE)
- 5.1 By Deployment Mode
- 5.1.1 On-premise
- 5.1.2 Cloud
- 5.1.3 Hybrid
- 5.2 By End-user Industry
- 5.2.1 Water Utilities
- 5.2.2 Electricity and Power Distribution
- 5.2.3 Gas Utilities
- 5.2.4 Telecommunications
- 5.2.5 Multi-service Municipal Utilities
- 5.3 By Utility Type
- 5.3.1 Electricity
- 5.3.2 Water
- 5.3.3 Gas
- 5.3.4 District Heating and Cooling
- 5.4 By Billing-Function Module
- 5.4.1 Customer Information System (CIS)
- 5.4.2 Meter Data Management (MDM)
- 5.4.3 Payment Processing and Collections
- 5.4.4 Analytics and Reporting
- 5.4.5 Tariff and Rate Management
- 5.5 By Organisation Size
- 5.5.1 Investor-Owned Utilities (IOU)
- 5.5.2 Municipal / Cooperative Utilities
- 5.5.3 Private Retail Energy Providers
- 5.6 By Geography
- 5.6.1 North America
- 5.6.1.1 United States
- 5.6.1.2 Canada
- 5.6.1.3 Mexico
- 5.6.2 Europe
- 5.6.2.1 Germany
- 5.6.2.2 United Kingdom
- 5.6.2.3 France
- 5.6.2.4 Russia
- 5.6.2.5 Rest of Europe
- 5.6.3 Asia-Pacific
- 5.6.3.1 China
- 5.6.3.2 Japan
- 5.6.3.3 India
- 5.6.3.4 South Korea
- 5.6.3.5 Australia
- 5.6.3.6 Rest of Asia-Pacific
- 5.6.4 Middle East and Africa
- 5.6.4.1 Middle East
- 5.6.4.1.1 Saudi Arabia
- 5.6.4.1.2 United Arab Emirates
- 5.6.4.1.3 Rest of Middle East
- 5.6.4.2 Africa
- 5.6.4.2.1 South Africa
- 5.6.4.2.2 Egypt
- 5.6.4.2.3 Rest of Africa
- 5.6.4.1 Middle East
- 5.6.5 South America
- 5.6.5.1 Brazil
- 5.6.5.2 Argentina
- 5.6.1 North America
6 COMPETITIVE LANDSCAPE
- 6.1 Market Concentration
- 6.2 Strategic Moves
- 6.3 Market Share Analysis
- 6.4 Company Profiles (includes Global-level overview, Market-level overview, Core segments, Financials as available, Strategic information, Market rank/share, Products and services, Recent developments)
- 6.4.1 Oracle Corporation
- 6.4.2 SAP SE
- 6.4.3 Hansen Technologies Limited
- 6.4.4 N. Harris Computer Corporation
- 6.4.5 VertexOne, LLC
- 6.4.6 Tyler Technologies, Inc.
- 6.4.7 EnergyCAP, LLC
- 6.4.8 Bynry Technologies Pvt. Ltd.
- 6.4.9 Starnik Systems, Inc.
- 6.4.10 MuniBilling, LLC
- 6.4.11 Gentrack Group Limited
- 6.4.12 Itineris NV
- 6.4.13 Fluentgrid Limited
- 6.4.14 Open International LLC
- 6.4.15 Paymentus Holdings, Inc.
- 6.4.16 ePsolutions, Inc.
- 6.4.17 Utilibill Pty. Ltd.
- 6.4.18 Jayhawk Software, Inc.
- 6.4.19 Banyon Data Systems, Inc.
- 6.4.20 Exceleron Software, Inc.
7 MARKET OPPORTUNITIES AND FUTURE TRENDS
- 7.1 White-space and Unmet-Need Assessment
 全球租戶計費軟體市場
 2026年全球公用事業計費軟體市場報告2026年全球線上收費系統市場報告
 租戶計費軟體市場:按解決方案類型、產業和部署模式分類,全球預測(2026-2032年)融合收費軟體和服務市場:按部署方式、組織規模和最終用戶分類 - 全球預測,2026-2032 年直流計費電錶市場:按計費方式、電錶技術、連接技術、相型和應用分類-全球預測,2026-2032年
 融合計費軟體和服務市場規模、佔有率和成長分析:按組件、部署模式、組織規模、最終用戶和地區分類-2026-2033年產業預測
 線上收費系統市場分析及預測(至2035年):按類型、產品類型、服務、技術、組件、應用、部署類型、最終用戶、功能和解決方案分類
 公用事業收費計費軟體市場報告:按部署模式、類型、最終用戶和地區分類,2026-2034 年按組件、租戶類型、部署類型、服務供應商、應用程式和最終用途分類的分錶計費軟體市場,全球預測,2026-2032 年