


 |
市場調查報告書
商品編碼
1939683
瓦楞紙包裝:市佔率分析、產業趨勢與統計、成長預測(2026-2031)Corrugated Board Packaging - Market Share Analysis, Industry Trends & Statistics, Growth Forecasts (2026 - 2031) |
||||||
※ 本網頁內容可能與最新版本有所差異。詳細情況請與我們聯繫。
預計到 2026 年,瓦楞紙包裝市場價值將達到 2,057.4 億美元,高於 2025 年的 1,983.4 億美元,預計到 2031 年將達到 2,471 億美元。
預計2026年至2031年年複合成長率(CAGR)為3.73%。
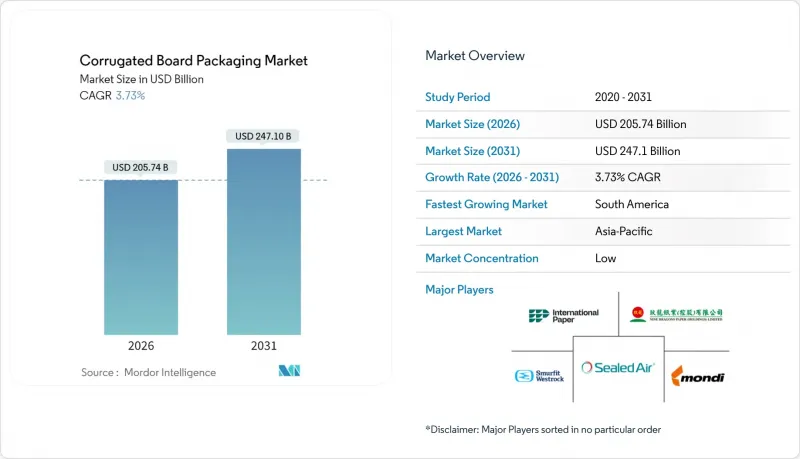
這種穩步擴張反映了政策主導的塑膠替代、蓬勃發展的電子商務以及數位化和人工智慧製造工具的快速普及。歐盟的《包裝和包裝廢棄物法規》以及美國五個州的《生產者延伸責任法》等監管壓力,正促使品牌所有者轉向更易於回收的包裝形式,從而加速纖維需求的成長。供應面的限制(受舊瓦楞紙板價格和能源成本波動的影響)有助於維持價格穩定,而混合式數位柔版印刷機等下游技術則為大規模客製化創造了機會。競爭優勢正向垂直整合的生產商轉移,這些生產商能夠確保纖維原料,投資建造節能工廠,並利用人工智慧最佳化包裝盒設計。
全球瓦楞紙包裝市場趨勢與洞察
強制使用環保材質促進纖維替代
新的可回收性法規正推動包裝選擇轉向纖維基材料。歐盟要求所有包裝在2030年之前必須可回收,加上塑膠的最低再生材料含量配額,使得瓦楞紙板成為低風險的合規選擇。美國已有五個州實施了獎勵可回收基材的收費系統,與塑膠包裝相比,可回收基材的成本優勢高達15%。由於塑膠回收再利用基礎設施建設的延誤導致2030年的最後期限被推遲,各大品牌正在加速轉型。瓦楞紙板71%至76%的回收率簡化了審核追蹤,有助於企業履行其環境、社會和治理(ESG)承諾,並降低被處罰的風險。造紙廠報告稱,在加工商重新配置生產線以滿足零售商標準後,纖維基SKU的訂單前置作業時間縮短了兩週。
電子商務小包裹數量的激增正在重塑包裝規格。
全球電子商務運輸量預計將從2024年的2,200億件增加到2029年的3,400億件,這使得跌落測試耐久性和體積重量效率等特性變得癒發重要。目前,主要物流供應商超過四分之一的小包裹都採用雙層瓦楞紙板或微瓦楞紙板製成。設備供應商正積極回應此需求,推出按需製箱系統,透過減少緩衝材料的使用,將每筆訂單的人事費用降低40%,材料成本降低15%。訂閱電商企業對可印刷內襯的需求日益成長,希望透過內襯展現品牌故事,這進一步推動了運輸容器內數位印刷圖形的應用。這些變化鞏固了瓦楞紙包裝作為運輸媒介和行銷工具的雙重角色。
可重複使用塑膠容器和可回收垃圾桶的興起,應對了一次性使用需求帶來的挑戰。
零售商正在擴大用於盛裝生鮮和肉類的可回收塑膠容器(RPC)的使用範圍,因為這種容器可以減少門市層面的浪費和人工成本。法國、德國和韓國已經實施了重複使用配額和押金制度,鼓勵使用耐用塑膠箱而不是一次性紙板箱。自動化清潔網路可以將每個RPC的成本在25次循環後降低到0.25美元以下,低於可預測的生鮮食品供應鏈中一次性容器的成本。瓦楞紙板加工商正在使用高阻隔阻隔性防潮塗層和防篡改鎖扣來保住市場佔有率,但在高周轉率通路中,他們正面臨利潤率壓力。
細分市場分析
截至2025年,在成熟的回收網路和有利的生產者延伸責任制(EPR)收費系統的支撐下,再生紙將佔瓦楞紙包裝市場55.05%的佔有率。隨著品牌商提高再生紙含量標準,預計該細分市場將以4.56%的複合年成長率成長。原生牛皮紙襯紙仍然是重型出口紙箱的重要組成部分,但其市場佔有率持續下降。小麥秸稈、稻殼和番茄莖稈紙漿目前正處於商業試點階段。實驗室研究表明,與傳統再生紙漿相比,這些紙漿的抗張強度提高了25%。投資建造區域性紙漿生產設施對於控制原料水分和降低物流成本至關重要。成功的規模化生產可望緩解再生紙價格波動,並透過纖維來源多元化增強供應鏈的韌性。
農業廢棄物紙漿也具有環境效益,它無需砍伐森林,與原生木纖維相比,可降低20-25%的碳排放強度。義大利和印度的領先已在瓦楞紙板生產設備的基礎上,以15-20%的混合比例添加農業廢棄物。儘管食品接觸認證框架仍在發展完善中,但生產商預計到2027年監管將趨於統一。這些創新標誌著瓦楞紙包裝市場正從「原生與再生」的二元對立轉向多元化的纖維組合,從而更好地適應當地資源限制。
2025年,傳統常規開槽紙箱(RSC)的市佔率為32.05%,而折疊式紙箱預計到2031年將以5.48%的複合年成長率成長。這主要得益於電商品牌商對快速組裝設計的需求,以提升拆箱體驗。自動化組裝設備每分鐘可處理35個折疊式紙箱,比人工RSC生產線快40%,顯著降低了履約中心的人事費用。就瓦楞紙包裝市場規模而言,預計此轉變將在2026年至2031年間新增89億美元的市場規模。
在體積效率和托盤堆疊性至關重要的領域,例如工業備件分銷,開槽紙箱保持著成本優勢。伸縮紙箱和硬紙箱則佔據高階市場,例如高階電子產品領域,在這些領域,視覺美感和抗壓性能比材料成本更為重要。可數位印刷的折疊紙箱結構擴大採用易撕條和回封條,以適應全通路物流流程。結構技術的演進表明,性能標準、自動化能力和消費者參與度如何共同影響瓦楞紙包裝市場的規格趨勢。
區域分析
到2025年,亞太地區將佔全球瓦楞紙包裝市場收入的39.85%,主要得益於製造業整合和成本效益高的纖維採購。九龍紙業正在將其年產能擴大至2537萬噸,進一步鞏固了該地區的供應優勢。中國的經濟獎勵策略正在提振國內消費,而越南和馬來西亞的出口型紙廠也正積極服務「一帶一路」貿易走廊。此外,廢紙進口配額的投資也促進了當地農業廢棄物製漿試驗計畫的發展,從而降低了對舊瓦楞紙板(OCC)的依賴。
南美洲是成長最快的走廊,預計2031年複合年成長率將達到7.05%。儘管面臨宏觀經濟逆風,巴西瓦楞紙箱出貨量仍然成長,因為生產商調整了工廠佈局以適應出口市場。克拉文公司在巴拉那州新建的工廠代表著對未來產能擴張的投資,而智利和哥倫比亞的加工商則正在投資自動化折疊和黏合設備,以滿足電商包裝盒的需求。該地區擁有豐富的甘蔗渣和桉樹種植園,實現了纖維自給自足,使其成為未來農業廢棄物供應中心。
北美和歐洲正保持穩定的中個位數成長,這主要得益於監管合規和增值創新。隨著歐盟回收強制令於2025年生效,目前已有6%的塑膠運輸包裝被瓦楞紙板取代。國際紙業以72億美元收購DS Smith,擴大了其在兩大洲的永續包裝平台,預計到2027年將產生6億至7億美元的協同效應。能源效率是歐洲造紙廠維修的重點,斯道拉恩索位於奧盧的生產線溫室氣體排放強度比傳統造紙機降低了20%。在美國,數位印刷機的應用已超過瓦楞紙板印刷產能的18%,加速了消費品產業的大量客製化進程。
其他福利:
- Excel格式的市場預測(ME)表
- 分析師支持(3個月)
目錄
第1章 引言
- 研究假設和市場定義
- 調查範圍
第2章調查方法
第3章執行摘要
第4章 市場情勢
- 市場概覽
- 市場促進因素
- 強制使用環保材料
- 電子商務小包裹激增
- 數位印刷機和柔版印刷機混合技術的進展
- 輕質箱板紙的經濟性
- 人工智慧驅動的包裝盒設計最佳化
- 農業廢棄物製漿
- 市場限制
- 採用可重複使用的塑膠和可回收塑膠容器
- 回收紙(OCC)和能源價格波動
- 紙板製造機的電力消耗量上限
- 對工廠工業用水取水的限制
- 供應鏈分析
- 監管環境
- 技術展望
- 波特五力分析
- 供應商的議價能力
- 買方的議價能力
- 新進入者的威脅
- 替代品的威脅
- 競爭對手之間的競爭
第5章 市場規模與成長預測
- 依材料類型
- 原生貨櫃紙板
- 再生紙箱
- 盒子樣式/結構
- 開槽盒
- 望遠鏡收納盒
- 硬盒
- 文件夾盒
- 按最終用戶行業分類
- 食物
- 加工食品
- 生鮮食品和農產品
- 飲料
- 個人護理和家居用品
- 電子商務與履約
- 醫療和藥品
- 電氣和電子設備
- 產業
- 其他終端用戶產業
- 食物
- 依電路板類型
- 單層壁
- 雙層壁
- 三層壁
- 微型長笛
- 透過印刷技術
- 柔版印刷
- 數位的
- 光刻
- 螢幕
- 按地區
- 北美洲
- 美國
- 加拿大
- 墨西哥
- 歐洲
- 德國
- 英國
- 法國
- 義大利
- 西班牙
- 荷蘭
- 俄羅斯
- 其他歐洲地區
- 亞太地區
- 中國
- 日本
- 印度
- 韓國
- 澳洲
- 新加坡
- 亞太其他地區
- 中東和非洲
- 中東
- 沙烏地阿拉伯
- 阿拉伯聯合大公國
- 土耳其
- 其他中東地區
- 非洲
- 南非
- 奈及利亞
- 埃及
- 其他非洲地區
- 中東
- 南美洲
- 巴西
- 阿根廷
- 南美洲其他地區
- 北美洲
第6章 競爭情勢
- 市場集中度
- 策略趨勢
- 市佔率分析
- 公司簡介
- International Paper Company
- Smurfit WestRock
- Mondi Group
- Nine Dragons Paper(Holdings)Limited
- Georgia-Pacific LLC
- Oji Holdings Corporation
- Stora Enso Oyj
- Sealed Air Corporation
- Pratt Industries
- Rengo Co., Ltd.
- Packaging Corporation of America
- Lee & Man Paper Manufacturing
- Klabin SA
- Cascades Inc.
- SCG Packaging
- Saica Group
- Orora Limited
- Visy Industries
- Grupo Gondi
- Astron Paper & Board Mill
- APP(Sinar Mas)
- Napco National
第7章 市場機會與未來展望
The Corrugated Board Packaging Market size in 2026 is estimated at USD 205.74 billion, growing from 2025 value of USD 198.34 billion with 2031 projections showing USD 247.1 billion, growing at 3.73% CAGR over 2026-2031.
The measured expansion reflects policy-driven substitution of plastics, fast-growing e-commerce volumes, and rapid adoption of digital and AI manufacturing tools. Regulatory pressure, led by the European Union's Packaging and Packaging Waste Regulation and five U.S. state Extended Producer Responsibility laws, is accelerating fiber demand as brand owners pivot toward readily recyclable formats. Supply-side tightness-caused by volatile old-corrugated-cardboard (OCC) prices and energy costs-supports pricing discipline, while downstream technology such as hybrid digital-flexo presses unlocks mass customization opportunities. Competitive advantage is shifting toward vertically integrated producers able to secure raw fiber, invest in energy-efficient mills, and deploy AI-enabled box-design optimization.
Global Corrugated Board Packaging Market Trends and Insights
Eco-friendly material mandates drive fiber substitution
New recyclability rules are tilting packaging material choices toward fiber. The EU requirement that all packaging be recyclable by 2030, alongside minimum recycled-content quotas for plastics, has made corrugated the low-risk compliance option. Five U.S. states impose fee scales that reward recyclable substrates, creating cost advantages of up to 15% versus plastic formats. Brands are accelerating specification changes because plastic recycling infrastructure lag times exceed the 2030 deadline. Corrugated's 71-76% recovery rate simplifies audit trails, supports corporate ESG pledges, and limits penalty exposure. Mill operators report order lead-times for fiber-based SKUs shortening by two weeks as converters re-tool lines to meet retailer scorecard requirements.
E-commerce parcel explosion reshapes packaging specifications
Global e-commerce shipping volumes grew from 220 billion parcels in 2024 to a projected 340 billion by 2029, elevating functional priorities such as drop-test durability and dimensional-weight efficiency. Double-wall and micro-flute boards now constitute over one-quarter of parcels shipped via major integrators. Equipment suppliers respond with on-demand boxmaking systems that trim labor by 40% while reducing void-fill needs, thereby cutting per-order materials cost by 15%. Subscription-commerce operators are specifying printable interiors for brand storytelling, which further boosts the loading of digitally printed graphics inside the shipping container. These shifts cement corrugated's role as both a transport medium and a marketing surface.
Reusable plastics and RPCs adoption challenges single-use demand
Retailers expand returnable-plastic-container (RPC) pools for produce and meat because they cut shrinkage and reduce labor at the store level. France, Germany, and South Korea have introduced reuse quotas or deposit schemes that favor durable crates over single-use corrugated. Automated wash-back networks lower per-trip RPC cost below USD 0.25 when cycle counts exceed 25, undercutting single-use units for predictable fresh-food supply chains. Corrugated converts defend share using high-barrier moisture-resistant coatings and tamper-evident locking tabs, but face margin squeeze in high-turnover channels.
Other drivers and restraints analyzed in the detailed report include:
- Advances in digital and flexo hybrid presses enable mass customization
- AI-driven box-design optimisation reduces material consumption
- Volatile OCC and energy prices compress manufacturing margins
For complete list of drivers and restraints, kindly check the Table Of Contents.
Segment Analysis
Recycled grades commanded 55.05% of the corrugated board packaging market share in 2025, buoyed by mature collection networks and favorable EPR fee structures. The segment is forecast to grow at 4.56% CAGR as brand owners raise post-consumer-content thresholds. Virgin Kraft liner retains relevance for heavy-duty export cartons, but its volume share continues to erode. Wheat-straw, rice-husk, and tomato-stem pulps are entering commercial pilots; laboratory work shows tensile strength gains of up to 25% over conventional recycled pulp. Investment in regional decentralized pulping units is crucial to control raw-material moisture and logistics costs. Successful scale-up would temper OCC price cycles and diversify fiber sourcing, strengthening supply-chain resilience.
Agricultural-waste pulps also deliver environmental gains, trimming carbon intensity by 20-25% relative to virgin wood fiber because they bypass forest-harvesting steps. Early adopters in Italy and India are integrating agri-waste at 15-20% blend ratios without modifying corrugator settings. Though certification frameworks for food-contact compliance remain nascent, producers expect regulatory alignment by 2027. These innovations signal that the corrugated board packaging market will shift from a binary virgin-versus-recycled narrative to a broader multi-fiber portfolio, reinforcing its adaptability to regional resource constraints.
Traditional regular slotted containers (RSCs) held a 32.05% share in 2025, but folder-type formats are projected to increase at a 5.48% CAGR through 2031, propelled by e-commerce brand owners seeking quick-assembly designs that enhance the unboxing experience. Automated erecting equipment processes folder styles at 35 boxes min-1, 40% faster than manual RSC lines, saving fulfillment centers significant labor. In the corrugated board packaging market size context, this shift translates into incremental revenue of USD 8.9 billion between 2026 and 2031.
Slotted boxes retain cost advantages where cube efficiency and palletization are paramount, such as industrial spare parts distribution. Telescope and rigid-set boxes occupy premium niches, including luxury electronics, where visual aesthetics and crush prevention outweigh material cost. Digital print-ready folder constructions increasingly integrate tear-strips and returnable seals, aligning with omnichannel logistics flows. The evolving construction landscape illustrates how performance criteria, automation capability, and consumer engagement jointly influence specification trends within the corrugated board packaging market.
The Corrugated Board Packaging Market Report is Segmented by Material Type (Virgin Containerboard, and Recycled Containerboard), Box Style (Slotted Boxes, Telescope Boxes, and More), End-User Industry (Food, Beverages, Personal and Household Care, and More), Board Type (Single Wall, Double Wall, and More), Printing Technology (Flexography, Digital, and More), and Geography. The Market Forecasts are Provided in Terms of Value (USD).
Geography Analysis
Asia-Pacific accounted for 39.85% of global corrugated board packaging market revenue in 2025 and continues to leverage manufacturing integration and cost-effective fiber sourcing. Nine Dragons Paper expanded annual capacity to 25.37 million tonnes, underpinning the region's supply dominance. China's stimulus measures stimulate domestic consumption, yet export-oriented plants in Vietnam and Malaysia now serve Belt-and-Road trade corridors. Investment in waste-paper-import quotas also encourages local agri-waste pulping pilots, mitigating OCC dependency.
South America represents the fastest-growing corridor, with a 7.05% CAGR projected to 2031. Brazil's containerboard shipments increased despite macro headwinds as producers realigned mills for export markets. Klabin's new Parana facility exemplifies forward-capacity bets, while Chilean and Colombian converters invest in folder-gluer automation to meet e-commerce box styles. Fiber self-sufficiency, anchored in abundant sugar-cane bagasse and eucalyptus plantations, positions the region as a future agri-waste supply hub.
North America and Europe exhibit steady mid-single-digit growth anchored in regulatory compliance and value-added innovation. The EU recyclability mandate that took effect in 2025 has already shifted 6% of plastic transit-packaging volume into corrugated. International Paper's USD 7.2 billion buyout of DS Smith extends its sustainable-packaging footprint across both continents and is expected to unlock USD 600-700 million in synergy by 2027. European mill upgrades prioritize energy conservation, with Stora Enso's Oulu line claiming 20% lower greenhouse-gas intensity than legacy paper machines. In the United States, digital press penetration exceeds 18% of installed corrugated print capacity, accelerating mass customization in consumer packaged goods.
- International Paper Company
- Smurfit WestRock
- Mondi Group
- Nine Dragons Paper (Holdings) Limited
- Georgia-Pacific LLC
- Oji Holdings Corporation
- Stora Enso Oyj
- Sealed Air Corporation
- Pratt Industries
- Rengo Co., Ltd.
- Packaging Corporation of America
- Lee & Man Paper Manufacturing
- Klabin S.A.
- Cascades Inc.
- SCG Packaging
- Saica Group
- Orora Limited
- Visy Industries
- Grupo Gondi
- Astron Paper & Board Mill
- APP (Sinar Mas)
- Napco National
Additional Benefits:
- The market estimate (ME) sheet in Excel format
- 3 months of analyst support
TABLE OF CONTENTS
1 INTRODUCTION
- 1.1 Study Assumptions and Market Definition
- 1.2 Scope of the Study
2 RESEARCH METHODOLOGY
3 EXECUTIVE SUMMARY
4 MARKET LANDSCAPE
- 4.1 Market Overview
- 4.2 Market Drivers
- 4.2.1 Eco-friendly material mandates
- 4.2.2 E-commerce parcel explosion
- 4.2.3 Advances in digital and flexo hybrid presses
- 4.2.4 Light-weight containerboard economics
- 4.2.5 AI-driven box-design optimisation
- 4.2.6 Agricultural-waste fibre pulping
- 4.3 Market Restraints
- 4.3.1 Reusable plastics and RPCs adoption
- 4.3.2 Volatile OCC and energy prices
- 4.3.3 Corrugator electricity-intensity caps
- 4.3.4 Industrial-water withdrawal limits at mills
- 4.4 Supply-Chain Analysis
- 4.5 Regulatory Landscape
- 4.6 Technological Outlook
- 4.7 Porter's Five Forces Analysis
- 4.7.1 Bargaining Power of Suppliers
- 4.7.2 Bargaining Power of Buyers
- 4.7.3 Threat of New Entrants
- 4.7.4 Threat of Substitutes
- 4.7.5 Intensity of Competitive Rivalry
5 MARKET SIZE AND GROWTH FORECASTS (VALUES)
- 5.1 By Material Type
- 5.1.1 Virgin Containerboard
- 5.1.2 Recycled Containerboard
- 5.2 By Box Style / Construction
- 5.2.1 Slotted Boxes
- 5.2.2 Telescope Boxes
- 5.2.3 Rigid Boxes
- 5.2.4 Folder Boxes
- 5.3 By End-User Industry
- 5.3.1 Food
- 5.3.1.1 Processed Foods
- 5.3.1.2 Fresh Food and Produce
- 5.3.2 Beverages
- 5.3.3 Personal and Household Care
- 5.3.4 E-commerce and Fulfilment
- 5.3.5 Healthcare and Pharmaceuticals
- 5.3.6 Electrical and Electronics
- 5.3.7 Industrial
- 5.3.8 Other End-user Industry
- 5.3.1 Food
- 5.4 By Board Type
- 5.4.1 Single Wall
- 5.4.2 Double Wall
- 5.4.3 Triple Wall
- 5.4.4 Micro-flute
- 5.5 By Printing Technology
- 5.5.1 Flexography
- 5.5.2 Digital
- 5.5.3 Lithography
- 5.5.4 Screen
- 5.6 By Geography
- 5.6.1 North America
- 5.6.1.1 United States
- 5.6.1.2 Canada
- 5.6.1.3 Mexico
- 5.6.2 Europe
- 5.6.2.1 Germany
- 5.6.2.2 United Kingdom
- 5.6.2.3 France
- 5.6.2.4 Italy
- 5.6.2.5 Spain
- 5.6.2.6 Netherlands
- 5.6.2.7 Russia
- 5.6.2.8 Rest of Europe
- 5.6.3 Asia-Pacific
- 5.6.3.1 China
- 5.6.3.2 Japan
- 5.6.3.3 India
- 5.6.3.4 South Korea
- 5.6.3.5 Australia
- 5.6.3.6 Singapore
- 5.6.3.7 Rest of Asia-Pacific
- 5.6.4 Middle East and Africa
- 5.6.4.1 Middle East
- 5.6.4.1.1 Saudi Arabia
- 5.6.4.1.2 United Arab Emirates
- 5.6.4.1.3 Turkey
- 5.6.4.1.4 Rest of Middle East
- 5.6.4.2 Africa
- 5.6.4.2.1 South Africa
- 5.6.4.2.2 Nigeria
- 5.6.4.2.3 Egypt
- 5.6.4.2.4 Rest of Africa
- 5.6.4.1 Middle East
- 5.6.5 South America
- 5.6.5.1 Brazil
- 5.6.5.2 Argentina
- 5.6.5.3 Rest of South America
- 5.6.1 North America
6 COMPETITIVE LANDSCAPE
- 6.1 Market Concentration
- 6.2 Strategic Moves
- 6.3 Market Share Analysis
- 6.4 Company Profiles (includes Global level Overview, Market level overview, Core Segments, Financials as available, Strategic Information, Market Rank/Share for key companies, Products and Services, and Recent Developments)
- 6.4.1 International Paper Company
- 6.4.2 Smurfit WestRock
- 6.4.3 Mondi Group
- 6.4.4 Nine Dragons Paper (Holdings) Limited
- 6.4.5 Georgia-Pacific LLC
- 6.4.6 Oji Holdings Corporation
- 6.4.7 Stora Enso Oyj
- 6.4.8 Sealed Air Corporation
- 6.4.9 Pratt Industries
- 6.4.10 Rengo Co., Ltd.
- 6.4.11 Packaging Corporation of America
- 6.4.12 Lee & Man Paper Manufacturing
- 6.4.13 Klabin S.A.
- 6.4.14 Cascades Inc.
- 6.4.15 SCG Packaging
- 6.4.16 Saica Group
- 6.4.17 Orora Limited
- 6.4.18 Visy Industries
- 6.4.19 Grupo Gondi
- 6.4.20 Astron Paper & Board Mill
- 6.4.21 APP (Sinar Mas)
- 6.4.22 Napco National
7 MARKET OPPORTUNITIES AND FUTURE OUTLOOK
- 7.1 White-space and Unmet-Need Assessment


