


 |
市場調查報告書
商品編碼
1939682
計程車:市場佔有率分析、產業趨勢和統計數據、成長預測(2026-2031 年)Taxi - Market Share Analysis, Industry Trends & Statistics, Growth Forecasts (2026 - 2031) |
||||||
※ 本網頁內容可能與最新版本有所差異。詳細情況請與我們聯繫。
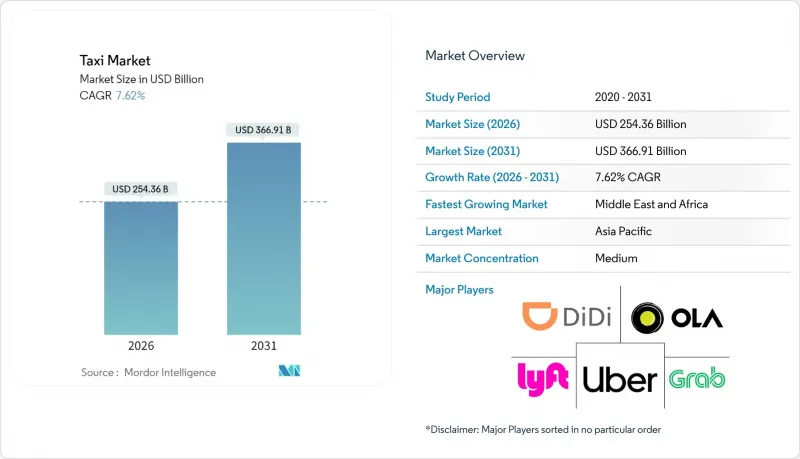
2025年計程車市場價值為2,363.6億美元,預計到2031年將達到3,669.1億美元,而2026年為2,543.6億美元。
預測期(2026-2031 年)的複合年成長率預計為 7.62%。
數位融合、人工智慧驅動的調度系統以及不斷成長的都市區凸顯了計程車市場蓬勃發展的規模。超級應用程式將按需出行與餐飲、支付和金融服務相結合,加速了市場需求,而一鍵預訂功能則提升了平台用戶黏著度和平均用戶收入。營運商正透過提供電動、自動駕駛和無障礙車輛來擴展服務組合,從而降低全生命週期營運成本並探索車載廣告等新的收入來源。各國政府日益將叫車視為公共交通的補充,並推出政策鼓勵電動車普及、提升無障礙出行體驗並促進數據共用。這為擁有強大監管團隊的靈活運營商創造了優勢。這些因素共同重塑了司機經濟狀況,迫使產業相關人員投資於演算法定價、動態路線規劃和垂直整合,以縮短乘車時間並提高車隊運轉率。
全球計程車市場趨勢與洞察
智慧型手機的快速普及和網路環境的發展
在主要都市區,智慧型手機普及率已超過 80%,平台利用演算法快速匹配乘客和駕駛人,將主要城市的平均等待時間從 15-20 分鐘縮短至 5 分鐘以內。 5G 網路的廣泛覆蓋實現了高度精準的定位資訊,提高了車輛運轉率,減少了空駛里程。更快的資料通訊傳輸速度支援應用程式內影片廣告和即時駕駛人培訓,從而拓展了收入來源。在已開發市場,整合到叫車應用的行動錢包交易量已佔總交易量的五分之四以上,有助於降低現金交易風險,縮短機場候機時間。在新興經濟體,網路存取的改善正推動數位預訂呈指數級成長,使叫車系統實現了跨越式發展。
都市區擁擠和汽車擁有量下降
人口密集的城市往往車輛運轉率略低,這促使居民放棄私家車,轉而選擇無需支付停車費的按需出行服務。隨著都市區堵塞收費和燃油價格上漲推高了汽車擁有成本,計程車服務變得越來越有吸引力,尤其是共乘模式,每次行程的費用最多可降低 40%。 25 至 35 歲的年輕消費者最容易接受這種模式,他們更傾向於「出行即服務」的訂閱模式,這種模式將計程車、鐵路、公車和微出行服務整合到一個應用程式中。交通堵塞每年給美國造成超過 1000 億美元的損失,這給都市區帶來了政治壓力,迫使其優先發展高載客率的出行方式,間接刺激了計程車市場的需求。
不斷完善的許可證制度和日益嚴格的監管
城市監管機構正在對其計程車牌照制度進行現代化改革,並收緊背景調查規定,這增加了叫車平台和傳統計程車業者的合規成本。西雅圖計劃在2026年3月前逐步取消計程車牌照制度,紐約市則要求2025年3月前,一半的計程車必須配備無障礙設施。新加坡監管機構以反壟斷為由,阻止了Grab對Trans-Cab的收購計劃,並暗示將加強對平台整合的審查。不同的區域標準增加了法律的複雜性,並可能延遲市場准入,從而限制了短期內的成長勢頭。
細分市場分析
到2025年,線上通路將佔據計程車市場佔有率的63.78%,這標誌著市場結構正向基於應用程式的需求聚合模式轉變。數位化預訂的普及加強了商業智慧的流通,提高了需求預測的準確性,從而提高了資產利用率並縮短了乘客的等待時間。雖然線下通路在老年人和允許路邊叫車的計程車牌照發放地區仍然很重要,但其成長速度落後於整體計程車市場。因此,營運商正在將語音互動語音應答系統(IVR)和自助服務終端與應用程式整合,以留住傳統用戶並引導他們使用線上服務。
展望未來,線上預訂預計將以7.92%的複合年成長率成長。整合出行、支付和電子商務的超級應用將推動乘客數量的成長,尤其是在智慧型手機普及率超過80%的亞太地區特大城市。線上通路還能提供詳細的乘車數據,進而達到精準的會員忠誠度計畫和動態定價,進而推動市場佔有率的成長。基於合約的企業帳戶、機場特許經營和強制性無障礙服務將繼續保持其相對於線下管道的複合年成長率。然而,預計到2031年,它們的收入構成比將下降至計程車市場規模的三分之一以下。
到2025年,叫車將佔計程車市場規模的74.85%,這主要得益於網路效應,確保了快速匹配和透明定價。市場領先的平台大力投資於安全檢驗、即時監控和司機培訓,從而提供比非正規競爭對手更可靠的服務。由於共乘服務能夠減少擁塞並降低乘客分攤成本,預計其年複合成長率將達到7.78%,超過計程車市場的整體成長速度。此外,為因應環境法規,各公司紛紛設定車隊範圍內的碳減排目標,也進一步推動了共乘的需求。
企業出行合約曾經由豪華車隊主導,如今正日益轉向提供電子收據和按座位計費的基於應用程式的供應商。嵌入式數據支持了注重環境、社會和治理 (ESG) 的董事會所要求的碳排放報告儀錶板。雖然叫車在總預訂量方面仍然佔據主導地位,但共乘可以帶來更高的車輛利用率和更好的資產利用率,尤其是在高峰時段(此時單人乘客需支付突波定價)。
區域分析
到2025年,亞太地區將佔據全球計程車市場佔有率的37.42%,這主要得益於快速的都市化、超過五分之四的智慧型手機普及率以及在人口密集區域蓬勃發展的摩托車計程車。在印度、越南和泰國,政府的電動車補貼和牌照豁免政策正在加速車隊更新換代。在日本,現有計程車業者已與優步合作,將2萬輛計程車整合到該平台上,加強了跨境數位化標準化。
預計到2031年,中東和非洲地區的複合年成長率將達到7.88%,這主要得益於各國數位經濟計畫和特大城市基礎建設的推動。為響應阿拉伯聯合大公國「2050年淨零排放」藍圖,杜拜計程車公司計劃在2029年將約80%的叫車服務轉移到電子預訂系統,同時將其車隊的25%實現電氣化。在埃及、沙烏地阿拉伯和奈及利亞,隨著年輕且精通科技的人跳過傳統的叫車模式,共享出行應用程式正在迅速普及。像Careem這樣的區域性超級應用程式整合了支付、配送和交通運輸功能,從而提高了用戶留存率。各國政府正在收緊對網路可及性和資料隱私的監管,這需要大量的遵循成本,而大型業者往往從中受益。 Lyft於2025年4月收購了FREENOW,將其企業發展拓展至歐洲11個國家,使其每年能夠覆蓋約3000億次個人車輛出行。同時,德國各地市政當局正在試行零排放區,這可能會比企業原計劃更早提高電動車的普及閾值。因此,儘管增速放緩,但成長仍保持正值,因為平台正在向配送服務和訂閱式出行通行證等領域多元化發展。
其他福利:
- Excel格式的市場預測(ME)表
- 3個月的分析師支持
目錄
第1章 引言
- 研究假設和市場定義
- 調查範圍
第2章調查方法
第3章執行摘要
第4章 市場情勢
- 市場概覽
- 市場促進因素
- 智慧型手機和網路的快速普及
- 都市區擁擠和汽車擁有量下降
- 新興經濟體中共享出行平台的擴張
- 人工智慧驅動的動態路徑規劃和價格最佳化
- 無障礙法規推動車輛更新換代
- 超級應用 API 整合驅動嵌入式需求
- 市場限制
- 不斷完善的許可證制度和日益嚴格的監管
- 由於價格競爭加劇,司機收入下降
- 公共電動車充電基礎設施的缺乏減緩了電動計程車的普及。
- 資料隱私訴訟:超越追蹤
- 價值/供應鏈分析
- 監管環境
- 技術展望
- 波特五力分析
- 新進入者的威脅
- 買方的議價能力
- 供應商的議價能力
- 替代品的威脅
- 競爭對手之間的競爭
第5章 市場規模及成長預測(價值(美元))
- 按預訂類型
- 線上預訂
- 線下預訂
- 按服務類型
- 叫車
- 共乘
- 公司和機構合約
- 按車輛類型
- 搭乘用車
- 摩托車和Scooter
- 廂型車和多用途汽車
- 自動人力車和嘟嘟車
- 依推進類型
- 內燃機(ICE)
- 電動車
- 混合
- 按地區
- 北美洲
- 美國
- 加拿大
- 北美其他地區
- 南美洲
- 巴西
- 阿根廷
- 其他南美洲
- 歐洲
- 德國
- 英國
- 法國
- 西班牙
- 俄羅斯
- 其他歐洲地區
- 亞太地區
- 中國
- 印度
- 日本
- 韓國
- 澳洲
- 越南
- 亞太其他地區
- 中東和非洲
- GCC
- 土耳其
- 南非
- 其他中東和非洲地區
- 北美洲
第6章 競爭情勢
- 市場集中度
- 策略趨勢
- 市佔率分析
- 公司簡介
- Uber Technologies Inc.
- Beijing Xiaoju Technology Co. Ltd(DiDi)
- Lyft Inc.
- Grab Holdings Inc.
- Bolt Technology OU
- ANI Technologies Pvt Ltd(Ola)
- Gojek Tech
- FREE NOW(Intelligent Apps GmbH)
- BlaBlaCar
- Curb Mobility LLC
- Flywheel Software Inc.
- Kabbee Exchange Ltd
- Addison Lee Group
- Gett Inc.
- Yandex Go(Yandex NV)
- Careem Networks FZ-LLC
- Via Transportation Inc.
- Beat Mobility Services Ltd
- Easy Taxi(Tappsi SAS)
- Cabify Espana SL
第7章 市場機會與未來展望
The Taxi Market was valued at USD 236.36 billion in 2025 and estimated to grow from USD 254.36 billion in 2026 to reach USD 366.91 billion by 2031, at a CAGR of 7.62% during the forecast period (2026-2031).
Underscoring a sizeable taxi market size that continues to expand on the back of digital integration, AI-driven dispatch systems, and growing urban populations. Demand accelerates as super-apps embed on-demand mobility alongside food, payments, and finance, enabling single-tap bookings that raise platform stickiness and average revenue per user. Operators are widening service portfolios with electric, autonomous, and accessibility-focused fleets that lower lifetime operating costs and open new revenue layers such as in-vehicle advertising. Governments increasingly view app-based taxis as complements to public transit and are issuing incentives for EV adoption, improved accessibility, and data sharing that favor agile players with strong regulatory teams. Taken together, these forces are reshaping driver economics, pushing industry participants to invest in algorithmic pricing, dynamic routing, and vertical integration that compress time-to-pickup and improve fleet utilization.
Global Taxi Market Trends and Insights
Rapid Smartphone & Internet Penetration
Smartphone penetration above four-fifths in leading urban centers lets platforms algorithmically match riders and drivers faster, shrinking average wait times from 15-20 minutes to under 5 minutes in top-tier cities. Ubiquitous 5G coverage allows richer location data, which boosts fleet utilisation and lowers deadhead mileage. Higher data speeds also mean in-app video ads and real-time driver coaching, unlocking diversified revenue streams. Mobile wallets embedded in ride-hailing apps now account for more than four-fifths of transactions in developed markets, lowering cash-handling risk and reducing airport queue times. In emerging economies, internet upgrades bypass legacy dispatch systems, enabling leap-frog adoption of digital bookings.
Urban Congestion & Declining Private-Car Ownership
Vehicle utilisation in dense cities often falls slightly, motivating residents to replace private cars with on-demand rides that eliminate parking fees. Municipal congestion charges plus rising fuel prices raise the total cost of car ownership, reinforcing the appeal of taxi services, especially pooled formats that can cut per-trip fares by up to 40%. Younger consumers aged 25-35 are most receptive, preferring bundled mobility-as-a-service subscriptions integrating taxis with rail, bus, and micro-mobility in one app. Congestion costs topping USD 100 billion annually in the U.S. place political pressure on cities to privilege high-occupancy modes, indirectly boosting taxi market demand.
Evolving Licensing & Regulatory Crack-Downs
City regulators are modernising medallion structures and tightening background-check rules, raising compliance costs for app-based and traditional operators. Seattle plans to phase out its medallion regime by March 2026, while New York City requires half of all cabs to be wheelchair-ready by March 2025. The Singaporean watchdog blocked Grab's planned acquisition of Trans-Cab over antitrust concerns, signalling closer scrutiny of platform consolidation. Divergent regional standards increase legal complexity and can delay market entries, suppressing near-term growth momentum.
Other drivers and restraints analyzed in the detailed report include:
- Ride-Hailing Platform Expansion In Emerging Economies
- AI-Based Dynamic Routing & Pricing Optimisation
- Intensifying Price Wars Eroding Driver Earnings
For complete list of drivers and restraints, kindly check the Table Of Contents.
Segment Analysis
Online channels delivered 63.78% of the taxi market share in 2025, illustrating the structural pivot toward app-based demand aggregation. The dominance of digital bookings strengthened business intelligence loops that sharpen demand prediction, resulting in higher asset utilisation and lower passenger wait times. The offline segment remains relevant among older demographics and jurisdictions where medallion systems still confer street-hail privilege, yet its growth trajectory lags the broader taxi market. Operators are therefore integrating voice-based IVR and kiosk interfaces alongside apps to preserve legacy users while nudging them toward digital interactions.
Looking forward, online bookings are forecast to grow at an 7.92% CAGR. Super-apps bundling mobility with payments and e-commerce will underpin incremental trip volumes, especially in APAC megacities where smartphone penetration exceeds four-fifths. Online channels also furnish granular trip-level data that powers targeted loyalty and dynamic pricing, reinforcing share gains. Contractual corporate accounts, airport concessions, and mandated accessibility services sustain the offline channel's CAGR. Yet, its revenue mix is expected to shrink below one-third of the taxi market size by 2031.
Ride-hailing controlled 74.85% of taxi market size in 2025, owing to network effects that ensure quicker matches and transparent pricing. Market-leading platforms invest heavily in safety verification, real-time monitoring, and driver training that elevate service reliability above informal rivals. Pooled rides are projected to outpace overall taxi market expansion with an 7.78% CAGR because they ease congestion and lower per-seat fares by sharing costs among passengers. Environmental compliance agendas further catalyse pooled demand as corporates set fleet-wide carbon reduction targets.
Corporate mobility contracts, once dominated by black-car fleets, are increasingly awarded to app-based providers offering digital receipts and per-seat expense allocation. The embedded data facilitates carbon-reporting dashboards now demanded by ESG-focused boards. Although ride-hailing maintains gross-booking supremacy, pooled formats generate higher occupancy and superior asset productivity, especially during peak hours when single-occupancy trips face surge pricing.
The Taxi Market Report is Segmented by Booking Type (Online Booking and Offline Booking), Service Type (Ride-Hailing, Ride-Sharing, and Corporate & Institutional Contracts), Vehicle Type (Passenger Cars, Motorcycles & Scooters, Vans & MPVs, and Auto-Rickshaws & Tuk-Tuks), Propulsion Type (ICE, Electric, and Hybrid), and Geography. The Market Forecasts are Provided in Terms of Value (USD).
Geography Analysis
Asia-Pacific contributed 37.42% taxi market share in 2025, sustained by rapid urbanisation, smartphone usage above four-fifth, and widespread two-wheeler taxis that thrive in dense corridors. Government policies offering EV subsidies and medallion exemptions accelerate fleet turnover throughout India, Vietnam, and Thailand. Japan's taxi incumbents partner with Uber to integrate 20,000 vehicles on the platform, reinforcing cross-border digital standardisation.
The Middle East and Africa is projected to register an 7.88% CAGR through 2031, due to national digital-economy programmes and mega-city infrastructure. Dubai Taxi Company aims to migrate around four-fifth of rides to e-booking by 2029 while electrifying one-quarter of its fleet, aligning with the UAE Net-Zero 2050 roadmap. Ride-hailing apps proliferate in Egypt, Saudi Arabia, and Nigeria where youthful, tech-savvy populations leapfrog legacy dispatch models. Pan-regional super-apps such as Careem integrate payments, delivery, and transport under one umbrella, enhancing user retention. Authorities impose stricter accessibility and data-privacy mandates, requiring material compliance outlays that favor scaled operators. Lyft's acquisition of FREENOW in April 2025 doubled its European reach to 11 countries and opened access to nearly 300 billion annual personal vehicle trips. Meanwhile, city councils across Germany are testing zero-emission zones that could bump EV adoption thresholds earlier than corporate plans anticipate. Net effect: growth slows but remains positive as platforms diversify into deliveries and subscription mobility passes.
- Uber Technologies Inc.
- Beijing Xiaoju Technology Co. Ltd (DiDi)
- Lyft Inc.
- Grab Holdings Inc.
- Bolt Technology OU
- ANI Technologies Pvt Ltd (Ola)
- Gojek Tech
- FREE NOW (Intelligent Apps GmbH)
- BlaBlaCar
- Curb Mobility LLC
- Flywheel Software Inc.
- Kabbee Exchange Ltd
- Addison Lee Group
- Gett Inc.
- Yandex Go (Yandex NV)
- Careem Networks FZ-LLC
- Via Transportation Inc.
- Beat Mobility Services Ltd
- Easy Taxi (Tappsi SAS)
- Cabify Espana SL
Additional Benefits:
- The market estimate (ME) sheet in Excel format
- 3 months of analyst support
TABLE OF CONTENTS
1 Introduction
- 1.1 Study Assumptions & Market Definition
- 1.2 Scope of the Study
2 Research Methodology
3 Executive Summary
4 Market Landscape
- 4.1 Market Overview
- 4.2 Market Drivers
- 4.2.1 Rapid Smartphone & Internet Penetration
- 4.2.2 Urban Congestion & Declining Private-Car Ownership
- 4.2.3 Ride-Hailing Platform Expansion In Emerging Economies
- 4.2.4 AI-Based Dynamic Routing & Pricing Optimisation
- 4.2.5 Accessibility Mandates Driving Fleet Renewal
- 4.2.6 Super-App Api Integrations Boosting Embedded Demand
- 4.3 Market Restraints
- 4.3.1 Evolving Licensing & Regulatory Crack-Downs
- 4.3.2 Intensifying Price Wars Eroding Driver Earnings
- 4.3.3 Limited Public Ev-Charging Slowing E-Taxi Uptake
- 4.3.4 Data-Privacy Litigation Around Trip-Tracking
- 4.4 Value / Supply-Chain Analysis
- 4.5 Regulatory Landscape
- 4.6 Technological Outlook
- 4.7 Porter's Five Forces Analysis
- 4.7.1 Threat of New Entrants
- 4.7.2 Bargaining Power of Buyers
- 4.7.3 Bargaining Power of Suppliers
- 4.7.4 Threat of Substitutes
- 4.7.5 Competitive Rivalry
5 Market Size & Growth Forecasts (Value (USD))
- 5.1 By Booking Type
- 5.1.1 Online Booking
- 5.1.2 Offline Booking
- 5.2 By Service Type
- 5.2.1 Ride-hailing
- 5.2.2 Ride-sharing (pooled)
- 5.2.3 Corporate & Institutional Contracts
- 5.3 By Vehicle Type
- 5.3.1 Passenger Cars
- 5.3.2 Motorcycles & Scooters
- 5.3.3 Vans & MPVs
- 5.3.4 Auto-Rickshaws & Tuk-tuks
- 5.4 By Propulsion Type
- 5.4.1 Internal Combustion Engine (ICE)
- 5.4.2 Electric
- 5.4.3 Hybrid
- 5.5 By Geography
- 5.5.1 North America
- 5.5.1.1 United States
- 5.5.1.2 Canada
- 5.5.1.3 Rest of North America
- 5.5.2 South America
- 5.5.2.1 Brazil
- 5.5.2.2 Argentina
- 5.5.2.3 Rest of South America
- 5.5.3 Europe
- 5.5.3.1 Germany
- 5.5.3.2 United Kingdom
- 5.5.3.3 France
- 5.5.3.4 Spain
- 5.5.3.5 Russia
- 5.5.3.6 Rest of Europe
- 5.5.4 Asia-Pacific
- 5.5.4.1 China
- 5.5.4.2 India
- 5.5.4.3 Japan
- 5.5.4.4 South Korea
- 5.5.4.5 Australia
- 5.5.4.6 Vietnam
- 5.5.4.7 Rest of Asia-Pacific
- 5.5.5 Middle East and Africa
- 5.5.5.1 GCC
- 5.5.5.2 Turkey
- 5.5.5.3 South Africa
- 5.5.5.4 Rest of Middle East and Africa
- 5.5.1 North America
6 Competitive Landscape
- 6.1 Market Concentration
- 6.2 Strategic Moves
- 6.3 Market Share Analysis
- 6.4 Company Profiles (Includes Global Level Overview, Market Level Overview, Core Segments, Financials as Available, Strategic Information, Market Rank/Share for Key Companies, Products and Services, SWOT Analysis, and Recent Developments)
- 6.4.1 Uber Technologies Inc.
- 6.4.2 Beijing Xiaoju Technology Co. Ltd (DiDi)
- 6.4.3 Lyft Inc.
- 6.4.4 Grab Holdings Inc.
- 6.4.5 Bolt Technology OU
- 6.4.6 ANI Technologies Pvt Ltd (Ola)
- 6.4.7 Gojek Tech
- 6.4.8 FREE NOW (Intelligent Apps GmbH)
- 6.4.9 BlaBlaCar
- 6.4.10 Curb Mobility LLC
- 6.4.11 Flywheel Software Inc.
- 6.4.12 Kabbee Exchange Ltd
- 6.4.13 Addison Lee Group
- 6.4.14 Gett Inc.
- 6.4.15 Yandex Go (Yandex NV)
- 6.4.16 Careem Networks FZ-LLC
- 6.4.17 Via Transportation Inc.
- 6.4.18 Beat Mobility Services Ltd
- 6.4.19 Easy Taxi (Tappsi SAS)
- 6.4.20 Cabify Espana SL
7 Market Opportunities & Future Outlook
- 7.1 White-space & Unmet-need Assessment
 2026年全球線上計程車服務市場報告2026年全球計程車和豪華轎車服務市場報告2026年全球計程車服務市場報告
 豪華轎車服務市場:2026-2032年全球市場預測(依服務類型、時間長度、車輛燃料類型、車輛類型、最終用戶和預訂方式分類)計程車和豪華轎車服務市場:按類型、服務時間、服務模式、距離和車輛類型分類-2026-2032年全球市場預測
 2026-2030年全球豪華轎車服務市場
 計程車市場規模、佔有率、趨勢和預測:按預訂類型、服務類型、車輛類型和地區分類,2026-2034 年
 2026-2034年全球新能源計程車市場規模、佔有率、趨勢和成長分析報告
 新能源汽車計程車市場-全球產業規模、佔有率、趨勢、機會與預測:按動力傳動系統、車輛類型、地區和競爭格局分類,2021-2031年
 全球摩托車計程車服務市場 2026-2030