


 |
市場調查報告書
商品編碼
1939668
雲端人工智慧:市場佔有率分析、產業趨勢與統計、成長預測(2026-2031)Cloud AI - Market Share Analysis, Industry Trends & Statistics, Growth Forecasts (2026 - 2031) |
||||||
※ 本網頁內容可能與最新版本有所差異。詳細情況請與我們聯繫。
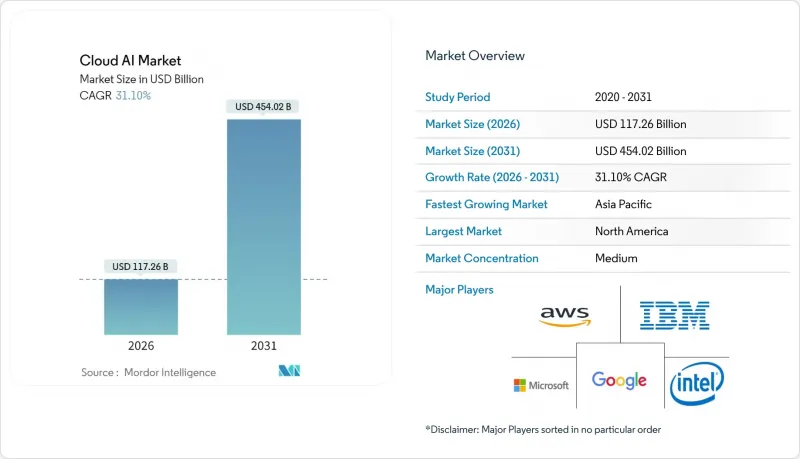
預計到 2025 年,雲端運算人工智慧市場規模將達到 894.3 億美元,到 2031 年將達到 4,540.2 億美元,高於 2026 年的 1,172.6 億美元。
預計在預測期(2026-2031 年)內,複合年成長率將達到 31.10%。
在生成式人工智慧領域,微軟向OpenAI投資130億美元,亞馬遜向Anthropic投資80億美元等合作項目,正幫助企業擴展處理能力、降低進入門檻並加速實現價值。 GPU分區技術透過降低基礎設施成本,推動了中型企業對此技術的採用。同時,醫療保健和金融服務業的特定產業法規也更有利於那些能夠展現強大管治的供應商。在超大規模資料中心業者領域,供應鏈趨勢,尤其是高頻寬記憶體領域的趨勢,正在推動晶片多元化策略的實施,而注重碳排放的工作負載編配也開始影響資料中心的位置決策。
全球雲端人工智慧市場趨勢與洞察
人工智慧即服務 (AIaaS) 的採用率不斷提高
企業正從資本密集的本地部署轉向計量收費的人工智慧服務。微軟的人工智慧業務預計將在2025會計年度第二季實現130億美元的年化收入,為Azure的成長貢獻16個百分點。諸如AWS Trainium2之類的客製化晶片可帶來30-40%的性價比提升,從而擴大了必須滿足區域資料主權法規的中型企業獲取人工智慧服務的管道。歐洲和亞洲的採用率最高,這兩個地區有60%的中型企業預計到2025年將使用特定區域的語言模型。
巨量資料量不斷成長
非結構化資料佔企業資料資產的 80% 以上,推動了對即時人工智慧分析的需求。在醫療保健領域,梅奧診所處理 10 萬名患者的基因組記錄,以提高疾病的早期檢測率。金融服務業應用雲端人工智慧技術,將反洗錢篩檢的誤報率降低了 95%。邊緣運算和雲端融合使製造商能夠利用物聯網資料流,以毫秒級的響應速度執行預測性維護。
GPU/HBM供應鏈短缺持續存在
SK海力士控制著70%的HBM市場,並表示到2025年供應仍然緊張,這給雲端服務供應商帶來了成本壓力。 AWS已推出客製化的Trainium晶片以應對這一局面,而Oracle採購了數千塊NVIDIA Blackwell GPU以維持訓練能力。記憶體供應緊張導致DDR5和VRAM價格飆升,促使三星與AMD簽署了一項價值30億美元的HBM3E供應協議。
細分市場分析
到 2025 年,解決方案將佔雲端 AI 市場的 62.40%。企業正專注於可與現有 DevOps 管線整合的打包平台,以確保快速部署和穩定的效能。隨著採用率的提高,遷移藍圖和管治的專家指導變得至關重要,這將推動服務細分市場以預期 33.42% 的複合年成長率成長。
服務成長反映了涵蓋策略制定、模式調整和營運管理的多年轉型計劃。例如,Accenture等公司正在為 Anthropic on AWS 部署專案對 1400 名工程師進行再培訓,直接解決企業技能缺口問題。解決方案和服務交付模式正變得越來越普遍,使企業能夠在建立內部能力的同時快速採用人工智慧。
預計到2025年,銀行、金融和保險(BFSI)產業將佔雲端人工智慧市場佔有率的28.55%,主要驅動力來自詐欺分析和智慧投顧等應用情境。然而,醫療保健產業預計將以34.98%的複合年成長率成長,主要得益於人工智慧輔助診斷和環境臨床文件記錄等應用情境。
醫院正在部署大規模語言模型,用於放射科分診和個人化治療建議。美國食品藥物管理局 (FDA) 於 2025 年 1 月發布的指南提供了清晰的監管路徑,刺激了資本投資。製造業和零售業也紛紛效仿,分別利用人工智慧進行缺陷檢測和庫存最佳化。
雲端人工智慧市場報告按類型(解決方案和服務)、最終用戶產業(銀行、金融服務和保險、醫療保健、汽車和旅遊等)、部署模式(公共雲端、私有雲端等)、應用(詐欺和風險分析、行銷和個人化等)、技術(機器學習、生成式人工智慧等)和地區進行細分。
區域分析
北美將在2025年維持40.60%的雲端運算AI市場佔有率,這主要得益於其超大規模資料中心業者資料中心和創業投資資金。監管政策的明朗化,例如FDA發布的AI設備指南,正在推動生命科學和金融領域的AI應用。包括亞馬遜對Anthropic的80億美元投資以及微軟持續推動的OpenAI整合在內的資本支出,進一步鞏固了該地區的領先地位。
亞太地區是成長最快的地區,複合年成長率高達31.88%。預計到2025年,中國雲端運算支出將達到460億美元,阿里巴巴的多年資本支出承諾也推動了基礎設施的擴張。隨著Oracle宣布投資80億美元以及OpenAI在東京開設其首個印太地區辦事處,日本的發展速度正在加速。印度和東南亞則受益於數位公共基礎設施計畫和不斷成長的開發團體。
儘管法規環境複雜,歐洲仍呈現穩定成長態勢。歐盟人工智慧法律提供了一個統一的框架,使擁有認證管治的供應商更具優勢。主權雲端計畫和碳減排指令正在推動混合架構的發展。中東和非洲等新興市場正率先採用混合架構,這得益於主權財富基金對資料中心的投資。
其他福利:
- Excel格式的市場預測(ME)表
- 3個月的分析師支持
目錄
第1章 引言
- 研究假設和市場定義
- 調查範圍
第2章調查方法
第3章執行摘要
第4章 市場情勢
- 市場概覽
- 市場促進因素
- 巨量資料量不斷成長
- 人工智慧即服務 (AIaaS) 的採用率不斷提高
- 對虛擬助理和生成式人工智慧聊天機器人的需求不斷成長
- 生成式人工智慧正在顛覆GPU,並為中小企業帶來更大的應用前景。
- 邊緣雲端人工智慧互通性標準(例如 ONNX、MEDAL)
- 加速碳感知型工作負載編配
- 市場限制
- 技術工人短缺和資料安全問題
- GPU/HBM供應鏈短缺持續存在
- 人工智慧資料中心的能源限制和碳排放法規
- 地緣政治GPU出口管制框架
- 價值鏈分析
- 監管環境
- 技術展望
- 波特五力分析
- 新進入者的威脅
- 供應商的議價能力
- 買方的議價能力
- 替代品的威脅
- 競爭對手之間的競爭
第5章 市場規模與成長預測
- 按類型
- 解決方案
- 服務
- 終端用戶產業
- BFSI
- 衛生保健
- 汽車與出行
- 零售與電子商務
- 政府和公共部門
- 教育
- 製造業
- 按部署模式
- 公共雲端
- 私有雲端
- 混合/多重雲端
- 透過使用
- 人工智慧在客戶服務和客服中心的應用
- 預測性維護和資產管理
- 詐欺和風險分析
- 行銷與個人化
- 電腦視覺服務
- 透過技術
- 機器學習
- 自然語言處理
- 電腦視覺
- 人工智慧世代
- 增強人工智慧和邊緣人工智慧
- 按地區
- 北美洲
- 美國
- 加拿大
- 墨西哥
- 南美洲
- 巴西
- 阿根廷
- 智利
- 其他南美洲
- 歐洲
- 德國
- 英國
- 法國
- 義大利
- 西班牙
- 荷蘭
- 俄羅斯
- 其他歐洲地區
- 亞太地區
- 中國
- 印度
- 日本
- 韓國
- ASEAN
- 亞太其他地區
- 中東和非洲
- 中東
- 海灣合作理事會(沙烏地阿拉伯、阿拉伯聯合大公國、卡達等)
- 土耳其
- 其他中東地區
- 非洲
- 南非
- 奈及利亞
- 肯亞
- 其他非洲地區
- 中東
- 北美洲
第6章 競爭情勢
- 市場集中度
- 策略趨勢
- 市佔率分析
- 公司簡介
- Amazon Web Services
- Microsoft Corp.
- Google LLC
- IBM Corp.
- Salesforce Inc.
- NVIDIA Corp.
- Oracle Corp.
- Alibaba Cloud
- SAP SE
- ServiceNow
- Databricks
- Snowflake Inc.
- Hugging Face
- OpenAI LP
- Anthropic PBC
- CoreWeave
- AMD Inc.
- Intel Corp.
- Wipro Ltd.
- Infosys Ltd.
- SoundHound AI Inc.
- Twilio Inc.
第7章 市場機會與未來展望
The Cloud AI market was valued at USD 89.43 billion in 2025 and estimated to grow from USD 117.26 billion in 2026 to reach USD 454.02 billion by 2031, at a CAGR of 31.10% during the forecast period (2026-2031).
Generative AI partnerships, such as Microsoft's USD 13 billion commitment to OpenAI and Amazon's USD 8 billion investment in Anthropic, are expanding capacity, lowering entry barriers, and accelerating time-to-value for enterprises. Mid-market adoption is rising as GPU-fractionalization technologies reduce infrastructure costs, while sector-specific regulations in healthcare and financial services favor providers that can demonstrate robust governance. Supply-chain dynamics, notably in high-bandwidth memory, spur chip diversification strategies among hyperscalers, and carbon-aware workload orchestration begins to influence data-center siting decisions.
Global Cloud AI Market Trends and Insights
Growing Adoption of AI-as-a-Service (AIaaS)
Enterprises are shifting from capital-heavy on-premises deployments to pay-as-you-go AI services. Microsoft's AI business reached a USD 13 billion annual run rate in Q2 FY 2025, contributing 16 percentage points to Azure growth. Custom silicon such as AWS Trainium2 delivers 30-40% price-performance gains, broadening AI accessibility for mid-market firms that must meet regional data-sovereignty rules. Uptake is evident across Europe and Asia, where 60% of mid-size enterprises expect regionally trained language models by 2025.
Rising Big-Data Volume
Unstructured data exceeds 80% of enterprise information assets, driving demand for real-time AI analytics. Healthcare use cases include Mayo Clinic processing genomic records from 100,000 patients to improve early disease detection. Financial services apply cloud AI to reduce false positives in anti-money-laundering screening by 95%. Edge-cloud convergence allows manufacturers to perform predictive maintenance on IoT data streams with millisecond response times.
Persistent GPU/HBM Supply-Chain Shortages
SK Hynix controls 70% of the HBM market and reports full allocation through 2025, creating cost pressures for cloud providers. AWS counters with Trainium custom chips, while Oracle procures thousands of NVIDIA Blackwell GPUs to sustain training capacity. Tight memory supply has triggered price spikes in DDR5 and VRAM, with Samsung inking a USD 3 billion HBM3E supply deal with AMD.
Other drivers and restraints analyzed in the detailed report include:
- Increasing Demand for Virtual Assistants and GenAI Chatbots
- GenAI GPU-Fractionalization Expanding SME Access
- Lack of Skilled Workforce and Data-Security Concerns
For complete list of drivers and restraints, kindly check the Table Of Contents.
Segment Analysis
Solutions represented 62.40% of the Cloud AI market in 2025. Enterprises gravitated to packaged platforms that integrate with existing DevOps pipelines, ensuring quick deployment and consistent performance. As adoption deepens, professional guidance becomes essential for migration roadmaps and governance, pushing the Services segment to a forecast 33.42% CAGR.
Services growth reflects multi-year transformation programs that include strategy, model tuning, and managed operations. Firms such as Accenture have retrained 1,400 engineers for Anthropic-on-AWS implementations, directly addressing enterprise skills gaps. Combined solution-service offerings are growing in popularity, enabling organizations to onboard AI quickly while building internal competencies.
BFSI held 28.55% Cloud AI market share in 2025 due to fraud analytics and robo-advisory use cases. However, Healthcare is set to grow at 34.98% CAGR, buoyed by AI-enabled diagnostics and ambient clinical documentation.
Hospitals deploy large language models for radiology triage and personalized treatment recommendations. The FDA's January 2025 guidance provides a clear regulatory path, encouraging capital investment. Manufacturing and retail follow, leveraging AI for defect detection and inventory optimization, respectively.
The Cloud AI Market Report is Segmented by Type (Solution and Service), End-User Vertical (BFSI, Healthcare, Automotive and Mobility, and More), Deployment Model (Public Cloud, Private Cloud, and More), Application (Fraud and Risk Analytics, Marketing and Personalisation, and More), Technology (Machine Learning, Generative AI, and More), and Geography.
Geography Analysis
North America retained 40.60% Cloud AI market share in 2025, anchored by hyperscaler footprints and venture funding. Regulatory clarity, exemplified by the FDA's AI device guidelines, encourages adoption across life-sciences and finance. Capital outlays include Amazon's USD 8 billion Anthropic investment and Microsoft's continued OpenAI integration, reinforcing regional dominance.
Asia Pacific is the fastest-growing territory with 31.88% CAGR. China's projected USD 46 billion cloud spend for 2025, along with Alibaba's multi-year capex commitment, fuels infrastructure expansion. Japan accelerates with Oracle's USD 8 billion pledge and Tokyo's selection for OpenAI's first Indo-Pacific branch. India and Southeast Asia benefit from digital public-infrastructure programs and rising developer communities.
Europe shows steady growth amid complex regulation. The EU AI Act provides a harmonized framework that advantages providers with certified governance. Sovereign cloud initiatives and carbon-reduction mandates encourage hybrid architectures. Emerging markets in the Middle East and Africa witness early uptake, backed by sovereign-wealth investments in data centers.
- Amazon Web Services
- Microsoft Corp.
- Google LLC
- IBM Corp.
- Salesforce Inc.
- NVIDIA Corp.
- Oracle Corp.
- Alibaba Cloud
- SAP SE
- ServiceNow
- Databricks
- Snowflake Inc.
- Hugging Face
- OpenAI LP
- Anthropic PBC
- CoreWeave
- AMD Inc.
- Intel Corp.
- Wipro Ltd.
- Infosys Ltd.
- SoundHound AI Inc.
- Twilio Inc.
Additional Benefits:
- The market estimate (ME) sheet in Excel format
- 3 months of analyst support
TABLE OF CONTENTS
1 INTRODUCTION
- 1.1 Study Assumptions and Market Definition
- 1.2 Scope of the Study
2 RESEARCH METHODOLOGY
3 EXECUTIVE SUMMARY
4 MARKET LANDSCAPE
- 4.1 Market Overview
- 4.2 Market Drivers
- 4.2.1 Rising big-data volume
- 4.2.2 Growing adoption of AI-as-a-Service (AIaaS)
- 4.2.3 Increasing demand for virtual assistants and GenAI chatbots
- 4.2.4 GenAI GPU-fractionalization expanding SME access
- 4.2.5 Edge-cloud AI interoperability standards (e.g., ONNX, MEDAL)
- 4.2.6 Carbon-aware workload orchestration incentives
- 4.3 Market Restraints
- 4.3.1 Lack of skilled workforce and data-security concerns
- 4.3.2 Persistent GPU/HBM supply-chain shortages
- 4.3.3 AI datacentre energy constraints and carbon regulations
- 4.3.4 Geopolitical GPU export-control frameworks
- 4.4 Value Chain Analysis
- 4.5 Regulatory Landscape
- 4.6 Technological Outlook
- 4.7 Porter's Five Forces Analysis
- 4.7.1 Threat of New Entrants
- 4.7.2 Bargaining Power of Suppliers
- 4.7.3 Bargaining Power of Buyers
- 4.7.4 Threat of Substitutes
- 4.7.5 Intensity of Competitive Rivalry
5 MARKET SIZE AND GROWTH FORECASTS (VALUE)
- 5.1 By Type
- 5.1.1 Solution
- 5.1.2 Service
- 5.2 By End-user Vertical
- 5.2.1 BFSI
- 5.2.2 Healthcare
- 5.2.3 Automotive and Mobility
- 5.2.4 Retail and E-commerce
- 5.2.5 Government and Public Sector
- 5.2.6 Education
- 5.2.7 Manufacturing
- 5.3 By Deployment Model
- 5.3.1 Public Cloud
- 5.3.2 Private Cloud
- 5.3.3 Hybrid / Multi-cloud
- 5.4 By Application
- 5.4.1 Customer Service and Contact-Centre AI
- 5.4.2 Predictive Maintenance and Asset Ops
- 5.4.3 Fraud and Risk Analytics
- 5.4.4 Marketing and Personalisation
- 5.4.5 Computer-Vision-as-a-Service
- 5.5 By Technology
- 5.5.1 Machine Learning
- 5.5.2 Natural Language Processing
- 5.5.3 Computer Vision
- 5.5.4 Generative AI
- 5.5.5 Reinforcement and Edge AI
- 5.6 By Geography
- 5.6.1 North America
- 5.6.1.1 United States
- 5.6.1.2 Canada
- 5.6.1.3 Mexico
- 5.6.2 South America
- 5.6.2.1 Brazil
- 5.6.2.2 Argentina
- 5.6.2.3 Chile
- 5.6.2.4 Rest of South America
- 5.6.3 Europe
- 5.6.3.1 Germany
- 5.6.3.2 United Kingdom
- 5.6.3.3 France
- 5.6.3.4 Italy
- 5.6.3.5 Spain
- 5.6.3.6 Netherlands
- 5.6.3.7 Russia
- 5.6.3.8 Rest of Europe
- 5.6.4 Asia Pacific
- 5.6.4.1 China
- 5.6.4.2 India
- 5.6.4.3 Japan
- 5.6.4.4 South Korea
- 5.6.4.5 ASEAN
- 5.6.4.6 Rest of Asia Pacific
- 5.6.5 Middle East and Africa
- 5.6.5.1 Middle East
- 5.6.5.1.1 GCC (Saudi Arabia, UAE, Qatar, etc.)
- 5.6.5.1.2 Turkey
- 5.6.5.1.3 Rest of Middle East
- 5.6.5.2 Africa
- 5.6.5.2.1 South Africa
- 5.6.5.2.2 Nigeria
- 5.6.5.2.3 Kenya
- 5.6.5.2.4 Rest of Africa
- 5.6.5.1 Middle East
- 5.6.1 North America
6 COMPETITIVE LANDSCAPE
- 6.1 Market Concentration
- 6.2 Strategic Moves
- 6.3 Market Share Analysis
- 6.4 Company Profiles (includes Global level Overview, Market level overview, Core Segments, Financials as available, Strategic Information, Market Rank/Share for key companies, Products and Services, and Recent Developments)
- 6.4.1 Amazon Web Services
- 6.4.2 Microsoft Corp.
- 6.4.3 Google LLC
- 6.4.4 IBM Corp.
- 6.4.5 Salesforce Inc.
- 6.4.6 NVIDIA Corp.
- 6.4.7 Oracle Corp.
- 6.4.8 Alibaba Cloud
- 6.4.9 SAP SE
- 6.4.10 ServiceNow
- 6.4.11 Databricks
- 6.4.12 Snowflake Inc.
- 6.4.13 Hugging Face
- 6.4.14 OpenAI LP
- 6.4.15 Anthropic PBC
- 6.4.16 CoreWeave
- 6.4.17 AMD Inc.
- 6.4.18 Intel Corp.
- 6.4.19 Wipro Ltd.
- 6.4.20 Infosys Ltd.
- 6.4.21 SoundHound AI Inc.
- 6.4.22 Twilio Inc.
7 MARKET OPPORTUNITIES AND FUTURE OUTLOOK
- 7.1 White-space and Unmet-need Assessment
 AI雲端工作負載AI雲端工作負載:市場數據概覽(2026年第二季)
 2026年全球付費語言模式市場報告2026年全球本地部署大型語言模型(LLM)交付平台市場報告
 雲端人工智慧市場:2026-2032年全球市場預測(按組件、技術、託管模式、應用、最終用戶產業、部署模式和企業規模分類)2026年全球大規模語言模型(LLM)雲端服務市場報告2026年全球雲端運算人工智慧市場報告
 雲端人工智慧市場規模、佔有率和趨勢分析報告:按技術、類型、行業、地區和細分市場預測(2026-2033 年)
 雲端人工智慧市場規模、佔有率、成長及全球產業分析:依類型、應用和地區劃分的洞察與預測(2026-2034 年)
 雲端人工智慧市場-全球產業規模、佔有率、趨勢、機會及預測(依技術、類型、垂直產業、地區及競爭格局分類,2021-2031年)