


 |
市場調查報告書
商品編碼
1939630
企業伺服器:市場佔有率分析、產業趨勢與統計、成長預測(2026-2031 年)Enterprise Server - Market Share Analysis, Industry Trends & Statistics, Growth Forecasts (2026 - 2031) |
||||||
※ 本網頁內容可能與最新版本有所差異。詳細情況請與我們聯繫。
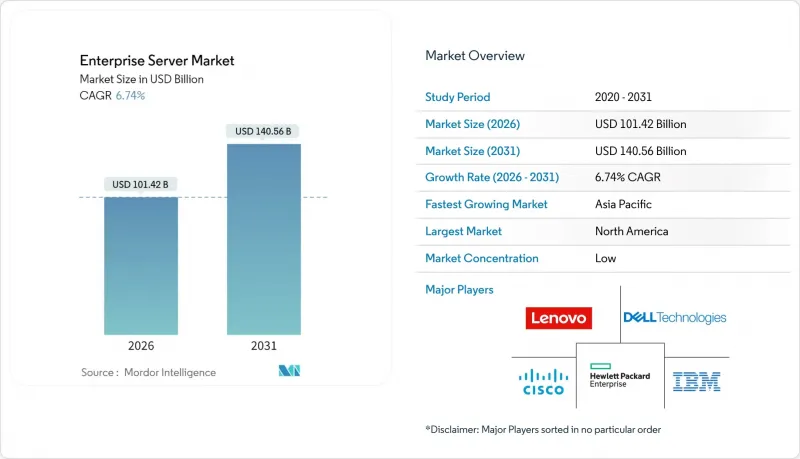
預計到 2025 年,企業伺服器市場規模將達到 950.2 億美元,到 2031 年將達到 1,405.6 億美元,高於 2026 年的 1,014.2 億美元。
預計在預測期(2026-2031 年)內,複合年成長率將達到 6.74%。
人工智慧最佳化伺服器叢集訂單創歷史新高、混合雲端採用率不斷上升以及公共部門獎勵策略支持大規模採購週期,共同推動了市場成長。超大規模超大規模資料中心業者、獨立軟體供應商和受監管企業正將資本規劃重點放在支援訓練和推理工作負載的高GPU密集型系統上,這項轉變正在重塑組件供應鏈,並加速對液冷機架的需求。同時,5G賦能的邊緣部署和微型資料中心正在擴大堅固耐用、低功耗伺服器的潛在市場。訂閱定價模式也降低了企業在不大幅增加資本支出的情況下縮短更新週期的預算門檻。那些將自主研發晶片、高速互連和端到端生命週期服務相結合的供應商,正在從尋求承包人工智慧基礎設施的買家手中搶佔市場佔有率。
全球企業伺服器市場趨勢與洞察
對人工智慧加速工作負載日益成長的需求正在重塑伺服器架構要求。
超大規模資料中心業者資料中心正在以GPU密集型系統取代傳統的通用節點,這些系統每個機架可支援40-60kW的功率,大約是傳統資料中心熱負載的五倍。即使對於並非專門用於人工智慧的部署,企業採購也正在將液冷迴路、矽光電互連和高頻寬記憶體作為標準,以增強未來人工智慧部署時間表變化的基礎。電力消耗量的快速成長促使北維吉尼亞和都柏林的公用事業公司優先考慮其資料中心區域的電網升級,這為節能伺服器設計提供了監管支援。國家人工智慧安全框架鼓勵買家建立能夠在本地執行管治模式的基礎設施,這創造了超出傳統工作負載預測的需求,並將計算加速器的更新周期縮短至不到三年。
企業雲端遷移加速混合基礎架構投資
經營團隊對應用可移植性的需求正在推動混合架構的發展,這種架構透過基礎設施即程式碼 (IaC) 管道將本地機架與多個公共雲端連接起來。例如,HashiCorp 的自動化堆疊已成為企業在自有機架和租用的超大規模容量上尋求統一配置邏輯的事實標準控制平面。交付到這些環境中的伺服器配備了擴展的 PCIe 通道、雙 100GbE 連接埠和內建身分驗證模組,在混合邊界的兩側提供統一的安全防護。 GDPR 下嚴格的資料居住規則迫使許多歐洲公司將有狀態資料庫部署在國內,而突發性分析作業則在海外可用區運行,這形成了一種混合採購模式,有利於那些提供一致的 BIOS、韌體和管理 API 的供應商。付費使用制進一步使伺服器支出與季節性計劃負載保持一致,從而減少計劃在淡季期間的損失。
伺服器虛擬化技術的成熟度限制了實體基礎架構的擴展。
執行 VMware、KVM 和容器編排管理的公司通常會遇到 80-90% 的 CPU 使用率,這大大降低了為通用工作負載添加 x86 節點所帶來的增量效益。一些金融機構已實現了舊有應用程式20:1 的整合比例,顯著減少了實體空間和能源消耗。然而,由於 GPU共用技術尚未成熟,這種整合對於 AI 訓練工作負載來說難以實現。各組織在維護隔離的加速器池的同時,盡量利用現有虛擬化資源,導致不同伺服器層級的需求不平衡。政府主導的節能政策,例如歐盟的生態設計法規,會對未充分利用的機架進行處罰,鼓勵運轉率充分利用。隨著時間的推移,傳統工作負載的這些效率提升將抵消 AI叢集帶來的部分容量成長。
細分市場分析
到2025年,Linux將維持54.32%的市場佔有率,比四年前成長8個百分點,繼續主導企業伺服器市場。開放原始碼授權、容器相容性以及人工智慧框架管理機構的一流支持,預計將推動其複合年成長率達到6.88%。因此,Linux節點的企業伺服器市場規模成長速度將超過任何其他競爭作業系統,從而鞏固其在私有雲端和公共雲端環境中的主導地位。在各個垂直產業中,Red Hat Enterprise Linux和Ubuntu LTS是推理領域部署最廣泛的發行版,而Rocky Linux等強化衍生在法規環境中也越來越受歡迎。
在關鍵資料背後,Windows Server 仍然為 .NET 應用程式和依賴 Active Directory 的工作負載提供支持,但隨著企業將單體系統重構為微服務架構,其市場佔有率正在下降。 UNIX 在高頻交易和關鍵通訊交換等領域保持強大的市場地位,在這些領域,確定性 I/O 和經過認證的穩定性比現代化壓力更為重要。展望未來,即將推出的下一代 Linux 核心中的機密運算擴展將為處理敏感 AI 模型權重的客戶帶來新的市場佔有率成長途徑。
容量型伺服器仍將佔據企業伺服器市場最大佔有率,預計到 2025 年將佔出貨量的 66.58%。然而,未來的成長預計將傾向於高階平台,複合年成長率 (CAGR) 為 7.02%。市場需求正呈現兩極化:一方面是面向容器叢集的低成本、無狀態運算,另一方面是配備八個或更多 GPU 的高階節點,用於變壓器模型訓練。曾經面向 ERP 和資料庫叢集的中階配置正逐漸失去市場,因為這些工作負載正遷移到 SaaS 環境或更經濟的橫向擴展硬體上。
因此,OEM廠商的藍圖正在分化。大批量生產的型號整合了高效核心和E1.S快閃存,以實現高密度虛擬化,而高階產品線則致力於PCIe CXL記憶體擴充和液冷快速斷開連接器。契約製造製造商在大批量生產層面保持成本優勢,而頂級廠商則透過捆綁韌體檢驗、安全認證和加速器保固服務來保障高性能層面的市場地位。資訊長們普遍預計,隨著橫向擴展和縱向擴展的採購週期差異越來越大,這種分化趨勢將會加速。
區域分析
北美地區在2025年繼續保持領先地位,成長率達37.35%,這主要得益於集中在亞利桑那州、愛荷華州和魁北克省的超大規模園區。儘管主要市場的庫存年增43%,但北維吉尼亞的空置率低於1%,迫使租戶在建設前兩年就預訂了容量。聯邦政府的各項舉措,例如5000億美元的「星門計畫」(Stargate program),正在推動與能夠根據《晶片資訊保護和資訊安全法案》(CHIPS Act)認證來源追蹤的原始設備製造商(OEM)簽訂大規模主合約。為了滿足單一站點250兆瓦的電力需求,區域性公用事業公司正在加強與營運商的合作,以重新利用未充分利用的發電容量,並將可再生能源購電協議(PPA)納入伺服器總擁有成本(TCO)模型。
亞太地區成長最快,複合年成長率達7.38%,主要得益於北京的人工智慧國家戰略以及東京、雪梨和首爾的建設熱潮。新加坡嚴格的建築法規促使建築項目轉移至柔佛和巴淡島,而孟買的土地短缺則推動了模組化資料中心異地組合式的需求。本地雲端服務供應商指定使用無氣浸沒式水箱以規避用水限制,並將支出轉向預先認證主機板介電液相容性的供應商。印度和印尼的國家資料保護法進一步推動了採購本地化,並要求原始設備製造商(OEM)建立保稅倉庫設施以進行國內組裝。儘管電力配額和碳排放稅實施了更嚴格的PUE標準,但預計歐洲的需求仍將保持穩定成長。法蘭克福都會區禁止新建設70兆瓦以上的項目,導致需求轉移到黑森的農村地區。巴黎透過其《國家雲憲章》,確保了以核能為基荷的零碳基本負載區,為歐洲買家提供了一種成本穩定的替代方案,以取代與天然氣價格掛鉤的電價。阿姆斯特丹取消了對資料中心建設的禁令,允許那些能夠展示區域供熱回收技術的計劃獲批。這項規定有利於將熱水伺服器整合到住宅大樓熱交換迴路中的供應商。在整個歐洲,節能硬體的增值稅豁免政策正在抵消部署液冷機架的部分前期成本。
其他福利:
- Excel格式的市場預測(ME)表
- 3個月的分析師支持
目錄
第1章 引言
- 研究假設和市場定義
- 調查範圍
第2章調查方法
第3章執行摘要
第4章 市場情勢
- 市場概覽
- 市場促進因素
- 對人工智慧加速工作負載的需求不斷成長
- 企業雲端遷移和混合雲端策略
- 邊緣運算與5G賦能的微型資料中心快速發展
- 基於營運成本的伺服器訂閱和計量收費模式
- 透過使用液冷技術實現高機架密度
- 政府人工智慧基礎設施獎勵策略
- 市場限制
- 伺服器虛擬化和整合減少了已安裝的實體機器數量。
- x86硬體價格下降和商品化
- GPU和矽光電組件供應鏈短缺
- 資料中心電力價格上漲和碳排放合規成本增加
- 產業生態系分析
- 宏觀經濟因素的影響
- 監管環境
- 技術展望
- 波特五力分析
- 供應商的議價能力
- 買方的議價能力
- 新進入者的威脅
- 替代品的威脅
- 競爭對手之間的競爭
第5章 市場規模與成長預測
- 按作業系統
- Linux
- Windows
- UNIX
- 其他作業系統(i5/OS、z/OS 等)
- 按伺服器類
- 高階伺服器
- 中階伺服器
- 低負載伺服器
- 按伺服器類型
- 刀刃
- 多節點
- 塔
- 機架最佳化
- 按最終用戶行業分類
- IT/通訊
- 銀行、金融服務和保險
- 製造業
- 零售
- 衛生保健
- 媒體與娛樂
- 其他終端用戶產業
- 按地區
- 北美洲
- 美國
- 加拿大
- 墨西哥
- 南美洲
- 巴西
- 阿根廷
- 其他南美洲
- 歐洲
- 德國
- 義大利
- 英國
- 法國
- 西班牙
- 其他歐洲地區
- 亞太地區
- 中國
- 日本
- 印度
- 韓國
- 亞太其他地區
- 中東
- 沙烏地阿拉伯
- 阿拉伯聯合大公國
- 土耳其
- 其他中東地區
- 非洲
- 南非
- 奈及利亞
- 其他非洲地區
- 北美洲
第6章 競爭情勢
- 市場集中度
- 策略趨勢
- 市佔率分析
- 公司簡介
- Dell Technologies Inc.
- Super Micro Computer Inc.
- Hewlett Packard Enterprise Company
- Inspur Electronic Information Industry Co. Ltd.
- Lenovo Group Limited
- International Business Machines Corporation
- Cisco Systems Inc.
- Oracle Corporation
- Fujitsu Limited
- NEC Corporation
- Hitachi Ltd.
- Toshiba Corporation
- Unisys Corporation
- Quanta Computer Inc.
- Wiwynn Corporation
- Wistron Corporation
- Atos SE
- Huawei Technologies Co. Ltd.
- ZTE Corporation
- IEIT Systems Co. Ltd.
第7章 市場機會與未來展望
The enterprise server market was valued at USD 95.02 billion in 2025 and estimated to grow from USD 101.42 billion in 2026 to reach USD 140.56 billion by 2031, at a CAGR of 6.74% during the forecast period (2026-2031).
Growth stems from record orders for AI-optimized server clusters, rising hybrid-cloud adoption, and public-sector stimulus packages that underwrite large procurement cycles. Hyperscalers, independent software vendors, and regulated enterprises are aligning capital plans around GPU-dense systems that support training and inference workloads, a shift that is reshaping component supply chains and tipping demand toward liquid-cooled racks. Simultaneously, 5G-enabled edge deployments and micro-data centers are broadening the addressable base for ruggedized, low-power servers, while subscription pricing is easing budget hurdles for firms that want short refresh cycles without CapEx spikes. Vendors that combine in-house silicon, high-speed interconnects, and end-to-end lifecycle services are capturing wallet share as buyers seek turnkey AI infrastructure.
Global Enterprise Server Market Trends and Insights
Growing AI-Accelerated Workload Demand Reshapes Server Architecture Requirements
Hyperscalers are replacing conventional general-purpose nodes with GPU-dense systems that can support 40-60 kW per rack, roughly five times the thermal load seen in legacy data centers. Enterprise procurement now specifies liquid-cooling loops, silicon-photonics interconnects, and high-bandwidth memory as standard-even for deployments not earmarked for AI-in order to future-proof footprints against shifting AI adoption schedules. Power draw is escalating so quickly that utilities in Northern Virginia and Dublin are prioritizing grid upgrades for data-center zones, lending a regulatory tailwind to energy-efficient server designs. National AI safety frameworks encourage buyers to build infrastructure that can run governance models locally, driving demand beyond traditional workload forecasts and shortening refresh cycles to under three years for compute accelerators.
Enterprise Cloud Migration Accelerates Hybrid Infrastructure Investments
C-suite mandates for application portability are fueling hybrid architectures in which on-premises racks interoperate with multiple public clouds via infrastructure-as-code pipelines. HashiCorp's automation stack, for instance, has become a de-facto control plane for enterprises that want identical provisioning logic across their own racks and rented hyperscale capacity. Servers shipped into these estates ship with expanded PCIe lanes, dual 100 GbE ports, and embedded attestation modules so that the same security envelope covers both sides of the hybrid boundary. Strict data-residency rules under GDPR compel many European firms to place stateful databases on domestic soil, while burstable analytics jobs run in foreign availability zones, creating mixed procurement patterns that favor vendors offering consistent BIOS, firmware, and management APIs. Consumption-based pricing further aligns server spend with seasonal project loads, reducing write-offs when projects stall.
Server Virtualization Maturity Limits Physical Infrastructure Expansion
Enterprises running VMware, KVM, and container orchestration routinely hit 80-90% CPU utilization, slashing the incremental benefit of adding more x86 nodes for general workloads. Some banks report consolidation ratios of 20:1 for legacy applications, a feat that materially cuts real-estate and energy consumption. Yet AI training workloads resist such aggregation because GPU sharing is still nascent; organizations therefore maintain isolated accelerator pools while sweating existing virtualized fleets, resulting in uneven demand across server tiers. Government-backed energy-efficiency directives, such as the European Union's EcoDesign rules, reinforce capacity-stretching behavior by penalizing low-utilization racks. Over time, these efficiency gains in conventional workloads will offset a portion of the volume growth generated by AI clusters.
Other drivers and restraints analyzed in the detailed report include:
- Rapid Growth of Edge Computing and 5G Networks Drives Distributed Server Architectures
- OpEx-Based Server Subscription Models Transform Procurement Strategies
- Price Erosion and Hardware Commoditization Pressure Vendor Margins
For complete list of drivers and restraints, kindly check the Table Of Contents.
Segment Analysis
Linux retained a 54.32% foothold in 2025, a position eight points stronger than four years prior and equal to more than half of total enterprise server market share. Its open-source licensing, container compatibility, and first-class support from AI framework maintainers underpin a 6.88% forecast CAGR. The enterprise server market size devoted to Linux nodes will therefore expand faster than that of any rival OS cohort, cementing the platform's dominance for both private and public cloud estates. Across sectors, Red Hat Enterprise Linux and Ubuntu LTS remain the most-deployed variants for inference, while hardened derivatives such as Rocky Linux are gaining favor in regulated environments.
Behind the headline numbers, Windows Server still anchors workloads tethered to .NET applications and Active Directory but is losing share where firms are rewriting monoliths into microservices. UNIX retains durable niches in high-frequency trading and critical telecom exchanges where deterministic I/O and certified stability outweigh modernization pressures. Looking ahead, confidential computing extensions arriving in the next Linux kernel will give the platform another lever for share capture among customers handling sensitive AI model weights.
Volume class machines accounted for 66.58% of shipments in 2025, the single largest slice of enterprise server market size, yet forward growth tilts toward high-end platforms at 7.02% CAGR. Demand is coalescing around two extremes: low-cost, stateless compute for container farms and premium nodes equipped with eight or more GPUs for transformer model training. Mid-range configurations that once served ERP and database clusters are becoming less relevant as those workloads either move to SaaS environments or migrate onto cheaper scale-out hardware.
Consequently, OEM roadmaps now bifurcate: volume units integrate efficiency cores and E1.S flash for dense virtualization, whereas high-end lines target PCIe CXL memory expansion and liquid-coolant quick-disconnects. Contract manufacturers hold a cost advantage in the volume tier, but tier-one vendors defend the performance layer by bundling firmware validation, security attestation, and guaranteed accelerator allocations. The prevailing view among CIOs is that scale-out and scale-up purchase cycles will diverge further, reinforcing the two-track dynamic.
The Enterprise Server Market Report is Segmented by Operating System (Linux, Windows, UNIX, and More), Server Class (High-End Server, Mid-Range Server, and Volume Server), Server Type (Blade, Multi-Node, Tower, and Rack Optimized), End-User Vertical (IT and Telecommunication, BFSI, Manufacturing, Retail, Healthcare, Media and Entertainment, and More), and Geography. The Market Forecasts are Provided in Terms of Value (USD).
Geography Analysis
North America kept its 37.35% lead in 2025, propelled by hyperscale campuses clustering in Arizona, Iowa, and Quebec. Inventory across the region's primary markets expanded 43% year over year, yet vacancy slid below 1% in Northern Virginia, forcing tenants to pre-lease capacity two years ahead of fit-out. Federal initiatives such as the USD 500 billion Stargate program funnel large master contracts to OEMs that can certify origin tracking under CHIPS Act guardrails. Regional utilities, grappling with 250 MW single-site requests, are partnering with operators on stranded-generation reclamation, weaving renewable PPAs into server TCO models.
Asia Pacific is the fastest-growing theater at 7.38% CAGR, buoyed by Beijing's sovereign AI mandates and a construction wave across Tokyo, Sydney, and Seoul. Tight moratoria in Singapore divert builds to Johor and Batam, while Mumbai's land-bank constraints propel interest in modular, stackable data halls assembled off-site. Local-language cloud providers are specifying air-free immersion tanks to sidestep water-usage caps, a move that shifts spend toward vendors pre-qualifying motherboards for dielectric fluids. National data-protection statutes in India and Indonesia further localize procurement, requiring OEMs to establish bonded warehouse facilities for in-country assembly. Europe contributes steady incremental demand, albeit under the shadow of power-usage quotas and carbon levies that impose stricter PUE thresholds than any other region. Frankfurt's metro ring now prohibits new 70 MW-plus builds within city limits, pushing overspill into Hesse's rural districts. Paris, backed by a sovereign cloud charter, is underwriting zero-carbon zones fueled by nuclear baseload, giving European buyers a cost-stable alternative to natural-gas-pegged tariffs. Amsterdam lifts its data-center pause only for projects demonstrating district-heating recovery, a rule that favors vendors integrating warm-water servers into heat-exchange loops for residential blocks. Across the continent, VAT exemptions on energy-efficient hardware partially offset the upfront premium of liquid-cooled racks.
- Dell Technologies Inc.
- Super Micro Computer Inc.
- Hewlett Packard Enterprise Company
- Inspur Electronic Information Industry Co. Ltd.
- Lenovo Group Limited
- International Business Machines Corporation
- Cisco Systems Inc.
- Oracle Corporation
- Fujitsu Limited
- NEC Corporation
- Hitachi Ltd.
- Toshiba Corporation
- Unisys Corporation
- Quanta Computer Inc.
- Wiwynn Corporation
- Wistron Corporation
- Atos SE
- Huawei Technologies Co. Ltd.
- ZTE Corporation
- IEIT Systems Co. Ltd.
Additional Benefits:
- The market estimate (ME) sheet in Excel format
- 3 months of analyst support
TABLE OF CONTENTS
1 INTRODUCTION
- 1.1 Study Assumptions and Market Definition
- 1.2 Scope of the Study
2 RESEARCH METHODOLOGY
3 EXECUTIVE SUMMARY
4 MARKET LANDSCAPE
- 4.1 Market Overview
- 4.2 Market Drivers
- 4.2.1 Growing AI-accelerated workload demand
- 4.2.2 Enterprise cloud migration and hybrid cloud strategies
- 4.2.3 Rapid growth of edge computing and 5G-enabled micro data centers
- 4.2.4 Opex-based server subscription and consumption models
- 4.2.5 Adoption of liquid cooling enabling higher rack densities
- 4.2.6 Government AI infrastructure stimulus programs
- 4.3 Market Restraints
- 4.3.1 Server virtualization and consolidation reducing physical installs
- 4.3.2 Price erosion and commoditization of x86 hardware
- 4.3.3 Supply-chain shortages for GPUs and silicon-photonics components
- 4.3.4 Rising data-center energy tariffs and carbon-compliance costs
- 4.4 Industry Ecosystem Analysis
- 4.5 Impact of Macroeconomic Factors
- 4.6 Regulatory Landscape
- 4.7 Technological Outlook
- 4.8 Porter's Five Forces Analysis
- 4.8.1 Bargaining Power of Suppliers
- 4.8.2 Bargaining Power of Buyers
- 4.8.3 Threat of New Entrants
- 4.8.4 Threat of Substitutes
- 4.8.5 Intensity of Competitive Rivalry
5 MARKET SIZE AND GROWTH FORECASTS (VALUE)
- 5.1 By Operating System
- 5.1.1 Linux
- 5.1.2 Windows
- 5.1.3 UNIX
- 5.1.4 Other Operating System (i5/OS, z/OS, etc.)
- 5.2 By Server Class
- 5.2.1 High-end Server
- 5.2.2 Mid-range Server
- 5.2.3 Volume Server
- 5.3 By Server Type
- 5.3.1 Blade
- 5.3.2 Multi-node
- 5.3.3 Tower
- 5.3.4 Rack Optimized
- 5.4 By End-user Vertical
- 5.4.1 IT and Telecommunication
- 5.4.2 Banking, Financial Services and Insurance
- 5.4.3 Manufacturing
- 5.4.4 Retail
- 5.4.5 Healthcare
- 5.4.6 Media and Entertainment
- 5.4.7 Other End-user Verticals
- 5.5 By Geography
- 5.5.1 North America
- 5.5.1.1 United States
- 5.5.1.2 Canada
- 5.5.1.3 Mexico
- 5.5.2 South America
- 5.5.2.1 Brazil
- 5.5.2.2 Argentina
- 5.5.2.3 Rest of South America
- 5.5.3 Europe
- 5.5.3.1 Germany
- 5.5.3.2 Italy
- 5.5.3.3 United Kingdom
- 5.5.3.4 France
- 5.5.3.5 Spain
- 5.5.3.6 Rest of Europe
- 5.5.4 Asia Pacific
- 5.5.4.1 China
- 5.5.4.2 Japan
- 5.5.4.3 India
- 5.5.4.4 South Korea
- 5.5.4.5 Rest of Asia Pacific
- 5.5.5 Middle East
- 5.5.5.1 Saudi Arabia
- 5.5.5.2 United Arab Emirates
- 5.5.5.3 Turkey
- 5.5.5.4 Rest of Middle East
- 5.5.6 Africa
- 5.5.6.1 South Africa
- 5.5.6.2 Nigeria
- 5.5.6.3 Rest of Africa
- 5.5.1 North America
6 COMPETITIVE LANDSCAPE
- 6.1 Market Concentration
- 6.2 Strategic Moves
- 6.3 Market Share Analysis
- 6.4 Company Profiles (includes Global level Overview, Market level overview, Core Segments, Financials as available, Strategic Information, Market Rank/Share for key companies, Products and Services, and Recent Developments)
- 6.4.1 Dell Technologies Inc.
- 6.4.2 Super Micro Computer Inc.
- 6.4.3 Hewlett Packard Enterprise Company
- 6.4.4 Inspur Electronic Information Industry Co. Ltd.
- 6.4.5 Lenovo Group Limited
- 6.4.6 International Business Machines Corporation
- 6.4.7 Cisco Systems Inc.
- 6.4.8 Oracle Corporation
- 6.4.9 Fujitsu Limited
- 6.4.10 NEC Corporation
- 6.4.11 Hitachi Ltd.
- 6.4.12 Toshiba Corporation
- 6.4.13 Unisys Corporation
- 6.4.14 Quanta Computer Inc.
- 6.4.15 Wiwynn Corporation
- 6.4.16 Wistron Corporation
- 6.4.17 Atos SE
- 6.4.18 Huawei Technologies Co. Ltd.
- 6.4.19 ZTE Corporation
- 6.4.20 IEIT Systems Co. Ltd.
7 MARKET OPPORTUNITIES AND FUTURE OUTLOOK
- 7.1 White-Space and Unmet-Need Assessment


