


 |
市場調查報告書
商品編碼
1939628
界面活性劑:市場佔有率分析、產業趨勢與統計、成長預測(2026-2031)Surfactants - Market Share Analysis, Industry Trends & Statistics, Growth Forecasts (2026 - 2031) |
||||||
※ 本網頁內容可能與最新版本有所差異。詳細情況請與我們聯繫。
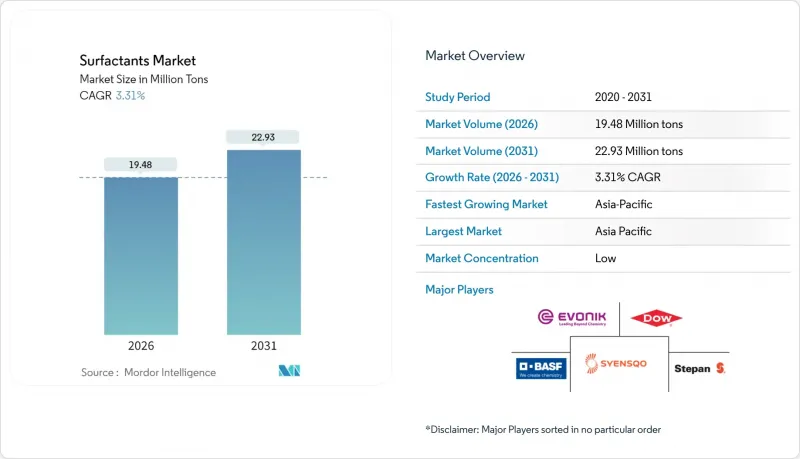
預計到 2026 年,界面活性劑市場規模將達到 1,948 萬噸,並預計從 2025 年的 1,886 萬噸成長。
預計到 2031 年將達到 2,293 萬噸,2026 年至 2031 年的複合年成長率為 3.31%。
高階個人保健產品中多功能溫和界面活性劑的採用、節能型冷水清潔劑的普及,以及為滿足日益嚴格的永續性法規而使用生物基成分,正在重塑市場競爭格局。同時,由於中國產能週期性過剩和長鏈醇類供應波動,價格持續波動,使得成本控制成為生產商的首要任務。綜合企業正利用其全球供應鏈和深厚的研發實力來捍衛市場佔有率,但亞太地區特種生物表面活性劑供應商和靈活的區域性企業正在逐步削弱它們的傳統優勢。
全球表面活性劑市場趨勢與洞察
無水個人保健產品對多功能溫和界面活性劑的需求日益成長
隨著品牌越來越重視肌膚溫和性和環保性,配方師們正逐漸拋棄傳統的硫酸鹽,轉而使用葡糖醯胺和羥乙基磺酸鹽。這些成分在濃縮型固態條、潔膚棒和洗衣粉中具有溫和的清潔和調理功效。科萊恩的研究表明,這些分子能夠減少沖洗用水量和能源消耗,同時保持消費者所重視的豐富泡沫。北美和歐洲的消費者願意為這些配方支付更高的價格,這促使BASF擴大了其EcoBalanced甜菜鹼產品線。與石油基替代品相比,該產品可將碳足跡降低高達30%。成分的快速改進和以水資源管理為重點的精準行銷,正為界面活性劑市場奠定基礎。隨著亞洲消費者開始接受固態清潔劑,預計市場將持續成長。
C6-C12脂肪酸供應過剩推動了向生物基原料的轉變
印尼的B35生質柴油強制令及類似計畫創造了充足的中鏈脂肪酸供應,這些脂肪酸與石腦油基脂肪酸具有競爭力,從而提高了可再生界面活性劑生產路線的經濟效益。歐洲製造商正在透過生質能平衡策略,在不進行資產重組的情況下,以可再生原料取代化石碳。同時,贏創在斯洛伐克新建的鼠李醣脂工廠正在展示利用歐洲玉米糖的可擴展發酵技術。歐盟森林砍伐法規和範圍3碳計量等政策促進因素,正在揭示繼續使用化石原料的成本,促使合成界面活性劑生產商根據其品牌永續性承諾,轉向混合原料組合。
嚴格的 PFAS 淘汰計畫會加速產品配方調整成本
歐盟和美國的監管機構正迅速採取行動,限制全氟和多氟烷基物質(PFAS)的使用,這將直接影響約38%的現有界面活性劑終端應用。 DIC公司已將一種不含PFAS的電動車潤滑油消泡劑商業化,其性能與PFAS消泡劑相當,但所需的研發投入推高了多個下游市場的單價。配方調整週期迫使企業引入新的穩定劑和加工工藝,這加劇了中小企業的技術資源壓力,並加速了產業整合。即使價格溢價持續存在,那些能夠及早響應並獲得合規認證的供應商仍將獲得優先供應商地位,這對錶面活性劑市場產生了影響。
細分市場分析
到2025年,陰離子活性劑將維持47.80%的市場佔有率,這主要得益於直鏈烷基苯磺酸鹽(LAS)的成本效益和在家用清潔劑領域的廣泛應用。 LAS的產量將超過400萬噸,受益於規模經濟和成熟的供應鏈。然而,兩性分子,例如甜菜鹼和氨基氧化物,預計將以4.30%的複合年成長率(CAGR)在所有表面活性劑類型中佔據主導地位,這主要得益於它們在pH範圍內溫和的性質以及在高階個人保健產品中穩定複雜配方的能力。目前,界面活性劑市場的主要企業正在推廣獲得生態認證的甜菜鹼,這些產品既符合零售商的清潔美容標準,又能確保高利潤率。
陽離子部分雖然尺寸很小,但在織物柔軟劑和抗菌季銨鹽混合物中卻至關重要;而矽酮界面活性劑由於其比碳基類似物具有更優異的延展性,已在紡織加工、提高石油採收率和高延伸率聚氨酯泡棉領域開闢了利基市場。
界面活性劑報告按類型(陰離子界面活性劑、陽離子界面活性劑等)、來源(合成界面活性劑、生物基界面活性劑等)、應用(家用肥皂和清潔劑、個人護理用品、潤滑油和燃料添加劑、工業和機構清潔劑等)以及地區(亞太地區、北美地區、歐洲地區等)進行細分。市場預測以公噸為單位。
區域分析
到2025年,亞太地區將佔全球表面活性劑市場總額的48.40%,預計到2031年將以4.24%的複合年成長率成長,這主要得益於中國強大的製造業基礎、印度中產階級的壯大以及東南亞的快速都市化。光是中國就供應了全球一半以上的十二烷基硫酸鈉(LAS)產量,並透過極具競爭力的價格策略,支撐著國內清潔劑市場和海外出口。
歐盟的無毀林採購規則和即將訂定的環境聲明指令迫使品牌所有者檢驗成分的可追溯性,從而推動了由企業永續發展預算資金籌措的生物表面活性劑試點計畫。在美國,產品性能日益受到重視,尤其是在濃縮型液體清潔劑和可減少包裝廢棄物的多用途擦拭巾。儘管這兩個地區都面臨 PFAS 替代成本的壓力,但它們也擁有能夠快速開發合規替代品的研究中心,這鞏固了它們作為表面活性劑市場下一代化學物質跳板的地位,而這些化學物質隨後可以推廣到新興市場。
阿布達比和阿曼的界面活性劑聚合物噴灑宣傳活動正在為適用於高溫高鹽環境的混合物開闢高附加價值市場。同時,奈及利亞和肯亞的都市化加快,帶動了包裝清潔劑消費量的成長。巴西正利用大豆和甘蔗生物生質燃料衍生的豐富脂肪酸產品,促進可再生界面活性劑的反向整合,進而降低外匯波動帶來的成本風險。儘管基礎設施不足、物流成本高昂以及經濟週期波動等挑戰依然存在,但與當地契約製造和經銷商合作的製造商正在降低風險,並擴大其在表面活性劑市場的佔有率。
其他福利:
- Excel格式的市場預測(ME)表
- 3個月的分析師支持
目錄
第1章 引言
- 研究假設和市場定義
- 調查範圍
第2章調查方法
第3章執行摘要
第4章 市場情勢
- 市場概覽
- 市場促進因素
- 無水個人保健產品對多功能溫和界面活性劑的需求日益成長
- 低溫洗衣清潔劑需求的成長帶動了對高性能陰離子活性劑的需求。
- C6-C12脂肪酸過剩促進了向生物基原料的轉型
- 中東、非洲和中國的提高石油採收率(EOR)計劃數量增加
- 在合約配藥廠現場進行槐醣脂發酵
- 市場限制
- 嚴格的 PFAS 淘汰計畫會加速產品配方調整成本
- 生質柴油政策變化導致長鏈醇價格波動
- 中國產能擴張引發週期性價格戰
- 價值鏈分析
- 波特五力模型
- 供應商的議價能力
- 買方的議價能力
- 新進入者的威脅
- 替代品的威脅
- 競爭程度
- 定價分析
第5章 市場規模與成長預測
- 按類型
- 陰離子活性劑
- 直鏈烷基苯磺酸鹽(LAS 或 LABS)
- 醇醚硫酸酯(AES)
- α-烯烴磺酸鹽(AOS)
- 仲磺酸鹽(SAS)
- 甲酯磺酸鹽(MES)
- 磺基琥珀酸酯
- 其他(磺酸鹽等)
- 陽離子界面活性劑
- 季銨化合物
- 其他
- 非離子界面活性劑
- 醇乙氧基化物
- 乙氧基化烷基酚
- 脂肪酸酯
- 其他
- 兩性界面活性劑
- 矽油界面活性劑
- 陰離子活性劑
- 按原產地
- 合成界面活性劑
- 生物基界面活性劑
- 透過使用
- 家用肥皂和清潔劑
- 個人護理
- 潤滑油和燃油添加劑
- 工業和機構清潔
- 食品加工
- 油田化學品
- 農業化學品
- 紡織加工
- 乳化
- 其他用途
- 按地區
- 亞太地區
- 中國
- 印度
- 日本
- 韓國
- ASEAN
- 亞太其他地區
- 北美洲
- 美國
- 加拿大
- 墨西哥
- 歐洲
- 德國
- 英國
- 法國
- 義大利
- 俄羅斯
- 其他歐洲地區
- 南美洲
- 巴西
- 阿根廷
- 其他南美洲
- 中東和非洲
- 沙烏地阿拉伯
- 南非
- 其他中東和非洲地區
- 亞太地區
第6章 競爭情勢
- 市場集中度
- 策略趨勢
- 市佔率(%)/排名分析
- 公司簡介
- 3M
- Arkema
- Ashland
- BASF
- Bayer AG
- CEPSA
- Clariant
- Croda International Plc
- Dow
- Emery Oleochemicals
- Evonik Industries AG
- Galaxy Surfactants
- GEO
- Godrej Industries Limited
- Indorama Ventures Public Limited
- Innospec
- Kao Corporation
- KLK OLEO
- Lankem
- Lonza
- Nouryon
- P&G Chemicals
- Reliance Industries Limited
- SANYO CHEMICAL INDUSTRIES, LTD.
- Sasol Limited Group
- Sinopec(China Petrochemical Corporation)
- Syensqo
- Stepan Company
- Sulfatrade SA
- Sumitomo Chemical Co., Ltd.
- Taiwan NJC Corporation
- TENSAC
- YPF
第7章 市場機會與未來展望
Surfactants market size in 2026 is estimated at 19.48 Million tons, growing from 2025 value of 18.86 Million tons with 2031 projections showing 22.93 Million tons, growing at 3.31% CAGR over 2026-2031.
Adoption of multifunctional mild surfactants in premium personal-care formats, cold-water laundry detergents that cut energy use, and bio-based feedstocks that satisfy tightening sustainability rules are setting the competitive agenda. Meanwhile, persistent price volatility tied to China's periodic overcapacity cycles and long-chain alcohol supply swings keeps cost discipline front-of-mind for producers. Integrated players leverage global supply chains and research and development depth to defend share, but specialty biosurfactant suppliers and agile regional firms in Asia-Pacific are steadily eroding historical advantages.
Global Surfactants Market Trends and Insights
Growing Demand for Multifunctional Mild Surfactants in Water-less Personal-Care Formats
Brands are prioritizing skin compatibility and environmental credentials, prompting formulators to shift from traditional sulfate systems to glucamides and isethionates that deliver gentle cleansing and conditioning in concentrated bars, sticks, and powders. Clariant's studies show these molecules cut rinse-water volume and energy use while maintaining foaming sensory cues valued by consumers. North American and European shoppers pay premiums for such formats, encouraging BASF to widen its EcoBalanced betaine line that trims product carbon footprints by as much as 30% compared with petro-based counterparts. Rapid ingredient iteration and targeted marketing around water stewardship are preparing the surfactants market for sustained adoption once Asian consumers gravitate toward solid cleansers.
Shift to Bio-Based Feedstocks Enabled by C6-C12 Fatty-Acid Over-Supply
Indonesia's B35 biodiesel mandate and similar programs unlock abundant medium-chain fatty acids priced competitively with naphtha-based chains, tipping the economics toward renewable surfactant routes. European producers deploy biomass-balance approaches that substitute fossil carbon with renewable inputs without rebuilding assets, while Evonik's new rhamnolipid plant in Slovakia demonstrates scalable fermentation on European corn sugar. Policy drivers such as the EU's Deforestation-Free Regulation and Scope 3 carbon accounting sharpen the cost of staying fossil-based, edging synthetic incumbents in the surfactants industry toward mixed portfolios that better align with brand sustainability pledges.
Stringent PFAS Phase-Out Accelerating Reformulation Costs
Regulators in the EU and the United States have fast-tracked restrictions on per- and polyfluoroalkyl substances, directly affecting roughly 38% of current surfactant end-uses. DIC has already commercialized PFAS-free defoamers for electric vehicle lubricants that match the legacy performance envelope, but the required research and development investment raises unit costs across multiple downstream markets. Reformulation cascades force new stabilizer and processing regimes, stretching technical resources at smaller firms and accelerating consolidation. Early-moving suppliers able to certify compliance win preferred-vendor status even if price premiums persist, influencing the surfactants market.
Other drivers and restraints analyzed in the detailed report include:
- Rise of Enhanced-Oil-Recovery (EOR) Projects in MEA and China
- On-Site Fermentation of Sophorolipids at Contract Formulators
- Long-Chain Alcohol Volatility Linked to Biodiesel Policy Swings
For complete list of drivers and restraints, kindly check the Table Of Contents.
Segment Analysis
Anionic surfactants retained a commanding 47.80% surfactant market share in 2025 as linear alkylbenzene sulfonate (LAS) remained cost-effective and widely approved for household detergents. LAS volumes surpassed 4 million tons, benefiting from scale economies and established supply chains. However, amphoteric molecules such as betaines and amino oxides are projected to record a 4.30% CAGR, the fastest among all types, propelled by their mildness across pH ranges and ability to stabilize complex formulations in premium personal care. The surfactants market is already witnessing major players brandishing eco-certified betaines that secure higher margins while meeting retailer clean-beauty scorecards.
Cationic segments remain small but indispensable in fabric softening and antimicrobial quaternary blends, whereas silicone surfactants carve out niches in textile finishing, enhanced oil recovery, and high-stretch polyurethane foams where their spreadability outperforms carbon-based analogs.
The Surfactants Report is Segmented by Type (Anionic Surfactants, Cationic Surfactants, and More), Origin (Synthetic Surfactants and Bio-Based Surfactants), Application (Household Soap and Detergent, Personal Care, Lubricants and Fuel Additives, Industry and Institutional Cleaning, and More), and Geography (Asia-Pacific, North America, Europe, and More). The Market Forecasts are Provided in Terms of Volume (Tons).
Geography Analysis
Asia-Pacific held 48.40% of the total surfactants market share in 2025 and is projected to expand at a 4.24% CAGR to 2031, underpinned by China's dominant manufacturing base, India's rising middle class, and Southeast Asia's rapid urban migration. China alone supplies more than half of global LAS output, enabling aggressive pricing that feeds both domestic detergents and overseas exports.
The EU's deforestation-free sourcing rules and pending green-claim directives push brand owners to validate traceable feedstocks, bolstering biosurfactant pilots financed via corporate sustainability budgets. The United States emphasizes performance gains, particularly in concentrated laundry liquids and all-purpose wipes that trim packaging waste. Both regions bear the brunt of PFAS reformulation costs yet house the research hubs capable of fast-tracking compliant alternatives, reinforcing their roles as launch pads for next-generation chemistries that later migrate to emerging markets in the surfactants market.
Surfactant-polymer flooding campaigns in Abu Dhabi and Oman open premium avenues for high-temperature, high-salinity blends, while Nigeria and Kenya witness rising consumption of packaged detergents as urbanization accelerates. Brazil leverages its ample fatty-acid by-products from soy and sugarcane biofuels to back-integrate renewable surfactants, offering cost relief against foreign exchange volatility. Infrastructure gaps, logistics costs, and economic cycles remain hurdles, yet manufacturers partnering with local tollers and distributors mitigate exposure and deepen the surfactants market footprint.
- 3M
- Arkema
- Ashland
- BASF
- Bayer AG
- CEPSA
- Clariant
- Croda International Plc
- Dow
- Emery Oleochemicals
- Evonik Industries AG
- Galaxy Surfactants
- GEO
- Godrej Industries Limited
- Indorama Ventures Public Limited
- Innospec
- Kao Corporation
- KLK OLEO
- Lankem
- Lonza
- Nouryon
- P&G Chemicals
- Reliance Industries Limited
- SANYO CHEMICAL INDUSTRIES, LTD.
- Sasol Limited Group
- Sinopec (China Petrochemical Corporation)
- Syensqo
- Stepan Company
- Sulfatrade SA
- Sumitomo Chemical Co., Ltd.
- Taiwan NJC Corporation
- TENSAC
- YPF
Additional Benefits:
- The market estimate (ME) sheet in Excel format
- 3 months of analyst support
TABLE OF CONTENTS
1 Introduction
- 1.1 Study Assumptions and Market Definition
- 1.2 Scope of the Study
2 Research Methodology
3 Executive Summary
4 Market Landscape
- 4.1 Market Overview
- 4.2 Market Drivers
- 4.2.1 Growing demand for multifunctional mild surfactants in water-less personal-care formats
- 4.2.2 Boom in low-temperature laundry detergents demanding high-performance anionics
- 4.2.3 Shift to bio-based feedstocks enabled by C6-C12 fatty-acid over-supply
- 4.2.4 Rise of enhanced-oil-recovery (EOR) projects in MEA and China
- 4.2.5 On-site fermentation of sophorolipids at contract formulators
- 4.3 Market Restraints
- 4.3.1 Stringent PFAS phase-out accelerating reformulation costs
- 4.3.2 Long-chain alcohol volatility linked to biodiesel policy swings
- 4.3.3 Capacity additions in China triggering periodic price wars
- 4.4 Value Chain Analysis
- 4.5 Porter's Five Forces
- 4.5.1 Bargaining Power of Suppliers
- 4.5.2 Bargaining Power of Buyers
- 4.5.3 Threat of New Entrants
- 4.5.4 Threat of Substitutes
- 4.5.5 Degree of Competition
- 4.6 Pricing Analysis
5 Market Size and Growth Forecasts (Volume)
- 5.1 By Type
- 5.1.1 Anionic Surfactants
- 5.1.1.1 Linear Alkylbenzene Sulfonate (LAS or LABS)
- 5.1.1.2 Alcohol Ether Sulfates (AES)
- 5.1.1.3 Alpha Olefin Sulfonates (AOS)
- 5.1.1.4 Secondary Alkane Sulfonate (SAS)
- 5.1.1.5 Methyl Ester Sulfonates (MES)
- 5.1.1.6 Sulfosuccinates
- 5.1.1.7 Others (Lignosulfonates, etc.)
- 5.1.2 Cationic Surfactants
- 5.1.2.1 Quaternary ammonium compound
- 5.1.2.2 Others
- 5.1.3 Non-ionic Surfactants
- 5.1.3.1 Alcohol ethoxylate
- 5.1.3.2 Ethoxylated Alkyl-phenols
- 5.1.3.3 Fatty acid ester
- 5.1.3.4 Others
- 5.1.4 Amphoteric Surfactants
- 5.1.5 Silicone Surfactants
- 5.1.1 Anionic Surfactants
- 5.2 By Origin
- 5.2.1 Synthetic Surfactants
- 5.2.2 Bio-based Surfactants
- 5.3 By Application
- 5.3.1 Household Soap and Detergent
- 5.3.2 Personal Care
- 5.3.3 Lubricants and Fuel Additives
- 5.3.4 Industry and Institutional Cleaning
- 5.3.5 Food Processing
- 5.3.6 Oilfield Chemicals
- 5.3.7 Agricultural Chemicals
- 5.3.8 Textile Processing
- 5.3.9 Emulsion Polymerisation
- 5.3.10 Other Applications
- 5.4 By Geography
- 5.4.1 Asia-Pacific
- 5.4.1.1 China
- 5.4.1.2 India
- 5.4.1.3 Japan
- 5.4.1.4 South Korea
- 5.4.1.5 ASEAN
- 5.4.1.6 Rest of Asia-Pacific
- 5.4.2 North America
- 5.4.2.1 United States
- 5.4.2.2 Canada
- 5.4.2.3 Mexico
- 5.4.3 Europe
- 5.4.3.1 Germany
- 5.4.3.2 United Kingdom
- 5.4.3.3 France
- 5.4.3.4 Italy
- 5.4.3.5 Russia
- 5.4.3.6 Rest of Europe
- 5.4.4 South America
- 5.4.4.1 Brazil
- 5.4.4.2 Argentina
- 5.4.4.3 Rest of South America
- 5.4.5 Middle-East and Africa
- 5.4.5.1 Saudi Arabia
- 5.4.5.2 South Africa
- 5.4.5.3 Rest of Middle-East and Africa
- 5.4.1 Asia-Pacific
6 Competitive Landscape
- 6.1 Market Concentration
- 6.2 Strategic Moves
- 6.3 Market Share (%)/Ranking Analysis
- 6.4 Company Profiles (includes Global level Overview, Market level overview, Core Segments, Financials as available, Strategic Information, Market Rank/Share, Products and Services, Recent Developments)
- 6.4.1 3M
- 6.4.2 Arkema
- 6.4.3 Ashland
- 6.4.4 BASF
- 6.4.5 Bayer AG
- 6.4.6 CEPSA
- 6.4.7 Clariant
- 6.4.8 Croda International Plc
- 6.4.9 Dow
- 6.4.10 Emery Oleochemicals
- 6.4.11 Evonik Industries AG
- 6.4.12 Galaxy Surfactants
- 6.4.13 GEO
- 6.4.14 Godrej Industries Limited
- 6.4.15 Indorama Ventures Public Limited
- 6.4.16 Innospec
- 6.4.17 Kao Corporation
- 6.4.18 KLK OLEO
- 6.4.19 Lankem
- 6.4.20 Lonza
- 6.4.21 Nouryon
- 6.4.22 P&G Chemicals
- 6.4.23 Reliance Industries Limited
- 6.4.24 SANYO CHEMICAL INDUSTRIES, LTD.
- 6.4.25 Sasol Limited Group
- 6.4.26 Sinopec (China Petrochemical Corporation)
- 6.4.27 Syensqo
- 6.4.28 Stepan Company
- 6.4.29 Sulfatrade SA
- 6.4.30 Sumitomo Chemical Co., Ltd.
- 6.4.31 Taiwan NJC Corporation
- 6.4.32 TENSAC
- 6.4.33 YPF
7 Market Opportunities and Future Outlook
- 7.1 White-space and Unmet-need Assessment
 2026 年至 2035 年聚合物界面活性劑市場的商業機會、成長要素、產業趨勢與預測。
 南美洲界面活性劑市場:市場佔有率分析、產業趨勢與統計及成長預測(2026-2031 年)
 界面活性劑市場:依產品、原料、功能及應用分類-2026-2032年全球市場預測界面活性劑提高採收率市場:按類型、來源、技術、分類、功能和應用分類-2026-2032年全球市場預測
 肺表面活性劑市場:按類型、藥物類型、適應症、給藥途徑、分銷管道和地區分類
 全球表面活性劑市場規模、佔有率、趨勢和成長分析報告(2026-2034年)全球無 PFAS 陰離子界面活性劑市場(按最終用途產業、產品類型、應用、形態、通路、原料來源和產業鏈長度分類)預測(2026-2032 年)全球無 PFAS 離子界面活性劑市場(按產品類型、物理形態、應用、分銷管道和終端用戶行業分類)預測(2026-2032 年)全球無 PFAS 非離子界面活性劑市場(按類型、形態、應用和分銷管道分類)預測(2026-2032 年)油田水泥防沉劑市場按類型、井型、幾何形狀、技術、壓力等級、應用和終端用戶分類,全球預測,2026-2032年