


 |
市場調查報告書
商品編碼
1939146
錫:市場佔有率分析、產業趨勢和統計數據、成長預測(2026-2031)Tin - Market Share Analysis, Industry Trends & Statistics, Growth Forecasts (2026 - 2031) |
||||||
※ 本網頁內容可能與最新版本有所差異。詳細情況請與我們聯繫。
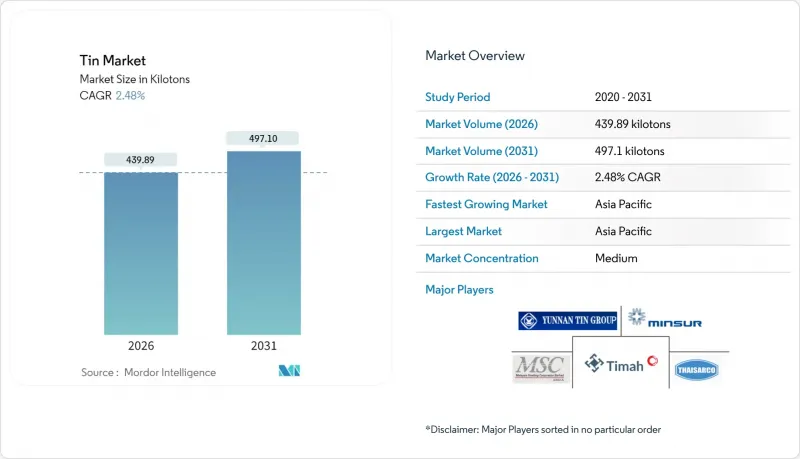
預計到 2026 年,錫市場規模將達到 439.89 千噸,高於 2025 年的 429.24 千噸。
預計到 2031 年產量將達到 497.1 千噸,2026 年至 2031 年的複合年成長率為 2.48%。
緬甸政治動盪導致的供應限制以及剛果民主共和國的供應風險,支撐了金屬價格的穩定,儘管其銷售成長較為溫和。金屬的特殊性在於其依賴銅、鉛和鋅礦開採,這使得金屬價格的波動性比原生金屬高出約50%,迫使製造商實現供應來源多元化。亞太地區位置中國電子產業和印尼冶煉廠,吸收了全球約70%的需求,並展現出該地區領先的成長速度。同時,北美和歐洲的買家正在加快在地採購和回收,以降低供應中斷的風險。
全球錫市場趨勢及展望
電子設備焊料需求不斷成長
電子焊料是錫的最大應用領域,在向無鉛合金轉型以符合RoHS指令的背景下,預計2024年將佔錫總消耗量的48.56%。 5G無線通訊基礎設施的廣泛應用和小型化半導體封裝的普及推動了單位錫用量的成長。這是因為先進的焊料合金需要95-99%的錫純度,而非傳統的60-63%的混合錫。高溫汽車模組中銀燒結製程的興起將限制電力電子領域焊料需求的成長,而消費性電子元件仍然高度依賴錫。用於鍺錫外延的氯化亞錫化學氣相沉積前驅體代表了一個利潤豐厚的利基市場,可能會影響電子級錫的價格。北美和歐洲的本地化項目正在推動對國內焊料生產的投資,這不僅降低了對亞洲供應商的依賴,也為錫市場提供了額外的供應量。
電動車電源和溫度控管組件的廣泛應用
電動汽車電力電子裝置(逆變器和電池組需要導熱合金)正在加速汽車產業對錫的需求。採用碳化矽晶片的模組會提高焊點溫度,因此更傾向於使用能夠承受嚴苛熱循環的銅錫金屬間化合物鍵。瞬態液相鍵結所需的材料等級與傳統焊料不同,促使合金開發商持續提高純度和潤濕性能。美國能源局提出的2025年實現100千瓦/公升功率密度的目標,推動了人們對高錫解決方案的興趣,這些解決方案旨在最大限度地減少面積並控制發熱量。嚴格的原始設備製造商(OEM)認證流程推高了價格,而錫金屬化和銀燒結之間的競爭平衡將決定高性能電動車領域在全球錫市場中的長期滲透率。
鋁/鋅/無鉛焊料替代品的供應狀況
在結溫高於 175°C 的汽車功率模組中,銀燒結和鋁線焊線正日益取代錫基合金。在高可靠性應用中,銅直接接合和壓接接觸系統進一步降低了每個裝置的錫用量。然而,由於資本成本、製程複雜性和較長的汽車認證週期(這些因素更有利於傳統的含錫焊料),這些技術的普及仍然受到限制。在家用電子電器,錫在成本績效方面與更昂貴的銀基系統保持最佳平衡,因此仍佔據錫市場的大部分需求。長期的競爭壓力將取決於能夠縮小成本差距並提高替代金屬化方法產能的製程創新。
細分市場分析
到2025年,合金將佔錫市場59.68%的佔有率,其精確的成分控制使其在焊料、軸承和特殊金屬等領域得到廣泛應用。合金市場具有規模經濟優勢,冶煉廠無需大量資本投入即可客製化錫鉛、錫銀和錫銅等合金,即使在礦石市場波動的情況下也能維持利潤率。純金屬錫的純度高達99.95%,適用於半導體、電池和太陽能等應用。預計到2031年,純金屬錫的複合年成長率將達到3.05%,從而進一步擴大其在整體錫市場規模中的比例。
像Aurobis這樣的生產商正在利用多金屬回收工藝,將精煉錫的產能擴大到每年1萬噸以上,從陽極污泥和複合廢料中回收金屬,同時獲得了ISO 9001和ISO 14001認證。這些一體化流程使供應來源多元化,減少了範圍3的排放,並吸引了追求淨零排放價值鏈的汽車製造商的需求。
本錫市場報告按產品類型(金屬、合金、化合物)、應用領域(焊料、鍍錫、化學品、鉛酸電池及其他應用)、終端用戶行業(汽車、電子、包裝、玻璃及其他終端用戶行業)和地區(亞太、北美、歐洲、南美、中東和非洲)對市場進行分析。市場預測以噸為單位。
區域分析
到2025年,亞太地區將佔全球錫消費量的68.85%,主要驅動力來自中國的電子製造業和印尼的採礦能力。受中國政府對電動車生產的支持以及東協地區電池供應鏈的建立,亞太地區錫市場規模正以3.12%的複合年成長率成長。在中國,崑山省和廣西壯族自治區的環境法規以及礦床資源的枯竭,促使冶煉廠進口高等級礦石;而印尼的PT Timah公司則因腐敗調查而暫時限制了錫的出口。
由於供應鏈安全措施促進了國內回收利用,北美錫市場正在改變。奧羅維斯公司投資8億美元在喬治亞里士滿興建了一座綜合金屬加工廠,確保了每年18萬噸的複雜廢料處理能力,從而為美國主要的汽車和航太製造商提供穩定的供應。
歐洲的錫消費格局日趨成熟,並以永續性發展為重點。德國在電動車電力電子領域主導錫的應用,而奧羅比斯位於漢堡的工廠則透過先進的污泥處理裝置加強了其高純度供應,該裝置可將陽極泥提煉成錫和特殊金屬。
中東和非洲地區目前的錫消費規模仍然小規模,但基礎設施的擴張和新興的汽車組裝業預計將逐步提升錫的需求。儘管剛果民主共和國擁有豐富的資源潛力,但該國的政治風險抑制了上游投資,使其成為全球錫市場供應穩定性的關鍵變數。
其他福利:
- Excel格式的市場預測(ME)表
- 3個月的分析師支持
目錄
第1章 引言
- 調查先決條件
- 調查範圍
第2章調查方法
第3章執行摘要
第4章 市場情勢
- 市場概覽
- 市場促進因素
- 電子領域對焊料的需求不斷成長
- 電動車動力和溫度控管組件的廣泛應用
- 擴大食品和飲料罐的鍍錫應用
- 無鉛錫基鈣鈦礦太陽能電池的技術突破
- 用於固態電池的富錫複合負極材料
- 市場限制
- 鋁/鋅/無鉛焊料替代品的供應情況
- 由於小規模採礦和衝突地區的供應,價格波動較大
- 緬甸和剛果民主共和國(剛果(金))供應鏈中不斷上升的ESG合規成本
- 價值鏈分析
- 波特五力模型
- 新進入者的威脅
- 買方的議價能力
- 供應商的議價能力
- 替代品的威脅
- 競爭程度
- 定價分析
第5章 市場規模與成長預測
- 依產品類型
- 金屬
- 合金
- 化合物
- 透過使用
- 焊接
- 鍍錫
- 化學品
- 鉛酸電池
- 其他用途(特殊合金)
- 按最終用戶行業分類
- 車
- 電子設備
- 包裝(食品/飲料)
- 玻璃
- 其他終端用戶產業(化學、工具製造、醫療設備)
- 按地區
- 生產分析
- 澳洲
- 玻利維亞
- 巴西
- 緬甸
- 中國
- 剛果(金沙薩)
- 印尼
- 馬來西亞
- 秘魯
- 越南
- 其他國家
- 消費分析
- 亞太地區
- 中國
- 印度
- 日本
- 韓國
- 亞太其他地區
- 北美洲
- 美國
- 加拿大
- 墨西哥
- 歐洲
- 德國
- 英國
- 法國
- 義大利
- 奧地利
- 其他歐洲地區
- 南美洲
- 巴西
- 阿根廷
- 其他南美洲
- 中東和非洲
- 沙烏地阿拉伯
- 南非
- 其他中東和非洲地區
- 亞太地區
- 生產分析
第6章 競爭情勢
- 市場集中度
- 策略趨勢
- 市佔率(%)/排名分析
- 公司簡介
- Andrada Mining
- ArcelorMittal
- Aurubis Beerse nv
- Avalon Advanced Materials Inc.
- Huaxi Nonferrous Metals
- Indium Corporation
- Jiangxi New Nanshan Technology Co. Ltd
- Malaysia Smelting Corporation Berhad
- Minsur
- Thailand Smelting & Refining Co. Ltd(Thaisarco)
- Timah
- YUNNAN TIN COMPANY GROUP LIMITED
第7章 市場機會與未來展望
Tin Market size in 2026 is estimated at 439.89 kilotons, growing from 2025 value of 429.24 kilotons with 2031 projections showing 497.1 kilotons, growing at 2.48% CAGR over 2026-2031.
Structural tightness caused by Myanmar's political instability and supply risks in the Democratic Republic of Congo underpins price stability despite modest volume growth. The metal's by-product nature-where production depends on copper, lead, and zinc mining-magnifies price swings by nearly 50% versus primary metals and forces manufacturers to secure diverse sources. Asia-Pacific, home to China's electronics complex and Indonesia's smelters, absorbs close to seven-tenths of global demand and posts region-leading growth, while North American and European buyers accelerate local sourcing and recycling initiatives to cut exposure to supply disruptions.
Global Tin Market Trends and Insights
Growing Demand for Solder in Electronics
Electronics solder remained the largest application, accounting for 48.56% of 2024 consumption as manufacturers transitioned to lead-free alloys to meet RoHS mandates. Fifth-generation wireless infrastructure and smaller semiconductor packages drive higher tin loading per unit because advanced solder alloys require 95-99% purity rather than legacy 60-63% blends. The migration to silver sintering in high-temperature automotive modules limits solder growth in power electronics, yet leaves consumer devices largely dependent on tin. Stannic chloride chemical vapor deposition precursors for GeSn epitaxy create a niche, high-margin outlet that can influence electronic-grade tin prices. Localization programs in North America and Europe fuel investment in domestic solder production, tempering dependence on Asian suppliers while adding incremental tonnage to the tin market.
Rising Adoption in EV Power and Thermal-Management Components
Automotive demand for tin market volumes accelerates as electric-vehicle power electronics need thermally conductive alloys for inverters and battery packs. Modules using silicon carbide chips push junction temperatures higher, favoring copper-tin intermetallic bonding that withstands extreme thermal cycling. Transient liquid-phase joining consumes different feedstock grades than conventional solder, prompting alloy developers to refine purity levels and wetting characteristics. Department of Energy density targets of 100 kW/L by 2025 intensify interest in tin-rich solutions that manage heat while minimizing footprint. Premium pricing arises from stringent OEM qualification cycles, and the competitive balance between tin metallization and silver sintering will shape long-term penetration in high-performance EV segments across the global tin market.
Availability of Aluminium/ Zinc/Lead-Free Solder Substitutes
Silver sintering and aluminum wire bonding increasingly displace tin-based alloys in automotive power modules that operate above 175 °C junction temperatures. Copper direct bonding and pressure-contact systems further reduce tin per device in high-reliability applications. Uptake, however, remains limited by capital cost, process complexity and lengthy automotive qualification cycles that favor legacy tin-rich solders. In consumer electronics, tin maintains a cost-performance sweet spot against pricier silver systems, preserving a large portion of tin market demand. Long-term competitive pressure will depend on process innovation that narrows cost gaps and enhances throughput for alternative metallization methods.
Other drivers and restraints analyzed in the detailed report include:
- Expanding Use in Tin-Plating for Food and Beverage Cans
- Break-throughs in Lead-Free Tin-Based Perovskite Solar Cells
- Price Volatility from Artisanal and Conflict-Area Supply
For complete list of drivers and restraints, kindly check the Table Of Contents.
Segment Analysis
Alloys held 59.68% tin market share in 2025 as precise composition control underpinned widespread solder, bearing, and specialty-metal formulations. The alloy segment benefits from economies of scope because smelters can tailor tin-lead, tin-silver, and tin-copper blends without major capital outlays, sustaining margins even during volatile ore markets. The pure metal category recorded 99.95% purity output that caters to semiconductor, battery, and photovoltaic uses and is set to register a 3.05% CAGR through 2031, lifting its contribution to the overall tin market size.
Producers such as Aurubis leverage multimetal recycling streams to exceed 10,000 metric-ton annual refined tin capacity, recovering metal from anode sludge and complex scrap while meeting ISO 9001 and ISO 14001 certifications. Such integrated flows diversify supply, reduce Scope 3 emissions, and appeal to automakers that pursue net-zero value chains.
The Tin Report is Segmented by Product Type (Metal, Alloy, and Compounds), Application (Solder, Tin Plating, Chemicals, Lead-Acid Batteries, and Other Applications), End-User Industry (Automotive, Electronics, Packaging, Glass, and Other End-User Industries), and Geography (Asia-Pacific, North America, Europe, South America, and Middle-East and Africa). The Market Forecasts are Provided in Terms of Volume (Tons).
Geography Analysis
Asia-Pacific dominated with 68.85% consumption in 2025, driven by China's electronics manufacturing and Indonesia's mining capacity. Regional tin market size growth at 3.12% CAGR leverages government incentives for electric-vehicle production in China and battery supply-chain build-out across the ASEAN bloc. Chinese concentrate output faced environmental curbs and resource depletion at Yunnan and Guangxi deposits, prompting smelters to import higher-grade ore, while Indonesia's PT Timah battled corruption probes that temporarily restricted exports.
North America's tin market advances on supply-chain security initiatives that reward domestic recycling. Aurubis invested USD 800 million in its Richmond, Georgia multimetal plant capable of processing 180,000 tons of complex scrap annually, ensuring a reliable supply for U.S. automotive and aerospace primes.
Europe shows mature yet sustainability-focused tin consumption. Germany leads uptake in EV power electronics, and Aurubis's Hamburg complex boosts high-purity supply through its Advanced Sludge Processing unit that refines anode mud into tin and specialty metals.
The Middle-East and Africa remains a minor consumer, although infrastructure expansion and nascent automotive assembly may lift demand incrementally. Political risks in the Democratic Republic of Congo restrain upstream investment despite sizable resource potential, keeping the region a swing factor in global tin market supply stability.
- Andrada Mining
- ArcelorMittal
- Aurubis Beerse nv
- Avalon Advanced Materials Inc.
- Huaxi Nonferrous Metals
- Indium Corporation
- Jiangxi New Nanshan Technology Co. Ltd
- Malaysia Smelting Corporation Berhad
- Minsur
- Thailand Smelting & Refining Co. Ltd (Thaisarco)
- Timah
- YUNNAN TIN COMPANY GROUP LIMITED
Additional Benefits:
- The market estimate (ME) sheet in Excel format
- 3 months of analyst support
TABLE OF CONTENTS
1 Introduction
- 1.1 Study Assumptions
- 1.2 Scope of the Study
2 Research Methodology
3 Executive Summary
4 Market Landscape
- 4.1 Market Overview
- 4.2 Market Drivers
- 4.2.1 Growing demand for solder in electronics
- 4.2.2 Rising adoption in EV power and thermal-management components
- 4.2.3 Expanding use in tin-plating for food and beverage cans
- 4.2.4 Break-throughs in lead-free tin-based perovskite solar cells
- 4.2.5 Tin-rich composite anodes for solid-state batteries
- 4.3 Market Restraints
- 4.3.1 Availability of aluminium/zinc/lead-free solder substitutes
- 4.3.2 Price volatility from artisanal and conflict-area supply
- 4.3.3 Rising ESG-compliance cost in Myanmar and DRC supply chains
- 4.4 Value Chain Analysis
- 4.5 Porter's Five Forces
- 4.5.1 Threat of New Entrants
- 4.5.2 Bargaining Power of Buyers
- 4.5.3 Bargaining Power of Suppliers
- 4.5.4 Threat of Substitutes
- 4.5.5 Degree of Competition
- 4.6 Price Analysis
5 Market Size and Growth Forecasts (Volume)
- 5.1 By Product Type
- 5.1.1 Metal
- 5.1.2 Alloy
- 5.1.3 Compounds
- 5.2 By Application
- 5.2.1 Solder
- 5.2.2 Tin Plating
- 5.2.3 Chemicals
- 5.2.4 Lead-acid Batteries
- 5.2.5 Other Applications (Specialized Alloys)
- 5.3 By End-user Industry
- 5.3.1 Automotive
- 5.3.2 Electronics
- 5.3.3 Packaging (Food and Beverage)
- 5.3.4 Glass
- 5.3.5 Other End-user Industries (Chemical, Tool Making, Medical Devices)
- 5.4 By Geography
- 5.4.1 Production Analysis
- 5.4.1.1 Australia
- 5.4.1.2 Bolivia
- 5.4.1.3 Brazil
- 5.4.1.4 Burma
- 5.4.1.5 China
- 5.4.1.6 Congo (Kinshasa)
- 5.4.1.7 Indonesia
- 5.4.1.8 Malaysia
- 5.4.1.9 Peru
- 5.4.1.10 Vietnam
- 5.4.1.11 Other Countries
- 5.4.2 Consumption Analysis
- 5.4.2.1 Asia-Pacific
- 5.4.2.1.1 China
- 5.4.2.1.2 India
- 5.4.2.1.3 Japan
- 5.4.2.1.4 South Korea
- 5.4.2.1.5 Rest of Asia-Pacific
- 5.4.2.2 North America
- 5.4.2.2.1 United States
- 5.4.2.2.2 Canada
- 5.4.2.2.3 Mexico
- 5.4.2.3 Europe
- 5.4.2.3.1 Germany
- 5.4.2.3.2 United Kingdom
- 5.4.2.3.3 France
- 5.4.2.3.4 Italy
- 5.4.2.3.5 Austria
- 5.4.2.3.6 Rest of Europe
- 5.4.2.4 South America
- 5.4.2.4.1 Brazil
- 5.4.2.4.2 Argentina
- 5.4.2.4.3 Rest of South America
- 5.4.2.5 Middle-East and Africa
- 5.4.2.5.1 Saudi Arabia
- 5.4.2.5.2 South Africa
- 5.4.2.5.3 Rest of Middle East and Africa
- 5.4.2.1 Asia-Pacific
- 5.4.1 Production Analysis
6 Competitive Landscape
- 6.1 Market Concentration
- 6.2 Strategic Moves
- 6.3 Market Share (%)/Ranking Analysis
- 6.4 Company Profiles (includes Global level Overview, Market level overview, Core Segments, Financials as available, Strategic Information, Market Rank/Share for key companies, Products and Services, and Recent Developments)
- 6.4.1 Andrada Mining
- 6.4.2 ArcelorMittal
- 6.4.3 Aurubis Beerse nv
- 6.4.4 Avalon Advanced Materials Inc.
- 6.4.5 Huaxi Nonferrous Metals
- 6.4.6 Indium Corporation
- 6.4.7 Jiangxi New Nanshan Technology Co. Ltd
- 6.4.8 Malaysia Smelting Corporation Berhad
- 6.4.9 Minsur
- 6.4.10 Thailand Smelting & Refining Co. Ltd (Thaisarco)
- 6.4.11 Timah
- 6.4.12 YUNNAN TIN COMPANY GROUP LIMITED
7 Market Opportunities and Future Outlook
- 7.1 White-space and Unmet-Need Assessment
 二月桂酸二丁基錫市場:依形態、化學反應類型、等級、應用、終端用戶產業及通路分類-2026-2032年全球市場預測
 日本錫市場規模、佔有率、趨勢及預測(依產品類型、應用、最終用途產業及地區分類),2026-2034年錫市場規模、佔有率、趨勢及預測(依產品類型、應用、最終用途產業及地區分類),2026-2034年電子錫焊料市場按類型、形式、最終用戶和應用分類,全球預測(2026-2032年)
 錫市場規模、佔有率和成長分析(按產品類型、應用、最終用途產業、分銷管道和地區分類)-2026-2033年產業預測
 全球錫市場(至 2035 年):依產品類型、應用類型、最終用戶、分銷管道、地區、行業趨勢和預測
 全球錫市場(2025-2029)
 三丁基氟化錫市場機會、成長動力、產業趨勢分析及 2025 - 2034 年預測
 全球錫市場規模(按應用、地區、範圍和預測)