


 |
市場調查報告書
商品編碼
1939145
生物肥料:市場佔有率分析、產業趨勢與統計、成長預測(2026-2031)Biofertilizers - Market Share Analysis, Industry Trends & Statistics, Growth Forecasts (2026 - 2031) |
||||||
※ 本網頁內容可能與最新版本有所差異。詳細情況請與我們聯繫。
預計生物肥料市場將從 2025 年的 36 億美元成長到 2026 年的 39.3 億美元,到 2031 年將達到 60.5 億美元,2026 年至 2031 年的複合年成長率為 9.05%。
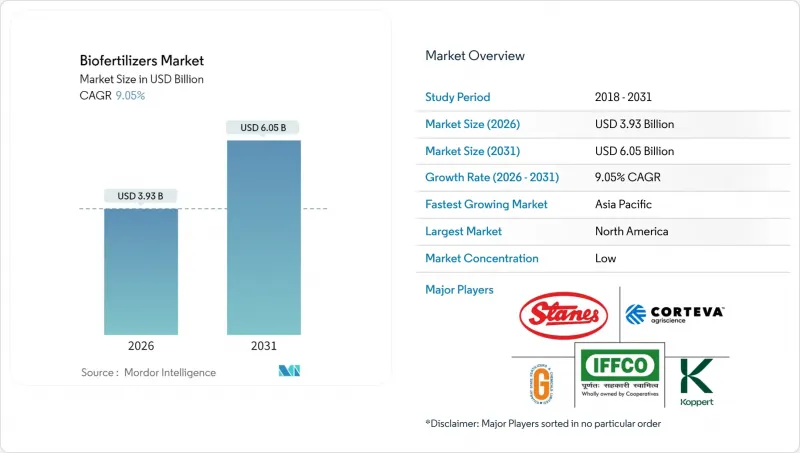
永續農業的強勁發展勢頭、日益嚴格的環境法規以及有機認證產品的高溢價正在推動市場需求。北美目前在生物肥料市場佔據領先地位,預計到2024年將佔據36.2%的市場佔有率,這反映了其成熟的有機認證體系和政府成本分擔計畫。亞太地區在成長中扮演著主導角色,這主要得益於印度和中國的國家補貼計劃,以及該地區正經歷著從合成投入物向生物投入物的轉變。在所有地區,排碳權貨幣化、精準施肥工具和複雜的微生物群落都在為供應商和種植者拓展利潤來源。主要農業投入品企業與區域專業企業之間的整合進一步加速了技術的應用,同時也重塑了競爭格局。
全球生物肥料市場趨勢與洞察
消費者轉向有機食品推動了高階市場的擴張
預計到2024年,有機食品銷售額將達到1,340億美元,年增15.2%。獲得認證的有機產品價格溢價20%至40%。零售商現在要求提供檢驗核實的生物投入記錄才能確保貨架空間,這促使生產商採用生物肥料市場解決方案以符合規定。歐洲人均有機食品消費量最高,其中德國和荷蘭的需求持續穩定。傳統有機食品領域以外的品牌所有者也在採用生物投入並擴大種植面積,以履行其永續性。這些趨同動態改善了供應商的收入前景,並增強了生物肥料市場的長期成長潛力。
政府補貼提高經濟可行性
美國農業部(USDA)已在其環境品質激勵計畫(EQIP)下累計3億美元,用於在2024年報銷符合條件的生物肥料成本的75%。同年,印度化學和肥料部也啟動了一項410億盧比(約5億美元)的推廣計畫。歐盟每年透過其生態計畫撥款81億歐元(約87億美元)推廣檢驗的生物投入品。巴西在其國家生物投入品計畫下,為微生物生產設施提供稅收減免。這些激勵措施正在縮短生產商的投資回收期,並推動生物肥料市場實現兩位數成長。
低溫運輸基礎設施的限制阻礙了市場准入
生物肥料需要儲存在2°C至8°C之間,但在室溫下,其活性每月會下降15%至30%。 40%的開發中國家缺乏足夠的冷藏設施,導致分銷成本增加高達四倍。物流障礙阻礙了零售分銷,也使得小規模經銷商無法儲備活性微生物產品。冷凍乾燥和包埋技術可以將保存期限延長至近兩年,但會使生產成本增加35%至50%。在現有低溫運輸基礎設施缺口得到有效解決之前,這項挑戰將繼續阻礙生物肥料市場的成長潛力。
細分市場分析
截至2025年,菌根真菌產品佔生物肥料市場佔有率的35.74%。叢枝菌根真菌可使玉米、大豆和蔬菜田的磷吸收率提高20-35%。根瘤菌製劑可透過固氮作用減少每公頃高達60公斤的合成肥料用量,預計將推動2026年至2031年間10.25%的複合年成長率。雙菌種混合物日益受到關注,美國環保署(EPA)的核准不斷增加,這推動了高附加價值產品的成長。旨在提高作物耐受性和擴大種植面積的多菌株研究支撐了複合年成長率的預測,並吸引了新的資金流入生物肥料市場的這一領域。
發酵技術的持續投入,結合精準載體材料的使用,正在提升儲存穩定性與田間均勻性。提供農藝諮詢和產品配送服務的供應商正贏得大型種植者和合作社的支持。詳盡的應用數據正指導著下一代研發,促進了針對不同土壤特性客製化接種劑方案的開發。這些進步推高了平均售價,進一步鞏固了菌根及相關菌叢產品在生物肥料市場的競爭優勢。
生物肥料市場報告按菌種(固氮螺菌屬、固氮菌、菌根、磷酸鹽可溶性細菌、根瘤菌屬等)、作物類型(經濟作物、園藝作物等)和地區(非洲、亞太地區、歐洲、中東、北美等)進行細分。市場預測以價值(美元)和數量(公噸)為單位。
區域分析
到2025年,北美將佔生物肥料市場35.62%的佔有率,其中美國將佔據較大佔有率以滿足區域需求。聯邦政府的獎勵、成熟的低溫運輸和完善的推廣服務支撐著銷售量的持續成長。加拿大草原地區,特別是油菜籽和小麥種植區,生物肥料的應用仍在持續成長;而墨西哥則利用有機認證發展出口導向園藝產品。高研發投入、強大的經銷網路和廣泛的數位化農業平台,使北美成為生物肥料市場先進接種劑技術的部署中心。
亞太地區是成長最快的地區,預計到2031年將以9.74%的複合年成長率成長。印度正透過一項410億盧比的補貼計畫推動成長,該計畫每年向4500萬農民分發微生物材料。中國正透過區域示範田推廣化肥減量20%,目標是到2025年實現4.385億美元的減量。日本和澳洲正在投資高精度施肥系統,而越南和印尼則在稻田和棕櫚種植園推廣生物肥料。農村冷庫設施和國家推廣中心的擴建降低了推廣門檻,提高了該地區對全球生物肥料市場的貢獻。
歐洲在以金額為準位居第二,這得益於歐盟的「從農場到餐桌」目標和通用農業政策的環境支付機制。德國以23%的區域收入佔比領先,其次是法國和義大利。英國脫歐後,正利用其環境土地管理支付資金來推廣生物投入品。東歐的現代化項目正以兩位數的速度推動需求成長。南美洲,尤其是巴西和阿根廷,正利用大規模的大豆輪作來整合固氮菌種,從而擴大生物肥料市場的地理覆蓋範圍。
其他福利:
- Excel格式的市場預測(ME)表
- 3個月的分析師支持
目錄
第1章 引言
- 研究假設和市場定義
- 調查範圍
- 調查方法
第2章執行摘要和主要發現
第3章 報告
第4章:主要產業趨勢
- 有機耕作面積
- 人均有機產品支出
- 法律規範
- 阿根廷
- 澳洲
- 巴西
- 加拿大
- 中國
- 埃及
- 法國
- 德國
- 印度
- 印尼
- 伊朗
- 義大利
- 日本
- 墨西哥
- 荷蘭
- 奈及利亞
- 菲律賓
- 俄羅斯
- 南非
- 西班牙
- 泰國
- 土耳其
- 英國
- 美國
- 越南
- 價值鍊和通路分析
- 市場促進因素
- 消費者對有機食品的偏好正在推動高階市場的擴張。
- 政府補貼提高經濟可行性
- 環境法規加速了合成材料的替代
- 擴大經認證的有機農地以滿足需求
- 生物肥料使用中排碳權的貨幣化
- 利用微生物群落提高植物的耐旱性和耐鹽性
- 市場限制
- 低溫運輸基礎設施的限制阻礙了市場准入
- 不同農業系統的性能差異
- 來自生物促效劑和奈米肥料的競爭日益加劇
- 申請新型微生物菌株專利的障礙
第5章 市場規模和成長預測(價值和數量)
- 形式
- 固氮螺菌
- 固氮菌
- 菌根
- 溶磷細菌
- 根瘤菌
- 其他生物肥料
- 作物類型
- 經濟作物
- 園藝作物
- 田間作物
- 地區
- 非洲
- 按國家/地區
- 埃及
- 奈及利亞
- 南非
- 其他非洲地區
- 按國家/地區
- 亞太地區
- 按國家/地區
- 澳洲
- 中國
- 印度
- 印尼
- 日本
- 菲律賓
- 泰國
- 越南
- 亞太其他地區
- 按國家/地區
- 歐洲
- 按國家/地區
- 法國
- 德國
- 義大利
- 荷蘭
- 俄羅斯
- 西班牙
- 土耳其
- 英國
- 其他歐洲地區
- 按國家/地區
- 中東
- 按國家/地區
- 伊朗
- 沙烏地阿拉伯
- 其他中東地區
- 按國家/地區
- 北美洲
- 按國家/地區
- 加拿大
- 墨西哥
- 美國
- 北美其他地區
- 按國家/地區
- 南美洲
- 按國家/地區
- 阿根廷
- 巴西
- 南美洲其他地區
- 按國家/地區
- 非洲
第6章 競爭情勢
- 關鍵策略舉措
- 市佔率分析
- 公司簡介
- 公司簡介
- Gujarat State Fertilizers & Chemicals Ltd
- IPL Biologicals Limited
- Koppert Biological Systems Inc.
- Novonesis Group
- Rizobacter Argentina SA(Bioceres Crop Solutions)
- Symborg Inc.(Corteva Agriscience)
- Andermatt Group AG
- T. Stanes and Company Limited
- Atlantica Agricola
- Biostadt India Limited
- Kiwa Bio-Tech
- Lallemand Inc.
- Certis Biologicals(Mitsui & Co.)
- Indian Farmers Fertiliser Cooperative Limited
- Indogulf Company
- Bionema Ltd
- Binzhou Jingyang Biological Fertilizer Co. Ltd
- Sustane Natural Fertilizer Inc.
第7章:CEO們需要思考的關鍵策略問題
The biofertilizers market is expected to grow from USD 3.60 billion in 2025 to USD 3.93 billion in 2026 and is forecast to reach USD 6.05 billion by 2031 at 9.05% CAGR over 2026-2031.
Strong momentum in sustainable farming, stricter environmental rules, and premium pricing for certified organic produce reinforce demand. North America leads current revenue with a 36.2% biofertilizers market share in 2024, reflecting mature organic certification systems and government cost-share programs. Asia-Pacific sets the pace on the growth front, propelled by national subsidy schemes in India and China and by large areas transitioning from synthetic to biological inputs. Across all regions, carbon-credit monetization, precision application tools, and bundled microbial consortia are widening profit pools for suppliers and growers alike. Consolidation among agricultural-input majors and local specialists further accelerates technology diffusion while reshaping competitive boundaries.
Global Biofertilizers Market Trends and Insights
Consumer Shift Toward Organic Food Drives Premium Market Expansion
Organic food sales reached USD 134 billion in 2024, posting 15.2% year-over-year growth, and certified produce commands 20-40% price premiums . Retailers now require verified biological input records for shelf space, prompting growers to embrace biofertilizers market solutions for compliance. Europe posts the highest per-capita organic consumption, reinforcing steady demand in Germany and the Netherlands. Brand owners outside traditional organic niches are adopting biological inputs to satisfy public sustainability pledges, thereby enlarging addressable hectares. These convergence dynamics elevate revenue visibility for suppliers and strengthen long-term expansion prospects for the biofertilizers market.
Government Subsidies Create Favorable Adoption Economics
The United States Department of Agriculture (USDA) earmarked USD 300 million in 2024 under the Environmental Quality Incentives Program to reimburse up to 75% of qualifying biofertilizer costs . India's Ministry of Chemicals and Fertilizers launched an INR 41 billion (USD 500 million) promotion scheme the same year. The European Union (EU) allocates EUR 8.1 billion (USD 8.7 billion) annually through eco-schemes that reward verified biological inputs . Brazil, under its National Program for Biological Inputs, offers tax holidays on microbial manufacturing equipment. These incentives narrow payback periods for growers and catalyze double-digit growth in the biofertilizers market.
Cold-Chain Infrastructure Limitations Constrain Market Access
Biofertilizers must remain between 2 °C and 8 °C, yet viability drops 15-30% monthly at ambient temperatures. Forty percent of developing nations lack adequate cold storage, raising distribution costs by up to four times. Logistics hurdles weaken retail availability and deter small distributors from stocking live microbial products. Freeze-dry and encapsulation methods extend shelf life to almost two years but raise production costs 35-50%. Until the existing cold-chain infrastructure gaps are effectively addressed, this challenge will continue to impede the growth potential of the biofertilizers market.
Other drivers and restraints analyzed in the detailed report include:
- Environmental Regulations Accelerate Synthetic Input Substitution
- Certified Organic Acreage Expansion Sustains Demand
- Performance Inconsistency Across Agricultural Systems
For complete list of drivers and restraints, kindly check the Table Of Contents.
Segment Analysis
Mycorrhiza products held 35.74% of the biofertilizers market share in 2025. Arbuscular mycorrhizal fungi deliver 20-35% higher phosphorus uptake across corn, soybean, and vegetable plots. Rhizobium formulations lead future expansion at 10.25% CAGR from 2026 to 2031 due to nitrogen fixation that trims synthetic needs by up to 60 kg per hectare. Growing interest in dual-organism blends, validated by the Environmental Protection Agency (EPA) in its rising approvals roster, drives incremental value. Multi-strain research strengthens crop resilience and broadens acreage, reinforcing CAGR forecasts and pulling fresh capital into this slice of the biofertilizers market.
Sustained investment in fermentation technology, coupled with precision carrier materials, is boosting shelf stability and field consistency. Suppliers that integrate agronomy advisory with product supply are earning loyalty among large growers and cooperatives. Granular application data guides next-generation R&D, encouraging custom inoculant packages that match soil profiles. These advances increase average selling prices and deepen the competitive moat around the biofertilizers market size for mycorrhiza and related consortia products.
The Biofertilizers Market Report is Segmented by Form (Azospirillum, Azotobacter, Mycorrhiza, Phosphate Solubilizing Bacteria, Rhizobium, and More), by Crop Type (Cash Crops, Horticultural Crops, and More), and by Geography (Africa, Asia-Pacific, Europe, Middle East, North America, and More). The Market Forecasts are Provided in Terms of Value (USD) and Volume (Metric Tons).
Geography Analysis
North America held a 35.62% share of the biofertilizers market in 2025, with the United States accounting for a significant portion to meet regional demand. Federal incentives, mature cold chains, and robust extension services underpin sustained volume growth. Canada follows with prairie-focused adoption in canola and wheat, while Mexico leverages organic certification for export-oriented horticulture. High research intensity, strong dealer networks, and widespread digital agronomy platforms make North America a launchpad for advanced inoculant technologies within the biofertilizers market.
Asia-Pacific stands out as the fastest-growing territory, advancing at a projected 9.74% CAGR to 2031. India anchors growth through its INR 41 billion subsidy scheme, distributing microbial inputs to 45 million farmers each year. China, representing USD 438.5 million in 2025, pursues a 20% synthetic-fertilizer cut, supported by regional demonstration plots. Japan and Australia invest in high-precision delivery systems, while Vietnam and Indonesia deploy biofertilizers across rice and palm plantations. Upgrades in rural cold storage and state-run extension clinics reduce adoption hurdles, enhancing regional contribution to the global biofertilizers market size.
Europe ranks second by value, buoyed by the European Union (EU) Farm to Fork target and Common Agricultural Policy eco-payments. Germany leads at 23% of regional revenue, followed by France and Italy. Post-Brexit, the United Kingdom channels Environmental Land Management payments into biological input adoption. Eastern European modernization programs are adding demand at double-digit rates. South America, chiefly Brazil and Argentina, leverages large-scale soybean rotations to integrate nitrogen-fixing inoculants, widening the geographic spread of the biofertilizers market.
- Gujarat State Fertilizers & Chemicals Ltd
- IPL Biologicals Limited
- Koppert Biological Systems Inc.
- Novonesis Group
- Rizobacter Argentina S.A. (Bioceres Crop Solutions)
- Symborg Inc. (Corteva Agriscience)
- Andermatt Group AG
- T. Stanes and Company Limited
- Atlantica Agricola
- Biostadt India Limited
- Kiwa Bio-Tech
- Lallemand Inc.
- Certis Biologicals (Mitsui & Co.)
- Indian Farmers Fertiliser Cooperative Limited
- Indogulf Company
- Bionema Ltd
- Binzhou Jingyang Biological Fertilizer Co. Ltd
- Sustane Natural Fertilizer Inc.
Additional Benefits:
- The market estimate (ME) sheet in Excel format
- 3 months of analyst support
TABLE OF CONTENTS
1 INTRODUCTION
- 1.1 Study Assumptions and Market Definition
- 1.2 Scope of the Study
- 1.3 Research Methodology
2 EXECUTIVE SUMMARY AND KEY FINDINGS
3 REPORT OFFERS
4 KEY INDUSTRY TRENDS
- 4.1 Area Under Organic Cultivation
- 4.2 Per Capita Spending On Organic Products
- 4.3 Regulatory Framework
- 4.3.1 Argentina
- 4.3.2 Australia
- 4.3.3 Brazil
- 4.3.4 Canada
- 4.3.5 China
- 4.3.6 Egypt
- 4.3.7 France
- 4.3.8 Germany
- 4.3.9 India
- 4.3.10 Indonesia
- 4.3.11 Iran
- 4.3.12 Italy
- 4.3.13 Japan
- 4.3.14 Mexico
- 4.3.15 Netherlands
- 4.3.16 Nigeria
- 4.3.17 Philippines
- 4.3.18 Russia
- 4.3.19 South Africa
- 4.3.20 Spain
- 4.3.21 Thailand
- 4.3.22 Turkey
- 4.3.23 United Kingdom
- 4.3.24 United States
- 4.3.25 Vietnam
- 4.4 Value Chain and Distribution Channel Analysis
- 4.5 Market Drivers
- 4.5.1 Consumer Shift Toward Organic Food Drives Premium Market Expansion
- 4.5.2 Government Subsidies Create Favorable Adoption Economics
- 4.5.3 Environmental Regulations Accelerate Synthetic Input Substitution
- 4.5.4 Certified Organic Acreage Expansion Sustains Demand
- 4.5.5 Carbon-Credit Monetization for Biofertilizer Use
- 4.5.6 Adoption of Microbial Consortia for Drought/Salinity Tolerance
- 4.6 Market Restraints
- 4.6.1 Cold-Chain Infrastructure Limitations Constrain Market Access
- 4.6.2 Performance Inconsistency Across Agricultural Systems
- 4.6.3 Rising Competition from Biostimulants and Nano-fertilizers
- 4.6.4 Patentability Hurdles for Novel Microbial Strains
5 MARKET SIZE AND GROWTH FORECASTS (VALUE AND VOLUME)
- 5.1 Form
- 5.1.1 Azospirillum
- 5.1.2 Azotobacter
- 5.1.3 Mycorrhiza
- 5.1.4 Phosphate Solubilizing Bacteria
- 5.1.5 Rhizobium
- 5.1.6 Other Biofertilizers
- 5.2 Crop Type
- 5.2.1 Cash Crops
- 5.2.2 Horticultural Crops
- 5.2.3 Row Crops
- 5.3 Geography
- 5.3.1 Africa
- 5.3.1.1 By Country
- 5.3.1.1.1 Egypt
- 5.3.1.1.2 Nigeria
- 5.3.1.1.3 South Africa
- 5.3.1.1.4 Rest of Africa
- 5.3.1.1 By Country
- 5.3.2 Asia-Pacific
- 5.3.2.1 By Country
- 5.3.2.1.1 Australia
- 5.3.2.1.2 China
- 5.3.2.1.3 India
- 5.3.2.1.4 Indonesia
- 5.3.2.1.5 Japan
- 5.3.2.1.6 Philippines
- 5.3.2.1.7 Thailand
- 5.3.2.1.8 Vietnam
- 5.3.2.1.9 Rest of Asia-Pacific
- 5.3.2.1 By Country
- 5.3.3 Europe
- 5.3.3.1 By Country
- 5.3.3.1.1 France
- 5.3.3.1.2 Germany
- 5.3.3.1.3 Italy
- 5.3.3.1.4 Netherlands
- 5.3.3.1.5 Russia
- 5.3.3.1.6 Spain
- 5.3.3.1.7 Turkey
- 5.3.3.1.8 United Kingdom
- 5.3.3.1.9 Rest of Europe
- 5.3.3.1 By Country
- 5.3.4 Middle East
- 5.3.4.1 By Country
- 5.3.4.1.1 Iran
- 5.3.4.1.2 Saudi Arabia
- 5.3.4.1.3 Rest of Middle East
- 5.3.4.1 By Country
- 5.3.5 North America
- 5.3.5.1 By Country
- 5.3.5.1.1 Canada
- 5.3.5.1.2 Mexico
- 5.3.5.1.3 United States
- 5.3.5.1.4 Rest of North America
- 5.3.5.1 By Country
- 5.3.6 South America
- 5.3.6.1 By Country
- 5.3.6.1.1 Argentina
- 5.3.6.1.2 Brazil
- 5.3.6.1.3 Rest of South America
- 5.3.6.1 By Country
- 5.3.1 Africa
6 COMPETITIVE LANDSCAPE
- 6.1 Key Strategic Moves
- 6.2 Market Share Analysis
- 6.3 Company Landscape
- 6.4 Company Profiles (Includes Global Level Overview, Market Level Overview, Core Segments, Financials as Available, Strategic Information, Market Rank/Share for Key Companies, Products and Services, and Recent Developments)
- 6.4.1 Gujarat State Fertilizers & Chemicals Ltd
- 6.4.2 IPL Biologicals Limited
- 6.4.3 Koppert Biological Systems Inc.
- 6.4.4 Novonesis Group
- 6.4.5 Rizobacter Argentina S.A. (Bioceres Crop Solutions)
- 6.4.6 Symborg Inc. (Corteva Agriscience)
- 6.4.7 Andermatt Group AG
- 6.4.8 T. Stanes and Company Limited
- 6.4.9 Atlantica Agricola
- 6.4.10 Biostadt India Limited
- 6.4.11 Kiwa Bio-Tech
- 6.4.12 Lallemand Inc.
- 6.4.13 Certis Biologicals (Mitsui & Co.)
- 6.4.14 Indian Farmers Fertiliser Cooperative Limited
- 6.4.15 Indogulf Company
- 6.4.16 Bionema Ltd
- 6.4.17 Binzhou Jingyang Biological Fertilizer Co. Ltd
- 6.4.18 Sustane Natural Fertilizer Inc.
7 KEY STRATEGIC QUESTIONS FOR AGRICULTURAL BIOLOGICALS CEOS
 基於固氮菌的生物肥料市場:2026-2032年全球市場預測(按產品類型、作物類型、配方類型、應用方法、分銷管道和最終用戶分類)生物肥料市場:按類型、形態、作物類型、應用方法和分銷管道分類-2026-2032年全球市場預測
 2026年全球生物肥料市場報告
 2034年生物肥料接種劑市場預測-按產品類型、微生物類型、配方類型、應用方法、作物類型、通路和地區分類的全球分析
 生物肥料市場規模、佔有率、趨勢和預測:按類型、作物、微生物、應用方法和地區分類,2026-2034年
 生物有機肥料:市場佔有率分析、產業趨勢與統計、成長預測(2026-2031)
 生物肥料市場規模、佔有率、成長及全球產業分析:按類型和應用分類,區域洞察及2026-2034年預測全球生物肥料市場規模、佔有率、趨勢和成長分析報告(2026-2034年)2026年全球根瘤菌肥料市場報告根瘤菌接種劑市場按作物類型、形態、應用方法、最終用途和銷售管道分類-2026-2032年全球預測