


 |
市場調查報告書
商品編碼
1939128
資料中心冷卻:市場佔有率分析、產業趨勢與統計、成長預測(2026-2032)Data Center Cooling - Market Share Analysis, Industry Trends & Statistics, Growth Forecasts (2026 - 2032) |
||||||
※ 本網頁內容可能與最新版本有所差異。詳細情況請與我們聯繫。
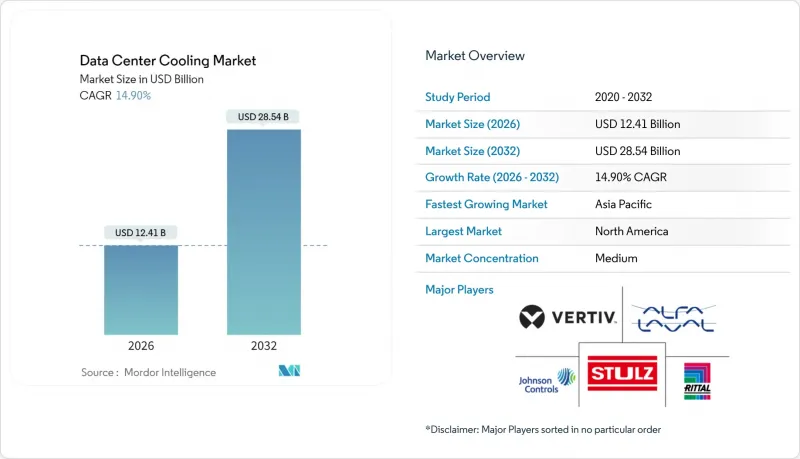
2025年資料中心冷卻市場價值108億美元,預計到2032年將達到285.4億美元,高於2026年的124.1億美元。
預計在預測期(2026-2032 年)內,複合年成長率將達到 14.90%。
從空氣冷卻系統向液體冷卻系統的持續過渡推動了這一成長,超大規模資料中心建設、人工智慧晶片的熱負荷以及對低全球暖化潛值(GWP)冷媒的強制性要求,都推動了近期採購的成長勢頭。液體冷卻解決方案已佔資料中心冷卻市場的46%,到2031年將以17.50%的複合年成長率成長,這表明市場對晶片直接冷卻和浸沒式冷卻架構的偏好將持續存在。雖然超大規模營運商是最大的需求來源,但隨著5G推動區域網路的發展,邊緣運算和微型站點部署的成長速度最快,達到18.00%。按地區分類,北美佔總支出的76%,而亞太地區18.20%的複合年成長率凸顯了新加坡、中國和日本支出的加速成長,這些地區的高密度設計彌補了土地資源的限制。 2024年至2025年,競爭格局將更加激烈。江森自控將價值81億美元的暖通空調資產出售給博世,以專注於專用資料中心冷卻器業務。Schneider Electric收購了浸沒式冷卻專家 Motivair,這標誌著該公司策略向液冷技術轉型。
全球資料中心冷卻市場趨勢與洞察
人工智慧和高效能運算工作負載推動了熱密度的快速成長。
如今,GPU密度高的伺服器每個機架的散熱量超過200kW,遠遠超過傳統的10kW閾值,也超過了傳統的精密空調機組。因此,直接冷卻板和全浸式冷卻槽正從試點階段走向生產階段,尤其是在Meta和微軟的AI叢集。晶片製造商正在將液冷通道整合到下一代封裝中,模糊了運算晶片和設施基礎設施之間的界限。同時,監管機構正在推動PUE值低於1.3,這創造了一種有利於液冷技術的雙壓環境。
二線都會區超大規模設施的擴張
在鳳凰城、哥倫布和大阪等城市,由於公共產業基礎設施往往不完善,開發商正尋求低廉的土地成本和綠能。因此,計劃紛紛採用模組化冷卻器和後門式熱交換器,以縮短試運行週期並應對較大的環境溫度波動。此外,這些地區的城市氣候提供了更長的自然通風時間,有助於降低影響基板資本投資核准的生命週期成本指標。
先進液體技術的資本投資溢價
浸沒式水槽比傳統的熱通道密閉系統貴60%,而且專用介電液每公升售價5-7美元,對於裝置容量低於2兆瓦的場所來說,投資回報頗具挑戰性。然而,在電力成本較高的地區,30-40%的節能效果可以將投資回收期縮短至三年以內。
細分市場分析
預計到2026年,液冷資料中心市場規模將達到59億美元,到2032年將超過153.3億美元,複合年成長率(CAGR)為17.25%。直接晶片冷卻管線在新興的人工智慧機架中佔據主導地位,而兩相浸沒式冷卻液則用於加密哈希叢集等特定工作負載。在機架密度低於15kW的企業環境中,氣冷式冷卻器和精密空調(CRAC)陣列仍然很常見,但隨著監管機構對電源使用效率(PUE)目標的日益嚴格,它們的市場佔有率正在逐年下降。為了應對這項挑戰,供應商正在推出混合冷卻器,將乙二醇迴路和隔熱墊結合,以延長自然冷卻的使用壽命。
後門式熱交換器為不願在整個機房內重新佈置機架的營運商提供了解決方案。單一熱交換器無需焊接地板即可將機架容量從 12kW 提升至 30kW。同時,專利的微對流冷板技術可實現 350W/cm² 的熱通量去除,標誌著液冷技術正式成為 x86 伺服器的主流選擇。邊緣機箱採用工廠密封的冷卻模組,減少了現場施工,並符合無人操作的要求。
機房空調仍佔總支出的30.60%,但其3.75%的複合年成長率低於整個資料中心冷卻市場。同時,由於液冷技術的普及帶動了管道需求的成長,冷水機組和熱交換器將以15.70%的複合年成長率成長。泵浦、閥門和冗餘歧管將受益於直通式迴路的廣泛應用,預計到2026年將成為一個價值19.5億美元的細分市場。人工智慧驅動的監控軟體成長最快,Google和阿里巴巴等園區透過調整風扇轉速和壓縮機分級運行,實現了15%至25%的節能效果。雖然價格昂貴,但整合了硬體、遙測和機器學習控制的套件能夠帶來可量化的營運成本節約,並且比獨立主機更容易獲得財務長的認可。
資料中心冷卻市場按冷卻技術(氣冷、液冷)、冷卻組件(機房空調機組 (CRAH/CRAC)、冷卻器和熱交換器等)、資料中心類型(超大規模、企業級、主機)、終端用戶產業(IT 和電信、零售和消費品等)以及地區進行細分。市場預測以以金額為準。
區域分析
預計到2026年,北美資料中心冷卻市場規模將達到93.5億美元,主要得益於鳳凰城、亞特蘭大和哥倫布等地的超大規模資料中心園區優先採用可在冷凝器迴路中使用再生污水的液體冷卻器。持續的夏季熱浪減少了自然通風的時間,促使操作員增加隔熱冷卻器以提高系統韌性。
2026年亞太市場規模為17.3億美元,預計到2032年將超過46.4億美元,複合年成長率達17.85%。新加坡已重新開放新建築許可,但設定了PUE值低於1.3的目標,鼓勵競標採用海水冷卻和液體浸沒式冷卻技術。東京的密集化策略是建造多層機房,並在每層都配備直接膨脹式盤管;而孟買沿海地區的高濕度則促使更多計劃採用混合式冷卻器來緩解缺水問題。
預計到2026年,歐洲市場規模將達到11.4億美元。北歐國家已從資料中心回收250兆瓦的廢熱,作為區域供熱的熱源。法蘭克福和阿姆斯特丹已推出廢熱再利用配額,以鼓勵購買高品質的水循環系統。在中東和非洲,人們正在採用液冷技術來應對高達攝氏50度的室外高溫。杜拜透過使用現場太陽能發電廠和蓄熱罐,將冷卻設備的電力消耗降低了17%。在拉丁美洲,克雷塔羅和聖地牙哥正在建造新建設,安裝間接蒸發冷卻模組,以利用涼爽的夜間氣候。儘管白天溫度很高,但這些項目的PUE值仍達到了1.2。
其他福利:
- Excel格式的市場預測(ME)表
- 3個月的分析師支持
目錄
第1章 引言
- 研究假設和市場定義
- 調查範圍
第2章調查方法
第3章執行摘要
第4章 市場情勢
- 市場概覽
- 市場促進因素
- 人工智慧和高效能運算工作負載推動了熱密度的快速成長。
- 二線都會區超大規模設施的擴張
- 強制性PUE/溫室氣體揭露法規
- 全球頻繁的熱浪增加了冷氣需求。
- 利用區域供熱迴路實現廢熱貨幣化
- 利用稅收優惠擴大地方電網邊緣基礎設施
- 市場限制
- 先進液冷技術的資本投資溢價
- 維修傳統閒置頻段的複雜性
- 低全球暖化潛勢冷媒的供應限制
- 使用非標準浸漬液帶來的保固風險
- 冷氣成本的關鍵考慮因素
- 資料中心營運主要成本開銷分析(重點關注冷卻)
- 冷凍技術比較研究(設計複雜性、PUE、優缺點、氣候條件利用率)
- 資料中心冷卻的關鍵創新和發展趨勢
- 資料中心採取的主要節能措施
- 價值/供應鏈分析
- 監管環境
- 技術展望
5. 目前資料中心面積分析
- 資料中心 IT 負載容量(兆瓦)和面積(平方英尺)分析(2019-2031 年)
- 主要資料中心集群分析
- 主要新型超大規模設施分析
第6章 市場規模及成長預測(價值,十億美元)
- 透過冷卻技術
- 空氣冷卻法
- 冷卻器和節熱器
- CRAH(電腦房空調機組)
- 冷卻塔(直接冷卻式、間接冷卻式、兩級冷卻式)
- 其他空氣冷卻技術
- 液冷法
- 浸沒式冷卻
- 晶片直接冷卻
- 後門熱交換器
- 空氣冷卻法
- 透過冷卻組件
- 電腦房空調機組(CRAH/CRAC)
- 冷卻器和熱交換裝置
- 冷卻塔和乾式冷卻器
- 泵浦和閥門
- 控制和監控軟體
- 依資料中心類型
- 超大規模(自有和租賃)
- 企業版(本地部署)
- 搭配
- 按最終用戶行業分類
- 資訊科技和電信
- 零售和消費品
- 衛生保健
- 媒體與娛樂
- 聯邦政府和政府機構
- 其他最終用戶
- 按地區
- 北美洲
- 美國
- 加拿大
- 墨西哥
- 南美洲
- 巴西
- 阿根廷
- 智利
- 其他南美洲
- 歐洲
- 德國
- 英國
- 法國
- 其他歐洲地區
- 亞太地區
- 中國
- 印度
- 日本
- 亞太其他地區
- 中東和非洲
- 中東
- 非洲
- 北美洲
第7章 競爭情勢
- 市佔率分析
- 公司簡介
- Vertiv
- Schneider Electric
- Stulz
- Rittal
- Johnson Controls
- Alfa Laval
- Fujitsu General
- Hitachi
- CoolIT Systems
- LiquidStack
- Asetek
- Asperitas
- Chilldyne
- Mikros Technologies
- Kaori Heat Treatment
- Lenovo
- Nortek Air Solutions
- Delta Electronics
- Munters
- Airedale(Modine)
- Black Box(Chatsworth Prod.)
- Submer
- GRC(Green Revolution Cooling)
- Coolcentric
- Starline
第8章:市場機會與未來展望
第9章 投資分析
The data center cooling market was valued at USD 10.80 billion in 2025 and estimated to grow from USD 12.41 billion in 2026 to reach USD 28.54 billion by 2032, at a CAGR of 14.90% during the forecast period (2026-2032).
Ongoing migration from air-based to liquid-based thermal systems underpins this expansion, while hyperscale build-outs, AI chip heat loads and low-GWP refrigerant mandates reinforce near-term purchasing momentum. Liquid solutions already claim a 46% data center cooling market share, and their 17.50% CAGR through 2031 signals lasting preference for direct-to-chip and immersion architectures. Hyperscale operators represent the single largest demand node, yet edge and micro-site deployments now post the fastest growth at 18.00% as 5G densifies rural networks. Geographically, North America contributes 76% of spending, but Asia-Pacific's 18.20% CAGR highlights accelerating spend in Singapore, China and Japan, where high-density designs offset land constraints. Competitive dynamics intensified in 2024-2025: Johnson Controls divested USD 8.1 billion of HVAC assets to Bosch to double down on data center-specific chillers, and Schneider Electric added immersion specialist Motivair to its portfolio, signaling a strategic pivot toward liquid engineering.
Global Data Center Cooling Market Trends and Insights
AI and HPC workload heat-density surge
GPU-dense servers now dissipate beyond 200 kW per rack, dwarfing legacy 10 kW envelopes and rendering conventional CRAC units ineffective. Direct-to-chip cold plates and full-immersion baths have therefore moved from pilots to production floors, particularly inside Meta and Microsoft AI clusters. Chipmakers embed liquid interface channels in next-generation packages, eroding the barrier between compute silicon and facility infrastructure Regulatory bodies simultaneously push PUE below 1.3, creating a dual-pressure environment that favors liquid technologies.
Hyperscale footprint expansion in secondary metros
Operators chase lower land costs and cleaner power in Phoenix, Columbus and Osaka, but those locations often lack mature utility infrastructure. As a result, projects specify modular chillers and rear-door heat exchangers that shorten commissioning cycles and tolerate wide ambient swings. Secondary-city climates also grant more free-air hours, lowering lifecycle cost metrics that drive board-level cap-ex approvals.
Cap-ex premium of advanced liquid technologies
Immersion tanks cost 60% more than traditional hot-aisle containment, and specialized dielectric fluids range USD 5-7 per liter, challenging ROI in sites below 2 MW. Nevertheless, energy savings of 30-40% compress payback to under three years in high-electricity-tariff regions.
Other drivers and restraints analyzed in the detailed report include:
- Mandatory PUE / GHG disclosure regulations
- Global heat-wave frequency raising cooling demand
- Retrofit complexity in legacy white-spaces
For complete list of drivers and restraints, kindly check the Table Of Contents.
Segment Analysis
The data center cooling market size for liquid methods reached USD 5.90 billion in 2026 and will eclipse USD 15.33 billion by 2032, advancing at 17.25% CAGR. Direct-to-chip pipelines dominate new AI racks, while dual-phase immersion tubs claim niche workloads such as crypto hashing clusters. Air-based chiller and CRAC arrays remain common in enterprise environments where rack densities linger below 15 kW, yet their share declines annually as regulations squeeze PUE targets. Vendors counter with hybrid coolers marrying glycol loops and adiabatic pads to extend free-cooling seasons.
Rear-door heat exchangers bridge the gap for operators unwilling to re-rack entire halls; a single exchanger lifts rack capacity from 12 kW to 30 kW without floor welding. Meanwhile, patents on microconvective cold plates promise 350 W/cm2 heat flux removal, foreshadowing liquid's march into mainstream x86 servers. Edge enclosures import factory-sealed coolant modules to slash on-site labor, aligning with unmanned operation mandates.
Computer-room air handlers still account for 30.60% of spend, but their 3.75% CAGR lags the overall data center cooling market. Conversely, chillers and heat-exchanger units will log 15.70% CAGR as liquid adoption expands pipework demand. Pumps, valves and redundancy manifolds form a USD 1.95 billion submarket in 2026, benefitting from direct-to-chip loop proliferation. AI-driven supervisory software posts the fastest growth, trimming fan RPM and compressor staging to save 15-25% energy at Google and Alibaba campuses. Integrated suites that blend hardware, telemetry and machine-learning controls command premium pricing yet deliver quantifiable OPEX reduction, convincing CFOs faster than standalone consoles.
Data Center Cooling Market is Segmented by Cooling Technology (Air-Based Cooling, Liquid-Based Cooling), Cooling Component (Computer-Room Air Handlers (CRAH/CRAC), Chillers and Heat-Exchanger Units, and More), Data Center Type (Hyperscale, Enterprise, Colocation), End-User Industry (IT and Telecom, Retail and Consumer Goods, and More), and Geography. The Market Forecasts are Provided in Terms of Value (USD).
Geography Analysis
North America recorded USD 9.35 billion of data center cooling market size in 2026, driven by hyperscale campuses in Phoenix, Atlanta and Columbus that favor liquid chillers able to exploit reclaimed wastewater for condenser loops. Extended summer heat waves shorten free-air windows, prompting operators to add adiabatic trim coolers for resilience.
Asia-Pacific contributed USD 1.73 billion in 2026 but will surpass USD 4.64 billion by 2032 on an 17.85% CAGR. Singapore reinstated new-build permits contingent on sub-1.3 PUE targets, steering bids toward seawater and liquid immersions. Tokyo's densification strategy stacks multi-story halls using direct-expansion coils for each floor, while Mumbai's coastal humidity inclines projects toward hybrid fluid coolers that mitigate water scarcity.
Europe generated USD 1.14 billion in 2026, with Nordic states extracting 250 MW of district-heating value from data center exhaust water. Frankfurt and Amsterdam now impose waste-heat-reuse quotas, nudging procurements toward high-grade water loops. Middle East and Africa adopt liquid cooling to battle 50 °C ambient peaks; Dubai's collocated solar farm plus thermal-storage tank trims chiller electricity by 17%. Latin America saw emergent builds in Queretaro and Santiago, where cooler night air favors indirect evaporative modules that achieve 1.2 PUE despite high daytime highs.
List of Companies Covered in this Report:
- Vertiv
- Schneider Electric
- Stulz
- Rittal
- Johnson Controls
- Alfa Laval
- Fujitsu General
- Hitachi
- CoolIT Systems
- LiquidStack
- Asetek
- Asperitas
- Chilldyne
- Mikros Technologies
- Kaori Heat Treatment
- Lenovo
- Nortek Air Solutions
- Delta Electronics
- Munters
- Airedale (Modine)
- Black Box (Chatsworth Prod.)
- Submer
- GRC (Green Revolution Cooling)
- Coolcentric
- Starline
Additional Benefits:
- The market estimate (ME) sheet in Excel format
- 3 months of analyst support
TABLE OF CONTENTS
1 INTRODUCTION
- 1.1 Study Assumptions and Market Definition
- 1.2 Scope of the Study
2 RESEARCH METHODOLOGY
3 EXECUTIVE SUMMARY
4 MARKET LANDSCAPE
- 4.1 Market Overview
- 4.2 Market Drivers
- 4.2.1 AI and HPC workload heat-density surge
- 4.2.2 Hyperscale footprint expansion in secondary metros
- 4.2.3 Mandatory PUE / GHG disclosure regulations
- 4.2.4 Global heat-wave frequency raising cooling demand
- 4.2.5 Monetisation of waste heat via district-energy loops
- 4.2.6 Tax-incentivised edge build-outs in rural grids
- 4.3 Market Restraints
- 4.3.1 Cap-ex premium of advanced liquid technologies
- 4.3.2 Retrofit complexity in legacy white-spaces
- 4.3.3 Limited supply of low-GWP refrigerants
- 4.3.4 Warranty-risk from non-standard immersion fluids
- 4.4 Key Cost Considerations for Cooling
- 4.4.1 Analysis of Key Cost Overheads Related to DC Operations (Cooling Focus)
- 4.4.2 Comparative Study of Cooling Technologies (Design Complexity, PUE, Pros/Cons, Weather Utilization)
- 4.4.3 Key Innovations and Developments in Data Center Cooling
- 4.4.4 Key Energy-Efficiency Practices Adopted in Data Centers
- 4.5 Value / Supply-Chain Analysis
- 4.6 Regulatory Landscape
- 4.7 Technological Outlook
5 ANALYSIS OF CURRENT DATA CENTER FOOTPRINT
- 5.1 Analysis of IT Load Capacity (MW) and Area footprint (Sq. Ft.) of Data Centers (for the period of 2019-2031)
- 5.2 Analysis of the major Data Center Hotspots
- 5.3 Analysis of Major Upcoming Hyperscale Facilities
6 MARKET SIZE and GROWTH FORECASTS (VALUE, USD BN)
- 6.1 By Cooling Technology
- 6.1.1 Air-based Cooling
- 6.1.1.1 Chiller and Economizer
- 6.1.1.2 CRAH (Computer-Room Air Handler)
- 6.1.1.3 Cooling Tower (Direct, Indirect, Two-Stage)
- 6.1.1.4 Other Air-based Cooling Technologies
- 6.1.2 Liquid-based Cooling
- 6.1.2.1 Immersion Cooling
- 6.1.2.2 Direct-to-Chip Cooling
- 6.1.2.3 Rear-Door Heat Exchanger
- 6.1.1 Air-based Cooling
- 6.2 By Cooling Component
- 6.2.1 Computer-Room Air Handlers (CRAH/CRAC)
- 6.2.2 Chillers and Heat-Exchanger Units
- 6.2.3 Cooling Towers and Dry Coolers
- 6.2.4 Pumps and Valves
- 6.2.5 Control and Monitoring Software
- 6.3 By Data Center Type
- 6.3.1 Hyperscale (Owned and Leased)
- 6.3.2 Enterprise (On-Premise)
- 6.3.3 Colocation
- 6.4 By End-user Industry
- 6.4.1 IT and Telecom
- 6.4.2 Retail and Consumer Goods
- 6.4.3 Healthcare
- 6.4.4 Media and Entertainment
- 6.4.5 Federal and Institutional Agencies
- 6.4.6 Other End users
- 6.5 By Geography
- 6.5.1 North America
- 6.5.1.1 United States
- 6.5.1.2 Canada
- 6.5.1.3 Mexico
- 6.5.2 South America
- 6.5.2.1 Brazil
- 6.5.2.2 Argentina
- 6.5.2.3 Chile
- 6.5.2.4 Rest of South America
- 6.5.3 Europe
- 6.5.3.1 Germany
- 6.5.3.2 United Kingdom
- 6.5.3.3 France
- 6.5.3.4 Rest of Europe
- 6.5.4 Asia-Pacific
- 6.5.4.1 China
- 6.5.4.2 India
- 6.5.4.3 Japan
- 6.5.4.4 Rest of Asia-Pacific
- 6.5.5 Middle East and Africa
- 6.5.5.1 Middle East
- 6.5.5.2 Africa
- 6.5.1 North America
7 COMPETITIVE LANDSCAPE
- 7.1 Market Share Analysis
- 7.2 Company Profiles (includes Global level Overview, Market level overview, Core Segments, Financials as available, Strategic Information, Market Rank/Share for key companies, Products and Services, and Recent Developments)
- 7.2.1 Vertiv
- 7.2.2 Schneider Electric
- 7.2.3 Stulz
- 7.2.4 Rittal
- 7.2.5 Johnson Controls
- 7.2.6 Alfa Laval
- 7.2.7 Fujitsu General
- 7.2.8 Hitachi
- 7.2.9 CoolIT Systems
- 7.2.10 LiquidStack
- 7.2.11 Asetek
- 7.2.12 Asperitas
- 7.2.13 Chilldyne
- 7.2.14 Mikros Technologies
- 7.2.15 Kaori Heat Treatment
- 7.2.16 Lenovo
- 7.2.17 Nortek Air Solutions
- 7.2.18 Delta Electronics
- 7.2.19 Munters
- 7.2.20 Airedale (Modine)
- 7.2.21 Black Box (Chatsworth Prod.)
- 7.2.22 Submer
- 7.2.23 GRC (Green Revolution Cooling)
- 7.2.24 Coolcentric
- 7.2.25 Starline
8 MARKET OPPORTUNITIES and FUTURE OUTLOOK
9 INVESTMENT ANALYSIS
 2026年航太港資料中心冷卻全球市場報告
 英洛冷凍市場:依產品類型、冷凍方式、安裝方式、冷氣量和最終用戶分類-2026-2032年全球預測
 資料中心冷卻市場分析及預測(至2035年):按類型、產品、服務、技術、組件、應用、部署、最終用戶、設備及解決方案分類
 資料中心冷卻市場報告:解決方案、服務、冷卻方法、冷卻技術、資料中心類型、產業和地區(2026-2034 年)整合式機架安裝單元 (CDU) 市場:按階段、容量、應用和最終用戶分類的全球預測,2026-2032 年資料中心CDU市場:按類型、組件、冷卻方式、容量、應用工作負載、最終用途、企業規模、安裝方式、分銷管道分類,全球預測,2026-2032年
 資料中心冷卻市場:依組件、冷卻技術、資料中心類型和行業劃分 - 全球預測至2036年
 全球資料中心冷卻市場規模、佔有率、趨勢和成長分析報告(2026-2034年)
 節水型資料中心技術市場,全球預測至2034年:依冷卻技術、水源、水處理方法、所有權模式及地區分類2026年全球資料中心冷卻市場報告