


 |
市場調查報告書
商品編碼
1939125
硫磺:市場佔有率分析、產業趨勢與統計、成長預測(2026-2031)Sulfur - Market Share Analysis, Industry Trends & Statistics, Growth Forecasts (2026 - 2031) |
||||||
※ 本網頁內容可能與最新版本有所差異。詳細情況請與我們聯繫。
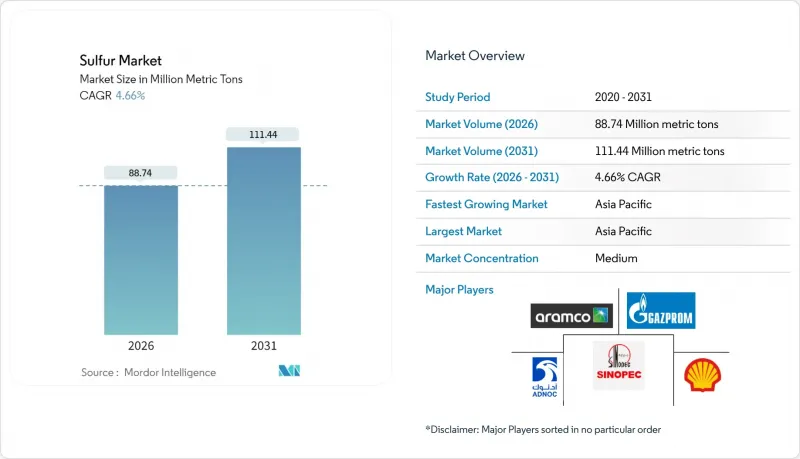
2025年硫磺市場價值為8,479萬噸,預計2026年將成長至8,874萬噸,到2031年將成長至1.1144億噸。
預計在預測期(2026-2031 年)內,複合年成長率將達到 4.66%。
儘管環境法規日益嚴格,但硫磺市場仍在穩步擴張,這主要得益於化肥消費的持續成長、超低硫柴油(ULSD)法規推動的煉油廠生產以及新興電池技術的創新。亞太地區仍是硫磺市場的核心區域,由於人口成長、煉油產能帶來的糧食需求以及產業多元化,該地區保持最大的硫磺供應和消費量。固體硫磺具有物流優勢,因為它避免了處理熔融硫磺所需的高成本熱處理、專用儲存槽和安全控制措施。競爭格局有利於將硫磺回收視為成本抵銷產品的石油和天然氣集團,而鋰硫電池和硫改質建築材料等高價值應用則鼓勵規模較小的專業公司建立高純度硫磺生產能力。儘管持續的SOx排放法規和高成本的熔融硫磺物流在短期內構成了一些障礙,但這並不影響硫磺市場未來五年的成長前景。
全球硫磺市場趨勢及展望
化肥生產需求增加
全球糧食安全目標將維持化肥的高產量,預計2025年,化肥將佔硫磺市場需求的88.96%。印度累計680億美元用於2024年的磷鉀肥補貼,這項政策促使緩釋肥中添加了大量的硫磺。中國的現代化建設推動了硫磺的補充,以改善貧瘠的土壤;而印尼和馬來西亞棕櫚油面積的擴大則推動了區域養分需求的成長。精密農業系統需要富含硫磺的微量元素配方,這不僅提高了單位肥料的硫含量,也創造了多元化的需求基礎,使硫磺市場免受區域衝擊的影響。
超低硫柴油(ULSD)精煉產能擴張
超低硫柴油(ULSD)法規迫使煉油廠從燃料中提取硫,並將這些硫重新投入硫市場。沙烏地阿拉伯吉贊煉油廠新建的脫硫裝置於2024年新增65萬噸供給能力,馬拉松石油公司位於加爾維斯頓灣的擴建計劃也新增了42萬噸產能。北美和歐洲的煉油商持續投資,以確保2030年特定產品的穩定供應,並改善先前硫供不應求地區的下游通道。
無論地區如何,都應嚴格執行SOx排放法規
歐盟工業排放指令要求硫酸廠到2030年將二氧化硫排放減少95%。美國國家空氣品質標準使監測和脫硫裝置的成本每噸增加2-4美元,推動小規模加工企業進行整合。中國正在收緊排放氣體法規,對不合規企業處以相當於其營業額10%的罰款。這些法規可能在短期內提高資本壁壘,減緩產能擴張速度,並抑制硫磺市場的成長動能。
細分市場分析
預計到2025年,固體產品將佔硫磺市場佔有率的80.62%,並預計到2031年將保持5.08%的複合年成長率。由於固體硫磺產品易於處理、保險成本低且無需加熱儲存,因此不具備專業設施的化學肥料生產商更傾向於選擇固體產品。隨著自動化裝載和除塵設備的改進,操作風險降低,固體硫磺的市場規模預計將進一步擴大。
顆粒狀和球狀硫磺能夠提高產品在運輸過程中的完整性,符合 ISO 14001 管理系統要求,並減少對環境的影響。液態硫磺的應用僅限於大型硫酸聯合企業,這些企業將熔融原料直接整合到生產線中,而高昂的物流成本限制了其廣泛應用。因此,隨著新興電池和建築業的使用者也開始指定使用顆粒狀原料,固體硫磺仍保持其主導地位。
硫磺市場報告按形態(固體與液態)、表面處理工程技術(顆粒狀、膏狀與造粒狀)、終端用戶行業(化肥、化學、金屬製造、橡膠加工及其他終端用戶行業)和地區(亞太地區、北美、歐洲、南美、中東和非洲)進行細分。市場預測以公噸為單位。
區域分析
至2025年,亞太地區將佔全球硫磺消費量的39.40%,並在2031年之前以5.55%的複合年成長率成長。中國消費了2,850萬噸硫磺,主要得益於其為實現糧食自給自足目標而製定的磷肥目標。印度的農業扶持政策以及東南亞種植作物不斷成長的化肥需求,正使該地區成為硫磺市場的重要成長引擎。
在北美,對超低硫柴油(ULSD)的投資以及內華達州和德克薩斯州鋰硫電池工廠的建設,正在推動區域硫需求的成長,並鞏固供需平衡。在歐洲,精密農業的進步和監管政策的調整,使得硫基土壤改良劑比合成化學品更受青睞。在中東和非洲,煉油廠回收率的提高和農業計畫的推進,推動了化肥用量的增加,進一步實現了硫市場的地域多元化。
其他福利:
- Excel格式的市場預測(ME)表
- 3個月的分析師支持
目錄
第1章 引言
- 研究假設和市場定義
- 調查範圍
第2章調查方法
第3章執行摘要
第4章 市場情勢
- 市場概覽
- 市場促進因素
- 化肥生產產業需求不斷成長
- 擴大超低硫柴油(ULSD)煉製產能
- 橡膠硫化過程中硫磺用量增加
- 鋰硫電池在電動車中的商業化
- 循環建築中硫改質瀝青與混凝土的推廣應用
- 市場限制
- 無論地區如何,都應嚴格執行SOx排放法規
- 熔融硫磺的物流處理成本很高
- 由於煉油廠脫碳和原油脫硫減少,硫回收率下降
- 價值鏈分析
- 波特五力模型
- 供應商的議價能力
- 買方的議價能力
- 新進入者的威脅
- 替代品的威脅
- 競爭程度
第5章 市場規模與成長預測
- 按形式
- 固體的
- 液體
- 透過完成技術
- 顆粒
- 糊狀產品
- 顆粒化
- 按最終用戶行業分類
- 肥料
- 化學加工
- 金屬製造
- 橡膠加工
- 其他終端用戶產業
- 按地區
- 亞太地區
- 中國
- 印度
- 日本
- 韓國
- 東南亞國協
- 亞太其他地區
- 北美洲
- 美國
- 加拿大
- 墨西哥
- 歐洲
- 德國
- 英國
- 義大利
- 法國
- 俄羅斯
- 其他歐洲地區
- 南美洲
- 巴西
- 阿根廷
- 其他南美洲
- 中東和非洲
- 沙烏地阿拉伯
- 南非
- 其他中東和非洲地區
- 亞太地區
第6章 競爭情勢
- 市場集中度
- 策略趨勢
- 市佔率(%)/排名分析
- 公司簡介
- ADNOC
- China Petroleum & Chemical Corporation(Sinopec)
- Flexsys America LP
- Gazprom International Limited
- Indian Oil Corporation Ltd
- Marathon Petroleum Corporation
- QatarEnergy LNG
- Saudi Arabian Oil Co.
- Shell plc
- Suncor Energy Inc.
- Tengizchevroil LLP
- Valero
第7章 市場機會與未來展望
The Sulfur Market was valued at 84.79 Million metric tons in 2025 and estimated to grow from 88.74 Million metric tons in 2026 to reach 111.44 Million metric tons by 2031, at a CAGR of 4.66% during the forecast period (2026-2031).
Ongoing fertilizer consumption, refinery output tied to ultra-low-sulfur diesel (ULSD) mandates, and early-stage battery innovation keep the sulfur market on a steady expansion path even as environmental rules tighten. Asia-Pacific remains the geographic anchor, supplying and consuming the largest volumes thanks to population-driven food demand, refinery capacity, and industrial diversification. Solid-form material dominates logistics because it avoids the costly heating, specialized tanks, and safety controls required for molten handling. Competitive behavior skews toward integrated oil and gas conglomerates that treat sulfur recovery as a cost-offsetting by-product, yet premium outlets in lithium-sulfur batteries and sulfur-modified construction materials are motivating smaller specialists to build high-purity capacity. Persistent SOx-emission caps and high-cost molten logistics pose near-term hurdles, but they do not dilute the five-year growth outlook for the sulfur market.
Global Sulfur Market Trends and Insights
Rising Demand from Fertilizer Manufacturing
Global food-security targets keep fertilizer output high, anchoring 88.96% of sulfur market demand in 2025. India earmarked USD 68 billion to subsidize phosphate and potash nutrients in 2024, a policy that pulled large sulfur volumes into controlled-release blends. China's modernization drive supports sulfur supplementation to upgrade depleted soils, while palm-oil acreage in Indonesia and Malaysia lifts regional nutrient intensity. Precision agriculture systems require sulfur-rich micronutrient formulations, which raise the sulfur content per fertilizer unit and create a dispersed demand base that shields the sulfur market from regional shocks.
Expansion of Ultra-Low-Sulfur Diesel Refining Capacity
ULSD legislation forces refiners to extract sulfur from fuel, generating a supply that flows back into the sulfur market. New desulfurization units in Saudi Arabia's Jazan refinery added 650,000 metric tons in 2024, and Marathon Petroleum's Galveston Bay expansion supplied another 420,000 metric tons. North American and European refiners continue to invest, ensuring steady by-product output through 2030 and improving downstream access in regions that once struggled with limited sulfur availability.
Stringent SOx-Emission Regulations Across Regions
The EU Industrial Emissions Directive mandates 95% SOx abatement in sulfuric-acid plants by 2030. The U.S. National Ambient Air Quality Standards add USD 2-4 per metric ton in monitoring and scrubber costs, nudging small processors toward consolidation. China's tighter stack-emission limits introduce fines at 10% of revenue for non-compliance. These rules raise capital barriers that slow capacity additions, trimming growth momentum for the sulfur market in the near term.
Other drivers and restraints analyzed in the detailed report include:
- Increasing Sulfur Usage in Rubber Vulcanization
- Commercialization of Lithium-Sulfur Batteries for E-Mobility
- High Logistics and Handling Cost for Molten Sulfur
For complete list of drivers and restraints, kindly check the Table Of Contents.
Segment Analysis
Solid products represented 80.62% of the sulfur market share in 2025 and are tracking a 5.08% CAGR to 2031. Handling ease, lower insurance premiums and the absence of heated storage explain the preference among fertilizer producers lacking specialized infrastructure. The sulfur market size for solid material is poised to rise further as automated loading and dust-suppression upgrades lower operational risks.
Granular and prilled formats also improve product integrity during transport, align with ISO 14001 management systems and reduce environmental exposure. Liquid sulfur stays limited to large sulfuric-acid complexes where molten feed integrates directly into process lines, but its high logistics bill caps broad adoption. Solid sulfur therefore keeps its leadership as emerging battery and construction users also specify granulated inputs.
The Sulfur Market Report is Segmented by Form (Solid and Liquid), Finishing-Process Technology (Granules, Pastilles, and Prilling), End-User Industry (Fertilizer, Chemical Processing, Metal Manufacturing, Rubber Processing, and Other End-User Industries), and Geography (Asia-Pacific, North America, Europe, South America, and Middle-East and Africa). The Market Forecasts are Provided in Terms of Volume (Metric Tons).
Geography Analysis
Asia-Pacific held 39.40% of global volume in 2025 and is pacing a 5.55% CAGR to 2031. China consumed 28.5 million metric tons, driven by phosphate fertilizer targets aligned with grain self-sufficiency goals. India's farm-support schemes and Southeast Asian plantation crops push fertilizer tonnage upward, making the region the core growth engine of the sulfur market.
North America is propelled by ULSD investments and lithium-sulfur battery plants in Nevada and Texas, placing incremental pull on regional supply, anchoring a balanced demand-supply position. Europe advances on precision farming and regulatory shifts that favor sulfur-based soil additives over synthetic chemicals. Middle East and Africa expand refinery recovery and promote agriculture programs that enlarge fertilizer use, widening geographic diversification for the sulfur market.
- ADNOC
- China Petroleum & Chemical Corporation (Sinopec)
- Flexsys America L.P.
- Gazprom International Limited
- Indian Oil Corporation Ltd
- Marathon Petroleum Corporation
- QatarEnergy LNG
- Saudi Arabian Oil Co.
- Shell plc
- Suncor Energy Inc.
- Tengizchevroil LLP
- Valero
Additional Benefits:
- The market estimate (ME) sheet in Excel format
- 3 months of analyst support
TABLE OF CONTENTS
1 Introduction
- 1.1 Study Assumptions and Market Definition
- 1.2 Scope of the Study
2 Research Methodology
3 Executive Summary
4 Market Landscape
- 4.1 Market Overview
- 4.2 Market Drivers
- 4.2.1 Rising demand from fertilizer manufacturing
- 4.2.2 Expansion of ultra-low-sulfur diesel (ULSD) refining capacity
- 4.2.3 Increasing sulfur usage in rubber vulcanization
- 4.2.4 Commercialization of lithium-sulfur batteries for e-mobility
- 4.2.5 Growing adoption of sulfur-modified asphalt and concrete in circular construction
- 4.3 Market Restraints
- 4.3.1 Stringent SOx-emission regulations across regions
- 4.3.2 High logistics and handling cost for molten sulfur
- 4.3.3 Declining sulfur recovery as refineries decarbonize and desulfurize less crude
- 4.4 Value Chain Analysis
- 4.5 Porter's Five Forces
- 4.5.1 Bargaining Power of Suppliers
- 4.5.2 Bargaining Power of Buyers
- 4.5.3 Threat of New Entrants
- 4.5.4 Threat of Substitutes
- 4.5.5 Degree of Competition
5 Market Size and Growth Forecasts (Volume)
- 5.1 By Form
- 5.1.1 Solid
- 5.1.2 Liquid
- 5.2 By Finishing-Process Technology
- 5.2.1 Granules
- 5.2.2 Pastilles
- 5.2.3 Prilling
- 5.3 By End-User Industry
- 5.3.1 Fertilizer
- 5.3.2 Chemical Processing
- 5.3.3 Metal Manufacturing
- 5.3.4 Rubber Processing
- 5.3.5 Other End-User Industries
- 5.4 By Geography
- 5.4.1 Asia-Pacific
- 5.4.1.1 China
- 5.4.1.2 India
- 5.4.1.3 Japan
- 5.4.1.4 South Korea
- 5.4.1.5 ASEAN Countries
- 5.4.1.6 Rest of Asia-Pacific
- 5.4.2 North America
- 5.4.2.1 United States
- 5.4.2.2 Canada
- 5.4.2.3 Mexico
- 5.4.3 Europe
- 5.4.3.1 Germany
- 5.4.3.2 United Kingdom
- 5.4.3.3 Italy
- 5.4.3.4 France
- 5.4.3.5 Russia
- 5.4.3.6 Rest of Europe
- 5.4.4 South America
- 5.4.4.1 Brazil
- 5.4.4.2 Argentina
- 5.4.4.3 Rest of South America
- 5.4.5 Middle-East and Africa
- 5.4.5.1 Saudi Arabia
- 5.4.5.2 South Africa
- 5.4.5.3 Rest of Middle-East and Africa
- 5.4.1 Asia-Pacific
6 Competitive Landscape
- 6.1 Market Concentration
- 6.2 Strategic Moves
- 6.3 Market Share (%)/Ranking Analysis
- 6.4 Company Profiles {(includes Global level Overview, Market level overview, Core Segments, Financials as available, Strategic Information, Market Rank/Share for key companies, Products and Services, and Recent Developments)}
- 6.4.1 ADNOC
- 6.4.2 China Petroleum & Chemical Corporation (Sinopec)
- 6.4.3 Flexsys America L.P.
- 6.4.4 Gazprom International Limited
- 6.4.5 Indian Oil Corporation Ltd
- 6.4.6 Marathon Petroleum Corporation
- 6.4.7 QatarEnergy LNG
- 6.4.8 Saudi Arabian Oil Co.
- 6.4.9 Shell plc
- 6.4.10 Suncor Energy Inc.
- 6.4.11 Tengizchevroil LLP
- 6.4.12 Valero
7 Market Opportunities and Future Outlook
- 7.1 White-space and unmet-need assessment
 硫化染料市場規模、佔有率和成長分析:按類型、形態、應用、纖維類型、加工方法、最終用戶和地區分類-2026-2033年產業預測
 硫磺市場規模、佔有率和成長分析:依產品類型、形態、應用、最終用途產業、原料、通路和地區分類-2026-2033年產業預測
 硫磺市場規模、佔有率和成長分析:按形態、原料、應用、終端用戶產業和地區分類-2026-2033年產業預測
 硫磺膨潤土市場規模、佔有率和成長分析:依產品類型、最終用途、最終用途產業和地區分類-2026-2033年產業預測
 硫磺市場:依形態、等級、應用和銷售管道分類-2026-2032年全球市場預測
 亞硫醯氯市場機會、成長要素、產業趨勢分析及2026-2035年預測膨潤土硫磺市場:依等級、形態、通路和最終用途分類-2026-2032年全球市場預測硫磺粉市場:2026-2032年全球市場預測(依口味、配方、包裝及通路分類)
 東協硫磺市場:市場佔有率分析、產業趨勢與統計、成長預測(2026-2031)
 硫磺市場規模、佔有率、成長及全球產業分析:按類型、應用和地區分類,並預測至2026-2034年