


 |
市場調查報告書
商品編碼
1939070
生物基聚乳酸(PLA):市場佔有率分析、產業趨勢與統計、成長預測(2026-2031)Bio-polylactic Acid (PLA) - Market Share Analysis, Industry Trends & Statistics, Growth Forecasts (2026 - 2031) |
||||||
※ 本網頁內容可能與最新版本有所差異。詳細情況請與我們聯繫。
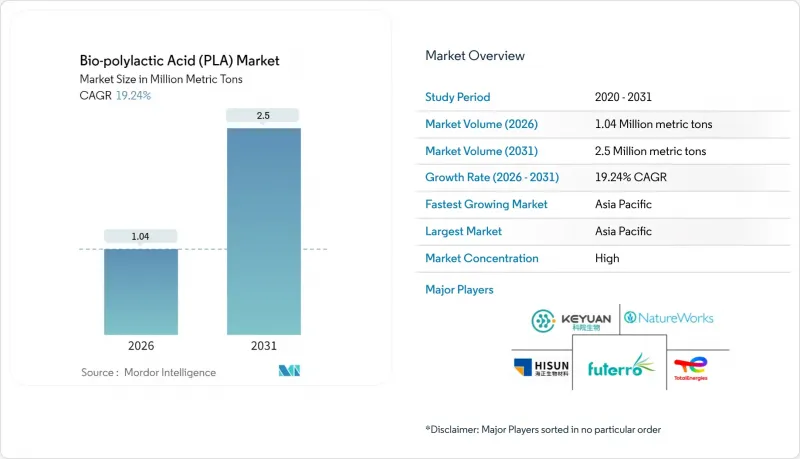
預計到 2025 年,生物基聚乳酸 (PLA) 市場價值將達到 87 萬噸,並在預測期(2026-2031 年)內以 19.24% 的複合年成長率成長,從 2026 年的 104 萬噸成長到 2031 年的 250 萬噸。
對一次性塑膠的強力監管壓力、亞洲產能擴張帶來的成本快速下降,以及突破性酵素回收技術的開發,已將生物基聚乳酸市場從利基市場轉變為主流材料解決方案。需求成長不再局限於硬質和軟質包裝;先進等級的聚乳酸正被應用於高溫汽車內部裝潢建材、醫療設備、3D列印電子產品等領域,其性能達到甚至超越了石油基聚合物的標準。與玉米相比,甘蔗和甜菜具有更低的碳排放強度和更穩定的價格,在原料替代方面發揮主導作用。同時,亞太地區的生產基地在地域上獲得了成本優勢,並成為全球競爭力的基石。競爭格局瞬息萬變,老牌製造商正在靠近原料產地的地方擴建世界級工廠,而新參與企業則利用其專有的解聚酶技術,在歐洲、北美和日本贏得以永續性的合約。
全球生物基聚乳酸(PLA)市場趨勢及展望
政府對一次性塑膠製品的監管推動了市場發展。
一系列法規正在加速對生物基聚乳酸(PLA)的需求,其中許多產品必須具備經認證的可堆肥性。加州AB 1201法案(將於2026年生效)將可堆肥標籤的材料限定為符合美國農業部國家有機計劃(USDA National Organic Program)標準的材料,從而有效地將不符合標準的生質塑膠,從而開闢機構通路,帶來相當於數十萬噸的額外需求。南澳大利亞州將於2025年禁止使用未經認證的可生物分解標籤,這將進一步加強合規框架,並將採購規格轉向高純度PLA等級。
中國不斷擴大的生產能力將重塑全球成本結構。
亞太地區生物基聚乳酸市場正經歷關鍵的成本削減階段。 NatureWorks公司在泰國獲得了3.5億美元的投資,用於建造一座年產7.5萬噸的甘蔗基聚乳酸工廠,這表明要實現全球競爭力,企業需要投入大量資金。阿拉伯聯合大公國生物技術公司(Emirates Biotech)正在阿拉伯聯合大公國建設一座大型工廠,計劃於2028年投產,該工廠採用了蘇爾壽(Sulzer)的技術,這將進一步擴大其在亞太和中東地區的業務。印度領先的糖業公司巴爾拉姆普爾·奇尼糖廠(Balrampur Cheeni Mills)正在投資200億印度盧比建設一條年產7.5萬噸的聚乳酸生產線,這充分體現了企業在保持本地原料優勢的同時,實現業務原料,擺脫對中國市場的依賴。大型工廠專注於生產大宗商品級聚乳酸,而一些專注於特定領域的製造商則透過開發特種合金和獲得低碳認證來維持其高定價策略。
工業堆肥基礎設施的缺乏限制了市場可行性。
在模擬堆肥條件下,測試的五種硬質PLA產品中只有四種實現了完全分解,部分樣品中檢測到了微塑膠碎片,顯示其在非最佳堆肥環境下的性能較差。美國廢棄物管理負責人指出,將可堆肥和不可堆肥材料分開在經濟和營運上都不切實際,導致大量廢棄物最終被送往掩埋,而不管消費者的意願如何。美國國家有機計畫(NOP)目前認定,市售可生物分解地膜不符合生物基和可生物分解的要求,這使得PLA無法進入盈利的農業領域。在拉丁美洲、南亞和非洲,基礎設施短缺問題更為突出,這些地區只有不到5%的都市固態廢棄物經過受控堆肥處理。在挨家挨戶收集系統普及之前,生物分解性的說法可能難以引起政策制定者和消費者的重視,並可能不時減緩生物基PLA市場的普及速度。
細分市場分析
截至2025年,甘蔗和甜菜將佔生物基聚乳酸市場62.10%的佔有率,年複合成長率達19.93%,顯示原料採購結構將有顯著變化。與玉米基原料相比,甘蔗發酵產生的二氧化碳排放更低,因為熱帶地區的甘蔗種植最大限度地減少了化學肥料和灌溉的使用。 Total Energies Corbion位於羅勇府的工廠使用當地採購的甘蔗糖蜜,與進口玉米澱粉相比,物流排放減少了15%。該工廠已獲得ISCC PLUS認證,並因此獲得了歐洲生態標章。巴西和泰國的生產商計劃引進利用甘蔗渣(甘蔗廢料)的汽電共生,推動生命週期分析朝向淨負排放的方向發展。
玉米在北美仍然是一種重要的農作物,當地現有的濕式製糖產能和成熟的酵素供應鏈降低了將現有工廠改造為聚乳酸(PLA)生產廠的資本門檻。木薯是一種極具吸引力的非食品原料,在越南、印尼和奈及利亞等國均有豐富的產量。木薯澱粉含量高,農業投入適中,若當地具備乾燥設施,可作為低成本的乳酸生產途徑。研究表明,在年產10萬噸的工廠中,使用糖蜜作為原料可降低37%的營業成本,這使其成為垂直整合的糖業集團極具吸引力的多元化選擇。
生物基聚乳酸報告按原料(玉米、木薯、甘蔗/甜菜、其他原料)、形態(纖維、薄膜/片材、塗層、其他形態)、終端用戶產業(包裝、醫療、電子、農業、其他)和地區(亞太地區、北美、歐洲、南美、中東和非洲)進行細分。市場預測以噸為單位。
區域分析
到2025年,亞太地區將佔據生物基聚乳酸市場40.50%的佔有率,複合年成長率達22.14%,顯示該地區既是最大的消費市場,也是成本最低的生產市場。泰國投資促進委員會針對生質塑膠的稅收優惠政策已將計劃投資回收期縮短至六年,這鼓勵了NatureWorks和該地區的主要糖業公司擴大生產線。在中國,為了實現2025年的塑膠污染控制目標,國內包裝品牌正以聚乳酸(PLA)取代EPS翻蓋式容器,這在出口成長的同時也提振了國內需求。印度大力推廣乙醇摻混,導致部分甘蔗生產轉向PLA,而一些綜合糖廠正在發酵糖蜜生產乳酸,作為PLA的原料,這既創造了附加價值,也穩定了收入來源。
儘管北美受益於明確的監管推動,例如聯邦採購的逐步淘汰和加州的可堆肥標籤強制令,但除主要沿海大都會圈外,工業堆肥基礎設施仍然不足。中西部地區較低的掩埋費抑制了商業堆肥企業的擴張,限制了生物基PLA的市場滲透,儘管品牌所有者對此表現出濃厚的興趣。 PLA生產商與廢棄物收集商合作,在西雅圖和奧斯汀建立專用收集路線,為建構循環經濟模式提供了一個可擴展的藍圖。
歐洲在閉合迴路計畫方面持續保持主導,ENZYCLE計劃透過一座年產2,000噸的解聚工廠證明了其技術可行性。歐盟嚴格的包裝課稅制度鼓勵品牌所有者採用生物基和可再生材料,使其價格高於化石基替代品。南美洲和中東/非洲地區正在湧現新的機會:巴西的糖過剩恰好滿足了聚乳酸(PLA)的經濟效益,而阿拉伯聯合大公國的一家大型工廠將為尋求清真認證食品低碳包裝的區域加工商提供服務。然而,國內有機垃圾收集系統的限制限制了消費者堆肥的益處,也減緩了全循環利用的普及。
其他福利:
- Excel格式的市場預測(ME)表
- 3個月的分析師支持
目錄
第1章 引言
- 研究假設和市場定義
- 調查範圍
第2章調查方法
第3章執行摘要
第4章 市場情勢
- 市場概覽
- 市場促進因素
- 政府對一次性塑膠製品進行限制,並強制要求使用可堆肥包裝。
- 中國產能的快速成長降低了PLA的生產成本。
- 電子商務食材自煮包的蓬勃發展推動了對可堆肥薄膜的需求。
- 歐盟和日本正在興起閉合迴路PLA回收試點項目
- 耐熱PLA在汽車內裝複合材料的應用
- 市場限制
- 飼料玉米價格波動對PLA經濟效益的影響
- 大多數地區缺乏工業堆肥能力
- 由於酵素法PLA解聚技術的智慧財產權集中,成本上升。
- 價值鏈分析
- 波特五力模型
- 供應商的議價能力
- 買方的議價能力
- 新進入者的威脅
- 替代品的威脅
- 競爭程度
第5章 市場規模與成長預測
- 按原料
- 玉米
- 木薯
- 甘蔗和甜菜
- 其他成分
- 按形式
- 纖維
- 薄膜和片材
- 塗層
- 其他形式
- 按最終用戶行業分類
- 包裝
- 醫療保健
- 電子設備
- 農業
- 紡織品
- 其他終端用戶產業
- 按地區
- 亞太地區
- 中國
- 印度
- 日本
- 韓國
- 亞太其他地區
- 北美洲
- 美國
- 加拿大
- 墨西哥
- 歐洲
- 德國
- 英國
- 義大利
- 法國
- 比荷盧經濟聯盟
- 奧地利
- 捷克共和國和斯洛伐克
- 波蘭
- 匈牙利
- 瑞士
- 北歐國家
- 其他歐洲地區
- 南美洲
- 巴西
- 阿根廷
- 其他南美洲
- 中東和非洲
- 沙烏地阿拉伯
- 南非
- 其他中東和非洲地區
- 亞太地區
第6章 競爭情勢
- 市場集中度
- 策略趨勢
- 市佔率(%)/排名分析
- 公司簡介
- Balrampur Chini Mills Limited
- BASF
- BEWi
- COFCO
- Danimer Scientific
- Evonik Industries AG
- Futerro
- Jiangxi Keyuan Bio-Material Co. Ltd
- Mitsubishi Chemical Group Corporation
- Musashino Chemical Laboratory, Ltd.
- NatureWorks LLC
- Polysciences Inc.
- Shanghai Tong Jie Liang Biomaterials Co. Ltd
- Shenzhen Esun Industrial Co., Ltd.
- Sulzer Ltd
- TotalEnergies
- Zhejiang Hisun Biomaterials Co., Ltd.
第7章 市場機會與未來展望
The Bio-polylactic Acid (PLA) Market was valued at 0.87 Million metric tons in 2025 and estimated to grow from 1.04 Million metric tons in 2026 to reach 2.5 Million metric tons by 2031, at a CAGR of 19.24% during the forecast period (2026-2031).
Strong legislative pressure on single-use plastics, rapid cost deflation from Asian capacity additions, and breakthrough enzymatic recycling technologies have moved the Bio-polylactic Acid market from a niche to a mainstream materials solution. Demand growth is no longer confined to rigid and flexible packaging, as high-heat automotive interiors, medical devices, and 3D-printed electronics adopt advanced grades that match or exceed petro-polymer performance benchmarks. Sugarcane and sugar beet feedstocks lead raw-material substitution on the back of lower carbon intensity and more stable pricing compared with corn, while geographically the Asia-Pacific production base secures the cost leadership that underpins global competitiveness. Competitive dynamics remain fluid: incumbent producers scale world-class plants close to feedstock sources, and new entrants leverage proprietary depolymerization enzymes to win sustainability-driven contracts in Europe, North America, and Japan.
Global Bio-polylactic Acid (PLA) Market Trends and Insights
Government Bans on Single-Use Plastics Drive Regulatory Momentum
A cascade of regulations accelerates the Bio-polylactic Acid market demand by making certified compostability a legal requirement for numerous products. California's AB 1201, effective in 2026, restricts compostable labels to materials that meet USDA National Organic Program standards, effectively removing subpar bioplastics from the shelf. New South Wales' enforcement of extensive single-use restrictions from 2025 prompts rapid substitution toward PLA certified to Australian standards. The White House Plastic Strategy, announced in 2024, eliminates federal procurement of single-use plastics by 2027, opening institutional channels equivalent to several hundred thousand tons of incremental demand. South Australia's 2025 ban on non-certified compostable labels further tightens compliance frameworks and shifts purchasing specifications toward high-purity PLA grades.
Chinese Capacity Expansion Reshapes Global Cost Structure
Asia-Pacific hosts the pivotal cost-down phase of the Bio-polylactic Acid market. NatureWorks secured USD 350 million to build a 75,000-ton sugarcane-based plant in Thailand, illustrating the capital intensity required to achieve globally competitive economics. Emirates Biotech selected Sulzer technology for a UAE mega-facility that will commence operations in 2028, further enlarging the Asian and Middle-East footprint. Indian sugar player Balrampur Chini Mills is investing INR 2,000 crores in a 75,000 ton PLA line, exemplifying diversification beyond China while retaining regional feedstock advantages. As larger plants focus on commodity grades, niche producers defend premium pricing through specialty alloy development and certified low-carbon footprints.
Industrial Composting Infrastructure Gaps Constrain Market Realization
Only four out of five tested rigid PLA items achieved full disintegration under simulated composting, and some samples emitted microplastic fragments, revealing performance shortfalls when compost envelope conditions are sub-optimal. Municipal waste managers in the United States report that separating compostable from non-compostable items is financially and operationally unworkable, forcing many loads into landfills despite consumer intentions. The U.S. National Organic Program currently finds that no commercial biodegradable mulch film meets its biobased and degradation requirements, blocking PLA entry into a potentially lucrative agricultural segment. Infrastructure scarcity is even more pronounced in Latin America, South Asia, and Africa where less than 5% of municipal solid waste passes through controlled composting. Until curbside systems scale, claims of biodegradability may ring hollow for policymakers and consumers, periodically slowing the Bio-polylactic Acid market adoption curve.
Other drivers and restraints analyzed in the detailed report include:
- E-commerce Packaging Demand Accelerates Compostable Film Adoption
- Closed-Loop Recycling Technology Emerges as Competitive Differentiator
- Concentrated IP Around Enzymatic PLA Depolymerization Raises Costs
For complete list of drivers and restraints, kindly check the Table Of Contents.
Segment Analysis
Sugarcane and sugar beet supplied 62.10% of the Bio-polylactic Acid market share in 2025, rising on a 19.93% CAGR trajectory that signals a deep realignment of raw-material sourcing. Sugarcane fermentation yields lower process CO2 than corn variants because crop cultivation requires minimal fertilizer and irrigation inputs in tropical geographies. TotalEnergies Corbion's Rayong line leverages local cane syrup, trimming logistics emissions by 15% compared with imported corn starch and ensuring ISCC PLUS certification that unlocks European eco-label access. Producers in Brazil and Thailand plan to integrate bagasse cogeneration to push life-cycle analysis toward net-negative profiles.
Corn retains meaningful volume in North America because existing wet-milling assets and established enzyme supply chains reduce capital barriers for brownfield PLA retrofits. Cassava obtains attention as a non-food alternative plentiful in Vietnam, Indonesia, and Nigeria; its high starch content and moderate agronomic inputs present a path to low-cost lactic acid when local drying capacity is available. Research demonstrates that molasses feedstocks can cut operating costs by 37% at 100,000-ton scale plants, giving vertically integrated sugar groups a compelling diversification option.
The Bio-Polylactic Acid Report is Segmented by Raw Material (Corn, Cassava, Sugarcane and Sugar Beet, and Other Raw Materials), Form (Fiber, Films and Sheets, Coatings, and Other Forms), End-User Industry (Packaging, Medical, Electronics, Agriculture, and More), and Geography (Asia-Pacific, North America, Europe, South America, and Middle-East and Africa). The Market Forecasts are Provided in Terms of Volume (Tons).
Geography Analysis
Asia-Pacific commanded 40.50% Bio-polylactic Acid market share in 2025, and its 22.14% CAGR underscores the region's dual role as the largest consumer and the lowest-cost producer. Thailand's policy of Board of Investment tax breaks for bioplastics cuts project payback periods to six years, encouraging NatureWorks and regional sugar conglomerates to scale new lines. China's domestic packaging brands substitute PLA for EPS clamshells to meet 2025 plastic-pollution targets, lifting local demand even as export volumes grow. India's ethanol-blending push diverts some sugarcane output, but integrated mills capture additional value by fermenting molasses into lactic acid for PLA, stabilizing revenue streams.
North America benefits from clear regulatory impetus, such as the federal procurement phase-out and California's compostability labeling, yet industrial composting infrastructure remains patchy outside coastal metros. Landfill tipping fees in the Midwest remain low, reducing economic incentives for commercial composters to expand, which tempers Bio-polylactic Acid market penetration despite strong brand owner interest. Collaboration between PLA producers and waste haulers to establish dedicated pickup routes in Seattle and Austin demonstrates scalable blueprints for circular loops.
Europe maintains leadership in closed-loop pilots, with the ENZYCLE project proving technical feasibility at 2,000 ton annual capacity depolymerization plants. Stringent EU packaging levy structures push brand owners to adopt bio-based and recyclable content, thereby supporting a price premium over fossil alternatives. South America and the Middle East and Africa present nascent opportunities: Brazil's sugar surplus aligns well with PLA economics, while the UAE mega-facility will serve regional converters seeking low-carbon packaging for halal certified foods. Absence of curbside organics collection, however, restricts consumer-side composting benefits, delaying full-cycle adoption.
- Balrampur Chini Mills Limited
- BASF
- BEWi
- COFCO
- Danimer Scientific
- Evonik Industries AG
- Futerro
- Jiangxi Keyuan Bio-Material Co. Ltd
- Mitsubishi Chemical Group Corporation
- Musashino Chemical Laboratory, Ltd.
- NatureWorks LLC
- Polysciences Inc.
- Shanghai Tong Jie Liang Biomaterials Co. Ltd
- Shenzhen Esun Industrial Co., Ltd.
- Sulzer Ltd
- TotalEnergies
- Zhejiang Hisun Biomaterials Co., Ltd.
Additional Benefits:
- The market estimate (ME) sheet in Excel format
- 3 months of analyst support
TABLE OF CONTENTS
1 Introduction
- 1.1 Study Assumptions and Market Definition
- 1.2 Scope of the Study
2 Research Methodology
3 Executive Summary
4 Market Landscape
- 4.1 Market Overview
- 4.2 Market Drivers
- 4.2.1 Government Bans on Single-Use Plastics and Compostable-Pack Mandates
- 4.2.2 Chinese Capacity Surge Lowering PLA Production Cost
- 4.2.3 E-Commerce Meal-Kit Boom Driving Demand for Compostable Films
- 4.2.4 Emerging Closed-Loop PLA Recycling Pilots in EU and Japan
- 4.2.5 High-Heat PLA Adoption in Automotive Interior Composites
- 4.3 Market Restraints
- 4.3.1 Feed-Corn Price Volatility Impacting PLA Economics
- 4.3.2 Insufficient Industrial Composting Capacity in Most Regions
- 4.3.3 Concentrated IP around Enzymatic PLA Depolymerisation Raises Costs
- 4.4 Value Chain Analysis
- 4.5 Porter's Five Forces
- 4.5.1 Bargaining Power of Suppliers
- 4.5.2 Bargaining Power of Buyers
- 4.5.3 Threat of New Entrants
- 4.5.4 Threat of Substitutes
- 4.5.5 Degree of Competition
5 Market Size and Growth Forecasts (Volume)
- 5.1 By Raw Material
- 5.1.1 Corn
- 5.1.2 Cassava
- 5.1.3 Sugarcane and Sugar Beet
- 5.1.4 Other Raw Materials
- 5.2 By Form
- 5.2.1 Fiber
- 5.2.2 Films and Sheets
- 5.2.3 Coatings
- 5.2.4 Other Forms
- 5.3 By End-user Industry
- 5.3.1 Packaging
- 5.3.2 Medical
- 5.3.3 Electronics
- 5.3.4 Agriculture
- 5.3.5 Textiles
- 5.3.6 Other End-user Industries
- 5.4 By Geography
- 5.4.1 Asia-Pacific
- 5.4.1.1 China
- 5.4.1.2 India
- 5.4.1.3 Japan
- 5.4.1.4 South Korea
- 5.4.1.5 Rest of Asia-Pacific
- 5.4.2 North America
- 5.4.2.1 United States
- 5.4.2.2 Canada
- 5.4.2.3 Mexico
- 5.4.3 Europe
- 5.4.3.1 Germany
- 5.4.3.2 United Kingdom
- 5.4.3.3 Italy
- 5.4.3.4 France
- 5.4.3.5 Benelux
- 5.4.3.6 Austria
- 5.4.3.7 Czech Republic and Slovakia
- 5.4.3.8 Poland
- 5.4.3.9 Hungary
- 5.4.3.10 Switzerland
- 5.4.3.11 Nordic
- 5.4.3.12 Rest of Europe
- 5.4.4 South America
- 5.4.4.1 Brazil
- 5.4.4.2 Argentina
- 5.4.4.3 Rest of South America
- 5.4.5 Middle-East and Africa
- 5.4.5.1 Saudi Arabia
- 5.4.5.2 South Africa
- 5.4.5.3 Rest of Middle-East and Africa
- 5.4.1 Asia-Pacific
6 Competitive Landscape
- 6.1 Market Concentration
- 6.2 Strategic Moves
- 6.3 Market Share (%)/Ranking Analysis
- 6.4 Company Profiles (includes Global level Overview, Market level overview, Core Segments, Financials as available, Strategic Information, Market Rank/Share, Products and Services, Recent Developments)
- 6.4.1 Balrampur Chini Mills Limited
- 6.4.2 BASF
- 6.4.3 BEWi
- 6.4.4 COFCO
- 6.4.5 Danimer Scientific
- 6.4.6 Evonik Industries AG
- 6.4.7 Futerro
- 6.4.8 Jiangxi Keyuan Bio-Material Co. Ltd
- 6.4.9 Mitsubishi Chemical Group Corporation
- 6.4.10 Musashino Chemical Laboratory, Ltd.
- 6.4.11 NatureWorks LLC
- 6.4.12 Polysciences Inc.
- 6.4.13 Shanghai Tong Jie Liang Biomaterials Co. Ltd
- 6.4.14 Shenzhen Esun Industrial Co., Ltd.
- 6.4.15 Sulzer Ltd
- 6.4.16 TotalEnergies
- 6.4.17 Zhejiang Hisun Biomaterials Co., Ltd.
7 Market Opportunities and Future Outlook
- 7.1 White-space and Unmet-need Assessment