


 |
市場調查報告書
商品編碼
1938990
3D地圖繪製和3D建模:市場佔有率分析、行業趨勢和統計數據、成長預測(2026-2031年)3D Mapping And 3D Modelling - Market Share Analysis, Industry Trends & Statistics, Growth Forecasts (2026 - 2031) |
||||||
※ 本網頁內容可能與最新版本有所差異。詳細情況請與我們聯繫。
2025年,3D測繪和3D建模市場價值為85.8億美元,預計到2031年將達到184.7億美元,高於2026年的97.5億美元。
預測期(2026-2031 年)的複合年成長率預計為 13.62%。
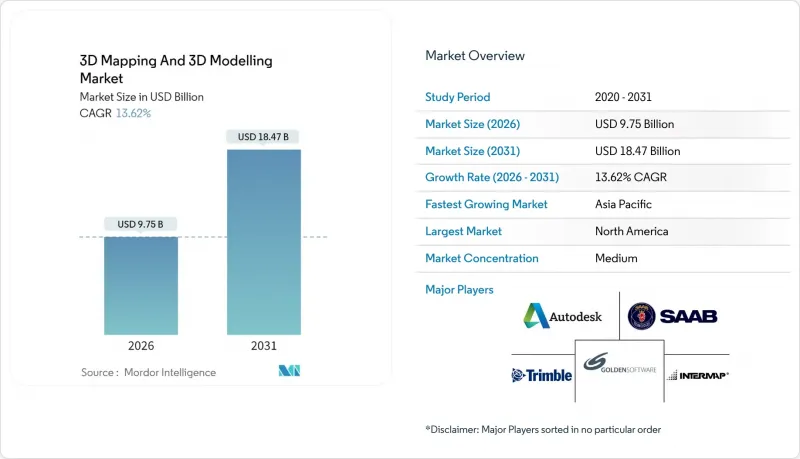
這一成長趨勢主要受以下因素驅動:智慧型手機消費級雷射雷達的普及、生成式人工智慧在設計軟體中的應用、政府對基礎設施數位雙胞胎的強制性要求,以及零售和媒體行業對延展實境(XR)內容日益成長的需求。此外,為降低中小企業整體擁有成本而大力推廣的雲端原生渲染技術,以及為自動駕駛汽車提供高清地圖的需求,將進一步擴大3D地圖和3D建模市場。隨著供應商尋求垂直整合以確保關鍵感測器和GPU的供應,同時向合作夥伴生態系統開放平台以實現規模化發展,預計市場競爭將更加激烈。
全球3D地圖繪製與3D建模市場趨勢及洞察
智慧型手機搭載的LiDAR讓即時3D採集變得大眾化
主流智慧型手機內建的LiDAR感測器消除了傳統專業空間資料收集所需的高昂成本和技術門檻。蘋果公司基於垂直腔面發射雷射(VCSEL)的飛行時間(TOF)陣列現已應用於數百萬部iPhone和iPad中,能夠產生毫米級精度的點雲,而此前這需要工業掃描儀才能實現。中小企業正在利用這些攜帶式感測器,以經濟實惠的方式進行場地掃描、房間文件記錄和身臨其境型(AR)商品展示,而無需購買測量級硬體。開發者也正在利用蘋果的ARKit實現即時遮擋處理,從而實現室內設計預覽和設施漫遊,豐富了3D地圖和3D建模市場。持續的微型化技術使得雷射雷達模組更加輕薄,而FCC和CE認證則確保了其跨區域部署的合規性。
將3D地理空間圖層整合到生成式AI設計套件中
如今,設計軟體利用3D地理空間資訊實現概念創建的自動化。 Esri 在 ArcGIS Pro 中加入了 AI 特徵提取功能,可將原始點雲轉換為語意元件,從而減少 70% 的人工分類工作。 SketchUp 的生成引擎可在數秒內產生數千個迭代式樓層平面圖,並充分考慮日照、風向和分區法規。這種 AI 輔助的工作流程非常適合尋求生態高效佈局的城市規劃師和尋求快速核准的建築師。開放的 IFC 和 ISO 19650 資料標準使得 AI 產生的概念無需返工即可直接導入 BIM 流程,從而擴展了3D測繪和3D建模市場在整個建築生命週期中的應用範圍。
GPU和感測器供應鏈的高度波動性
半導體短缺導致GPU價格飆升,前置作業時間延長至九個月以上,嚴重限制了支撐3D地圖和建模市場的即時渲染和深度學習流程。汽車LiDAR製造商也在爭相採購稀缺的VCSEL和光電二極體,迫使大型企業簽訂多年供貨契約,而小型整合商則不得不推遲計劃或接受高價。一些公司轉向雲端渲染集群來緩解硬體短缺,但這些服務也依賴數量有限的H100叢集,在等待新的晶圓代工廠產能成熟期間,系統性漏洞暴露無遺。
細分市場分析
到2025年,軟體收入將佔總收入的44.96%,這鞏固了其在自動化特徵提取、生成式建模和協作工作流程中的重要作用。服務板塊雖然規模較小,但將成為成長最快的板塊,到2031年複合年成長率將達到14.02%,這主要得益於企業傾向於將攝影測量、合規性和雲端最佳化活動外包。硬體板塊雖然佔比較小,但其成長將主要由單光子雷射雷達模組驅動,這些模組可將資料擷取速度提高五倍,同時降低維護成本。
諸如Trimble Business Center v2024.10等軟體進步使人工智慧演算法能夠將分類時間縮短60%,從而使工程師能夠專注於高價值設計,而非手動標註。隨著工作流程轉向訂閱式定價,企業按專案或設備收費,不僅便於預算控制,也拓展了3D測繪和建模市場。對服務的需求正在成長,尤其是在監管嚴格的國防和基礎設施計劃中,這些計劃往往缺乏內部攝影測量和數據管治的專業知識。硬體創新不斷推動小型化和低耗電量,為現場工作人員和緊急應變提供行動掃描環境。
到2025年,隨著娛樂工作室、產品設計師和建築師將幾何細節和視覺敘事放在首位,3D建模將佔據57.74%的市場。同時,受基礎設施數位化和自動駕駛汽車對厘米級精度需求的推動,3D測繪將實現14.78%的強勁複合年成長率。結合幾何豐富性和空間精度的數位雙胞胎孿生解決方案正在擴大計劃級3D測繪和3D建模的市場規模。
成熟的建模流程採用程式化生成技術,並利用了 Autodesk 和 Maxon 的工具集;而新興的人工智慧技術則實現了角色自動綁定和物理模擬,無需手動繪製關鍵影格。同時,供應商正在改進用於自動駕駛導航的高清道路模型,並整合了車道封閉和行人等動態物件。像 Bentley iTwin 這樣的混合平台將工程圖與紋理網格整合在一起,使資產所有者能夠在單一視窗中進行腐蝕檢測、交通流量監控和維護規劃。互通性依賴開放的 3D 切片和 CityGML 模式,這些模式可在 GIS 和 CAD 領域之間無縫交換資料。
區域分析
到2025年,北美將佔全球收入的37.14%,這主要得益於矽谷的創新、聯邦政府的基礎設施投資以及強調高精度地理空間資訊的國防合約。聯邦機構正在委託製作用於自動駕駛汽車道路網路的高精度地圖,而製造商們正在底特律和奧斯汀等地採用數位雙胞胎來提高生產效率。智慧型手機中雷射雷達技術的早期應用以及5G的快速部署將維持龐大的用戶群體,使3D地圖和3D建模市場在該地區的創新領域保持領先地位。
預計到2031年,亞太地區將實現14.12%的複合年成長率,這主要得益於大規模的都市化、對智慧工廠的投資以及政府對數位化城市規劃的強制性要求。中國3D工業相機收入預計將在2023年達到23.62億元人民幣(3.2億美元),顯示測繪供應商擁有堅實的硬體基礎。日本的精密加工出口正在採用計量級雷射雷達進行公差檢驗。印度的智慧城市計畫正在為100多個市政當局提供無人機測繪和BIM交付成果。這些多元化的需求正在匯聚,共同推動亞太地區3D測繪和3D建模市場的發展。
在歐洲,嚴格的法規要求對公共資產進行詳細的3D記錄,這有助於維持強大的市場佔有率。歐盟的數位單一市場和綠色交易策略推動了利用數位雙胞胎進行碳減排分析,促進了營業單位和交通運輸公用事業領域3D地圖和建模市場的擴張。德國的工業4.0計畫、法國的自動駕駛車道以及英國的國家數位雙胞胎都是穩定需求的根本促進因素。雖然GDPR帶來了合規負擔,但它也篩選了具備成熟資料管治能力的供應商,並鼓勵供應商在歐洲建立雲端伺服器。
其他福利:
- Excel格式的市場預測(ME)表
- 3個月的分析師支持
目錄
第1章 引言
- 研究假設和市場定義
- 調查範圍
第2章調查方法
第3章執行摘要
第4章 市場情勢
- 市場促進因素
- 利用智慧型手機搭載的LiDAR實現即時3D測量的商業化
- 產生3D地理空間圖層並將其整合到人工智慧設計套件中
- 公共基礎設施計劃強制採用數位雙胞胎技術
- XR賦能的3D內容在媒體與零售業的快速成長
- 雲端原生3D渲染技術顯著降低了中小企業的整體擁有成本。
- 自動駕駛汽車高清地圖的發展
- 市場限制
- GPU和感測器供應鏈的高度波動性
- 海量資料主權合規成本
- 攝影測量後處理技能短缺
- 碎片化的3D資料標準阻礙了互通性
- 產業生態系分析
- 監管環境
- 技術展望
- 宏觀經濟因素的影響
- 波特五力分析
- 供應商的議價能力
- 買方的議價能力
- 新進入者的威脅
- 替代品的威脅
- 競爭對手之間的競爭
第5章 市場規模與成長預測
- 按組件
- 硬體
- 軟體
- 服務
- 按類型
- 3D地圖
- 3D建模
- 透過使用
- 投影映射
- 紋理映射
- 地圖和導航
- 3D渲染和視覺化以及其他用途
- 按最終用戶行業分類
- 娛樂與媒體
- 衛生保健
- 建築/施工
- 汽車和運輸設備
- 國防、安全及其他終端用戶產業
- 透過部署
- 本地部署
- 雲
- 按地區
- 北美洲
- 美國
- 加拿大
- 墨西哥
- 南美洲
- 巴西
- 阿根廷
- 智利
- 哥倫比亞
- 歐洲
- 德國
- 法國
- 英國
- 義大利
- 西班牙
- 俄羅斯
- 亞太地區
- 中國
- 日本
- 印度
- 韓國
- 澳洲
- 紐西蘭
- 印尼
- 中東
- 沙烏地阿拉伯
- 阿拉伯聯合大公國
- 土耳其
- 以色列
- 卡達
- 非洲
- 南非
- 奈及利亞
- 肯亞
- 埃及
- 摩洛哥
- 北美洲
第6章 競爭情勢
- 策略趨勢
- 市佔率分析
- 公司簡介
- Autodesk Inc.
- Bentley Systems Inc.
- ESRI Inc.
- Trimble Inc.
- Hexagon AB
- Saab AB
- Airbus Defence and Space SAS
- Intermap Technologies Corp.
- Topcon Positioning Systems Inc.
- CyberCity 3D Inc.
- The Foundry Visionmongers Ltd.
- Golden Software LLC
- Pix4D SA
- Maxon Computer GmbH
- Dassault Systemes SE
- Pixologic Inc.
- Matterport Inc.
- FARO Technologies Inc.
- Leica Geosystems AG
- Apple Inc.(ARKit and LiDAR)
第7章 市場機會與未來展望
The 3D mapping and 3D modelling market was valued at USD 8.58 billion in 2025 and estimated to grow from USD 9.75 billion in 2026 to reach USD 18.47 billion by 2031, at a CAGR of 13.62% during the forecast period (2026-2031).
This growth trajectory stems from consumer-grade LiDAR in smartphones, generative AI integration into design software, government mandates for infrastructure digital twins, and rising demand for XR-ready content across retail and media. Cloud-native rendering that lowers total cost of ownership for small enterprises and the push for high-definition maps for autonomous vehicles further expand the 3D mapping and 3D modelling market. Competitive intensity increases as vendors pursue vertical integration to secure key sensors and GPUs while simultaneously opening platforms to partner ecosystems for scale.
Global 3D Mapping And 3D Modelling Market Trends and Insights
Smartphone LiDAR Commoditises Real-Time 3D Capture
LiDAR sensors embedded in mainstream smartphones remove the traditional cost and skills barriers associated with professional spatial data collection. Apple's VCSEL-based time-of-flight array now sits inside millions of iPhones and iPads, producing millimeter-grade point clouds that once required industrial scanners. Small businesses exploit these hand-held sensors to offer affordable site scans, interior documentation, and immersive AR merchandising without capital outlays for survey-grade hardware. Developers further harness Apple's ARKit to secure real-time occlusion handling, enabling interior design previews and facility walkthroughs that enrich the 3D mapping and 3D modelling market. Continuous miniaturization keeps LiDAR modules thin, while FCC and CE certifications guarantee cross-region deployment compliance.
Integration of 3D Geospatial Layers into Generative-AI Design Suites
Design software now feeds on 3D geospatial context to automate concept creation. Esri has added AI feature extraction inside ArcGIS Pro, turning raw point clouds into semantic building blocks and cutting manual classification by 70%. SketchUp's generative engine then iterates thousands of floor plans that respect solar exposure, wind flow, and zoning rules in seconds. Such AI-assisted workflows suit urban planners pressed for eco-efficient layouts and architects chasing faster approvals. Open IFC and ISO 19650 data standards move these AI-generated concepts into BIM pipelines without rework, amplifying the 3D mapping and 3D modelling market applicability across construction lifecycles.
High GPU and Sensor Supply-Chain Volatility
Semiconductor shortages send GPU prices soaring and extend lead times beyond 9 months, throttling real-time rendering and deep-learning pipelines that underpin the 3D mapping and 3D modelling market. Automotive LiDAR makers also compete for scarce VCSELs and photodiodes, prompting larger firms to lock multi-year supply deals and forcing small integrators to delay projects or pay premiums. Some enterprises pivot to cloud render farms to cushion hardware gaps, yet those services equally rely on limited H100 clusters, highlighting systemic vulnerability until new foundry capacity matures.
Other drivers and restraints analyzed in the detailed report include:
- Mandates for Digital Twins in Public Infrastructure Projects
- XR-Ready 3D Content Boom in Media and Retail
- Large-File Data-Sovereignty Compliance Costs
For complete list of drivers and restraints, kindly check the Table Of Contents.
Segment Analysis
Software generated 44.96% of overall revenue in 2025, underscoring its role in automating feature extraction, generative modeling, and collaborative workflows. Services, while smaller, is the fastest-growing component with a 14.02% CAGR to 2031 as enterprises outsource photogrammetry, regulatory compliance, and cloud optimization tasks. Hardware retains a leaner slice but benefits from single-photon LiDAR modules that quintuple data-capture speed while cutting maintenance.
Ongoing software advances such as Trimble Business Center v2024.10 slash classification time by 60% through AI algorithms, enabling engineers to focus on higher-value design rather than manual labeling. As workflows migrate to subscription bundles, organizations pay per-project or per-device, smoothing budgets and expanding the 3D mapping and 3D modelling market. Services demand rises where in-house teams lack photogrammetry or data-governance expertise, especially in regulated defense and infrastructure projects. Hardware innovation ensures continuous miniaturization and lower power draw, which unlocks mobile scanning scenarios for field crews and first responders.
3D modelling captured 57.74% share in 2025 as entertainment studios, product designers, and architects prioritized geometric detail and visual storytelling. In contrast, 3D mapping posts the superior 14.78% CAGR owing to infrastructure digitization and autonomous vehicle needs that demand centimeter-level accuracy. The convergence of both streams into digital twin solutions blends geometric richness with spatial exactness, amplifying the 3D mapping and 3D modelling market size at project level.
Mature modelling pipelines leverage Autodesk and Maxon toolsets for procedural generation, while emerging AI features auto-rig characters and simulate physics without manual keyframes. Conversely, mapping vendors refine HD-grade road models for autonomous navigation, supporting dynamic objects such as lane closures or pedestrians. Hybrid platforms such as Bentley iTwin combine engineering schematics with textured meshes, allowing asset owners to inspect corrosion, monitor traffic flow, and schedule maintenance in one viewport. Interoperability depends on open 3D Tiles and CityGML schemas that shuttle data between GIS and CAD domains seamlessly.
The 3D Mapping and 3D Modelling Market Report is Segmented by Component (Hardware, Software, and Services), Type (3D Mapping, and 3D Modelling), Application (Projection Mapping, Texture Mapping, Maps and Navigation, and More), End-User Vertical (Entertainment and Media, Healthcare, Automotive and Transportation, and More), Deployment (On-Premise, and Cloud), and Geography. The Market Forecasts are Provided in Terms of Value (USD).
Geography Analysis
North America held 37.14% of global revenue in 2025, buoyed by Silicon Valley innovation, federal infrastructure spending, and defense contracts that value high-precision geospatial intelligence. Federal agencies commission HD maps for autonomous vehicle corridors, while manufacturers adopt digital twins to streamline production in Detroit and Austin. Early consumer adoption of smartphone LiDAR and fast 5G rollout sustain a receptive user base, keeping the 3D mapping and 3D modelling market at the forefront of innovation in the region.
Asia Pacific is forecast to attain a 14.12% CAGR through 2031, propelled by massive urbanization, smart-factory investments, and government mandates for digital city planning. China's 3D industrial camera revenue climbed to CNY 2.362 billion (USD 0.32 billion) in 2023, signaling strong hardware foundations for mapping suppliers. Japan's precision machining exports adopt metrology-grade LiDAR to verify tolerances, and India's Smart Cities Mission packages drone surveys and BIM deliverables for 100+ municipalities. These multiple demand streams collectively uplift the 3D mapping and 3D modelling market in Asia Pacific.
Europe maintains robust share owing to strict regulations that compel detailed 3D documentation of public assets. The EU's Digital Single Market and Green Deal strategies encourage carbon-reduction analytics on digital twins, expanding the 3D mapping and 3D modelling market among energy utilities and transport operators. Germany's Industry 4.0 initiatives, France's autonomous-vehicle lanes, and the United Kingdom's national digital twin all scaffold consistent demand. GDPR, though a compliance burden, also differentiates providers with proven data-governance capabilities, steering contracts toward vendors with European cloud regions.
- Autodesk Inc.
- Bentley Systems Inc.
- ESRI Inc.
- Trimble Inc.
- Hexagon AB
- Saab AB
- Airbus Defence and Space SAS
- Intermap Technologies Corp.
- Topcon Positioning Systems Inc.
- CyberCity 3D Inc.
- The Foundry Visionmongers Ltd.
- Golden Software LLC
- Pix4D SA
- Maxon Computer GmbH
- Dassault Systemes SE
- Pixologic Inc.
- Matterport Inc.
- FARO Technologies Inc.
- Leica Geosystems AG
- Apple Inc. (ARKit and LiDAR)
Additional Benefits:
- The market estimate (ME) sheet in Excel format
- 3 months of analyst support
TABLE OF CONTENTS
1 INTRODUCTION
- 1.1 Study Assumptions and Market Definition
- 1.2 Scope of the Study
2 RESEARCH METHODOLOGY
3 EXECUTIVE SUMMARY
4 MARKET LANDSCAPE
- 4.1 Market Drivers
- 4.1.1 Smartphone LiDAR commoditises real-time 3D capture
- 4.1.2 Integration of 3D geospatial layers into generative-AI design suites
- 4.1.3 Mandates for digital twins in public infrastructure projects
- 4.1.4 XR-ready 3D content boom in media and retail
- 4.1.5 Cloud-native 3D rendering slashes TCO for SMEs
- 4.1.6 Growth of autonomous-vehicle HD maps
- 4.2 Market Restraints
- 4.2.1 High GPU and sensor supply-chain volatility
- 4.2.2 Large-file data-sovereignty compliance costs
- 4.2.3 Skills shortage in photogrammetry post-processing
- 4.2.4 Fragmented 3D data standards slow interoperability
- 4.3 Industry Ecosystem Analysis
- 4.3.1 Regulatory Landscape
- 4.3.2 Technological Outlook
- 4.3.3 Impact of Macroeconomic Factors
- 4.3.4 Porter's Five Forces Analysis
- 4.3.4.1 Bargaining Power of Suppliers
- 4.3.4.2 Bargaining Power of Buyers
- 4.3.4.3 Threat of New Entrants
- 4.3.4.4 Threat of Substitutes
- 4.3.4.5 Intensity of Competitive Rivalry
5 MARKET SIZE AND GROWTH FORECASTS (VALUE)
- 5.1 By Component
- 5.1.1 Hardware
- 5.1.2 Software
- 5.1.3 Services
- 5.2 By Type
- 5.2.1 3D Mapping
- 5.2.2 3D Modelling
- 5.3 By Application
- 5.3.1 Projection Mapping
- 5.3.2 Texture Mapping
- 5.3.3 Maps and Navigation
- 5.3.4 3D Rendering and Visualisation and Other Applications
- 5.4 By End-user Vertical
- 5.4.1 Entertainment and Media
- 5.4.2 Healthcare
- 5.4.3 Building and Construction
- 5.4.4 Automotive and Transportation
- 5.4.5 Defense and Security and Other nd-user Verticals
- 5.5 By Deployment
- 5.5.1 On-premise
- 5.5.2 Cloud
- 5.6 By Geography
- 5.6.1 North America
- 5.6.1.1 United States
- 5.6.1.2 Canada
- 5.6.1.3 Mexico
- 5.6.2 South America
- 5.6.2.1 Brazil
- 5.6.2.2 Argentina
- 5.6.2.3 Chile
- 5.6.2.4 Colombia
- 5.6.3 Europe
- 5.6.3.1 Germany
- 5.6.3.2 France
- 5.6.3.3 United Kingdom
- 5.6.3.4 Italy
- 5.6.3.5 Spain
- 5.6.3.6 Russia
- 5.6.4 Asia Pacific
- 5.6.4.1 China
- 5.6.4.2 Japan
- 5.6.4.3 India
- 5.6.4.4 South Korea
- 5.6.4.5 Australia
- 5.6.4.6 New Zealand
- 5.6.4.7 Indonesia
- 5.6.5 Middle East
- 5.6.5.1 Saudi Arabia
- 5.6.5.2 United Arab Emirates
- 5.6.5.3 Turkey
- 5.6.5.4 Israel
- 5.6.5.5 Qatar
- 5.6.6 Africa
- 5.6.6.1 South Africa
- 5.6.6.2 Nigeria
- 5.6.6.3 Kenya
- 5.6.6.4 Egypt
- 5.6.6.5 Morocco
- 5.6.1 North America
6 COMPETITIVE LANDSCAPE
- 6.1 Strategic Moves
- 6.2 Market Share Analysis
- 6.3 Company Profiles (includes Global level Overview, Market level overview, Core Segments, Financials as available, Strategic Information, Market Rank/Share for key companies, Products and Services, and Recent Developments)
- 6.3.1 Autodesk Inc.
- 6.3.2 Bentley Systems Inc.
- 6.3.3 ESRI Inc.
- 6.3.4 Trimble Inc.
- 6.3.5 Hexagon AB
- 6.3.6 Saab AB
- 6.3.7 Airbus Defence and Space SAS
- 6.3.8 Intermap Technologies Corp.
- 6.3.9 Topcon Positioning Systems Inc.
- 6.3.10 CyberCity 3D Inc.
- 6.3.11 The Foundry Visionmongers Ltd.
- 6.3.12 Golden Software LLC
- 6.3.13 Pix4D SA
- 6.3.14 Maxon Computer GmbH
- 6.3.15 Dassault Systemes SE
- 6.3.16 Pixologic Inc.
- 6.3.17 Matterport Inc.
- 6.3.18 FARO Technologies Inc.
- 6.3.19 Leica Geosystems AG
- 6.3.20 Apple Inc. (ARKit and LiDAR)
7 MARKET OPPORTUNITIES AND FUTURE OUTLOOK
- 7.1 White-Space and Unmet-Need Assessment
 3D地圖建模市場 - 全球產業規模、佔有率、趨勢、機會、預測:按類型、組件、應用、產業垂直領域、地區和競爭格局分類,2021-2031年
 3D地圖和建模市場:2026-2032年全球市場預測(按技術、定價模式、應用、最終用戶、部署類型和行業分類)
 2026年全球行動3D市場報告2026年全球3D地圖繪製與建模市場報告
 3D地圖繪製和建模市場規模、佔有率、趨勢和預測:按組件、應用、最終用戶行業和地區分類,2026-2034年
 遊戲領域3D地圖和建模市場規模、佔有率和成長分析:按組件、技術、部署模式、平台、應用、企業規模和地區分類 - 產業預測 2026-2033
 2026-2030年全球3D地圖繪製與建模市場
 2035年3D地圖繪製與建模市場分析及預測:按類型、產品類型、服務、技術、組件、應用、部署類型、最終用戶和功能分類
 全球3D地圖繪製與建模市場規模、佔有率、趨勢及成長分析報告(2026-2034年)全球3D建模、3D視覺化和3D資料擷取市場規模、佔有率、趨勢和成長分析報告(2026-2034年)