


 |
市場調查報告書
商品編碼
1938979
美國LED照明:市場佔有率分析、產業趨勢與統計、成長預測(2026-2031年)US LED Lighting - Market Share Analysis, Industry Trends & Statistics, Growth Forecasts (2026 - 2031) |
||||||
※ 本網頁內容可能與最新版本有所差異。詳細情況請與我們聯繫。
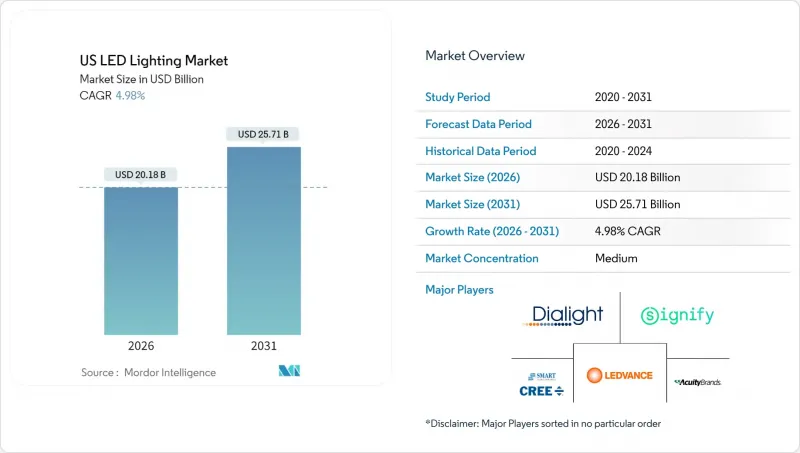
據估計,美國 LED 照明市場在 2026 年的價值將達到 201.8 億美元,高於 2025 年的 192.2 億美元,預計到 2031 年將達到 257.1 億美元。
預計從 2026 年到 2031 年,其複合年成長率將達到 4.98%。
聯邦政府將於2023年逐步淘汰白熾燈和鹵素燈,隨後加州、佛蒙特州和華盛頓州也相繼禁止使用大多數螢光管,這些措施透過創造替代需求,持續推動燈具銷量成長。市政建築規範如今更加重視可控燈具而非簡單的能源效率提升,鼓勵建築師指定使用配備感測器和連網驅動器的燈具。財富500強企業正在加速更換傳統照明設備,以達到碳排放目標,即使投資回報並不理想,他們也已將採購重點轉向已被證實有效的排放方案。同時,對加拿大和墨西哥進口產品徵收25%的關稅,以及對中國製造的零件額外附加稅10%的關稅,正在重塑市場競爭格局,促使製造商實現供應商多元化並將零件生產遷回國內。
美國LED照明市場趨勢與洞察
加速淘汰傳統照明標準
聯邦法規禁止使用光效低於每瓦45流明的燈具,促使消費者和企業轉向光效為每瓦80-100流明的LED燈。加州將於2024年生效的螢光管禁令,鼓勵辦公室和零售商店提前更換燈具,進一步鞏固了美國LED照明市場維修需求的主導地位。由於無論燈具使用年限長短,都必須遵守該規定,折舊免稅額週期脫鉤。關稅提高了進口燈具的成本,使供應鏈更短的國內製造商獲得了價格優勢。
聯邦和州政府的能源效率獎勵計劃
《通膨控制法案》撥款88億美元用於住宅能源補貼,符合資格的LED產品每戶最高可獲得200美元補貼。商業不動產所有者如果其安裝的照明系統能源效率超過標準規定的水平,則可根據第179D條規定,每平方英尺最高可扣除5美元,該條款有利於聯網照明設備。加州第24號法規2025年版強制要求採用日間行車燈採集和先進控制技術,從而加速推廣內建感測器和無線驅動器的照明設備。
重要基板供應鏈的波動
2025年3月生效的關稅政策將加拿大和墨西哥的進口關稅提高至25%,動搖了跨國加工經濟的根基。同時,中國製造的LED驅動器關稅也提高至20%,導致美國組裝的零件成本上升10%至15%。目前,各公司正競相尋找越南和印度的合格供應商,但通常需要18個月的搬遷週期,這使得它們極易受到價格波動和庫存短缺的影響。
細分市場分析
到2025年,燈具類產品將佔據美國LED照明市場62.95%的主導佔有率,因為建築師和工程師會指定使用內建感測器的燈具來偵測人員活動並符合日光法規。整合系統簡化了試運行和保固流程,因此燈具類產品的成長將保持穩定。同時,由於白熾燈和螢光被禁用,燈具類產品滿足了市場即時需求,其複合年成長率將更高,達到6.72%。由於美國LED照明市場主要由維修需求主導,儘管平均售價有所下降,但燈具的銷售量依然強勁。
隨著建築業主對詳細能耗數據的需求日益成長,板載晶片陣列和無線控制模組的創新使照明燈具更有價值。燈具供應商正瞄準學校和醫療機構,透過通用調光相容性和抗衝擊塗層來捍衛市場佔有率。在這兩個細分市場中,隨著能源效率提升空間逐漸縮小,以及園藝照明和人性化的照明等特殊領域的應用日益廣泛,預計美國LED照明市場規模將持續成長。
到2025年,批發和零售將佔銷售額的54.85%,但隨著承包商採用直接出貨模式,電子商務將以5.21%的複合年成長率成長。這種轉變在住宅DIY市場和小規模商業設施中最為顯著,因為標準化SKU非常適合規模較小的經銷網路。對於需要光度設計和申請補助金的大型計劃而言,直接銷售仍然很重要,但日常維護庫存的訂購擴大透過入口網站完成。擁有強大的線上配置工具和即時庫存數據的製造商將在美國LED照明市場佔據更大的佔有率。
傳統經銷商正透過提供打包服務來應對這項挑戰,例如設計協助、補貼申請協助和現場啟動服務。一些經銷商也收購了負責資產帳簿管理和預測性維護的軟體公司,以建立結合實體價值和數位價值的混合提案。隨著關稅成本的波動,線上平台透過提供透明的價格來影響消費者的購買行為,而對於複雜的安裝項目而言,現場服務仍然是首要考慮因素。
其他福利:
- Excel格式的市場預測(ME)表
- 分析師支持(3個月)
目錄
第1章 引言
- 研究假設和市場定義
- 調查範圍
第2章調查方法
第3章執行摘要
第4章 市場情勢
- 市場概覽
- 市場促進因素
- 加速淘汰傳統照明標準
- 聯邦和州節能獎勵計劃
- LED價格下降和發光效率提高
- 公司必須進行以ESG主導維修
- 微型LED試生產的技術進展
- 地方政府層級應制定更嚴格的建築能源標準
- 市場限制
- 關鍵基板供應鏈波動性
- 特殊用途的初始成本較高
- 中國製造的LED組件關稅存在不確定性
- 對過度照明的擔憂促成了「暗夜星空」條例的訂定
- 產業價值鏈分析
- 宏觀經濟因素的影響
- 監管環境
- 技術展望
- 波特五力分析
- 新進入者的威脅
- 供應商的議價能力
- 買方的議價能力
- 替代品的威脅
- 競爭對手之間的競爭
第5章 市場規模與成長預測
- 依產品類型
- 燈
- 照明燈具/照明設備
- 透過分銷管道
- 直銷
- 批發和零售
- 電子商務
- 按安裝類型
- 新安裝
- 維修和安裝
- 透過使用
- 商業辦公
- 零售店
- 飯店業
- 工業的
- 高速公路/普通道路
- 大樓
- 公共設施
- 醫院
- 園藝和花園
- 住宅
- 車
- 其他(化工、石油天然氣、農業)
- 最終用戶
- 室內的
- 戶外
- 車
第6章 競爭情勢
- 市場集中度
- 策略趨勢
- 市佔率分析
- 公司簡介
- Acuity Brands Lighting Inc.
- Signify North America Corp.
- Cree LED Inc.
- GE Current, a Daintree company
- Hubbell Lighting Inc.
- Cooper Lighting Solutions LLC
- LSI Industries Inc.
- RAB Lighting Inc.
- MaxLite Inc.
- LEDVANCE LLC
- Revolution Lighting Technologies Inc.
- Dialight PLC(US operations)
- Orion Energy Systems Inc.
- Energy Focus Inc.
- Musco Sports Lighting LLC
- Lithonia Lighting(Acuity Brands)
- NICOR Inc.
- Gillux Lighting LLC
- Lighting Science Group Corp.
- Growlite(Barron Lighting Group)
- Albeo Technologies Inc.
- Flex Lighting Solutions Inc.
- Sunoptics(Signify)
- Nora Lighting LLC
第7章 市場機會與未來展望
The United States LED lighting market size in 2026 is estimated at USD 20.18 billion, growing from 2025 value of USD 19.22 billion with 2031 projections showing USD 25.71 billion, growing at 4.98% CAGR over 2026-2031.
Federal rules that eliminated incandescent and halogen lamps in 2023, followed by bans on most fluorescent tubes in California, Vermont, and Washington, created replacement demand that continues to lift unit volumes. Municipal building codes now give more credit for controllable fixtures than for bare efficacy gains, pushing architects to specify luminaires that include sensors and networked drivers. Fortune 500 companies are increasingly replacing legacy lighting to meet their carbon targets, even when payback calculations are unfavorable, redirecting procurement priorities toward verified emission reductions. At the same time, tariffs of 25% on Canadian and Mexican imports, along with an additional 10% surcharge on Chinese sub-components, are nudging manufacturers to diversify their suppliers or reshore sub-assembly, reshaping the competitive landscape.
US LED Lighting Market Trends and Insights
Accelerated Phase-Out of Legacy Lighting Standards
Federal rules that prohibit lamps delivering fewer than 45 lumens per watt have prompted consumers and businesses to shift toward LEDs that deliver 80-100 lumens per watt. California's fluorescent tube ban, effective in 2024, triggered early replacements in offices and retail spaces, reinforcing the dominance of retrofitting in the United States' LED lighting market. Because compliance is mandatory regardless of fixture age, the rule decouples upgrade timing from depreciation schedules. Domestic producers with shorter supply lines gained price leverage as tariffs inflated the costs of imported lamps.
Federal and State Incentive Programs for Energy Efficiency
The Inflation Reduction Act allocates USD 8.8 billion for Home Energy Rebates, which include up to USD 200 per household for qualified LED products. Commercial property owners can deduct up to USD 5.00 per square foot under Section 179D when installed systems surpass code-mandated efficiency, a provision that favors networked luminaires. Title 24 2025 in California will require daylight harvesting and advanced controls, accelerating the uptake of fixtures that ship with embedded sensors and wireless drivers.
Supply-Chain Volatility for Critical Substrates
Tariffs introduced in March 2025 raised duties on Canadian and Mexican imports to 25%, undermining cross-border maquiladora economics. Simultaneously, the surcharge on Chinese LED drivers increased to 20%, raising component costs by 10-15% for U.S. assemblers. Firms now rush to qualify suppliers in Vietnam and India, but the typical 18-month relocation timeline leaves them vulnerable to price fluctuations and inventory shortages.
Other drivers and restraints analyzed in the detailed report include:
- Corporate ESG-Driven Retrofitting Mandates
- Stricter Building-Energy Codes at Municipality Level
- Tariff Uncertainty on Chinese LED Components
For complete list of drivers and restraints, kindly check the Table Of Contents.
Segment Analysis
The luminaires category accounted for a dominant 62.95% share of the United States' LED lighting market in 2025, as architects and engineers specified fixtures with onboard sensors that meet occupancy and daylighting mandates. Growth continues steadily because integrated systems simplify commissioning and warranty. By contrast, lamps post a faster 6.72% CAGR, as they satisfy the immediate needs arising from the bans on incandescent and fluorescent bulbs. The retrofit-heavy nature of the United States LED lighting market keeps lamp volumes buoyant even though average selling prices trend downward.
Innovation in chip-on-board arrays and wireless control modules positions luminaires to capture incremental value as building owners seek granular energy data. Lamp vendors defend their market share through universal dimming compatibility and shatter-resistant coatings, targeting schools and healthcare facilities. Across both sub-segments, the United States LED lighting market size will expand as efficacy gains become increasingly thin, but adoption widens in specialty niches such as grow lights and human-centric lighting.
Wholesale retail retained 54.85% of sales in 2025, yet e-commerce is advancing at a 5.21% CAGR as contractors embrace direct-ship models. The shift is most evident in the residential DIY and small commercial space, where standardized SKUs fit parcel networks. Direct sales remain critical for large projects that require photometric design and rebate paperwork, but web portals are increasingly handling repeat orders for maintenance stock. Manufacturers with robust online configurators and live inventory data are capturing a larger share of the United States' LED lighting market.
Traditional distributors respond by bundling design-assist, rebate administration, and on-site startup services. Some have acquired software firms that manage asset registers and predictive maintenance, creating hybrid physical-digital value propositions. As tariff costs fluctuate, online platforms provide transparent pricing, influencing buyer behavior in a market that still values local service for complex builds.
The United States LED Lighting Market Report is Segmented by Product Type (Lamps, and Luminaires/Fixtures), Distribution Channel (Direct Sales, Wholesale/Retail, and E-Commerce), Installation Type (New Installation, and Retrofit Installation), Application (Commercial Offices, Retail Stores, and More), and End User (Indoor, Outdoor, and Automotive). The Market Forecasts are Provided in Terms of Value (USD).
List of Companies Covered in this Report:
- Acuity Brands Lighting Inc.
- Signify North America Corp.
- Cree LED Inc.
- GE Current, a Daintree company
- Hubbell Lighting Inc.
- Cooper Lighting Solutions LLC
- LSI Industries Inc.
- RAB Lighting Inc.
- MaxLite Inc.
- LEDVANCE LLC
- Revolution Lighting Technologies Inc.
- Dialight PLC (U.S. operations)
- Orion Energy Systems Inc.
- Energy Focus Inc.
- Musco Sports Lighting LLC
- Lithonia Lighting (Acuity Brands)
- NICOR Inc.
- Gillux Lighting LLC
- Lighting Science Group Corp.
- Growlite (Barron Lighting Group)
- Albeo Technologies Inc.
- Flex Lighting Solutions Inc.
- Sunoptics (Signify)
- Nora Lighting LLC
Additional Benefits:
- The market estimate (ME) sheet in Excel format
- 3 months of analyst support
TABLE OF CONTENTS
1 INTRODUCTION
- 1.1 Study Assumptions and Market Definition
- 1.2 Scope of the Study
2 RESEARCH METHODOLOGY
3 EXECUTIVE SUMMARY
4 MARKET LANDSCAPE
- 4.1 Market Overview
- 4.2 Market Drivers
- 4.2.1 Accelerated phase-out of legacy lighting standards
- 4.2.2 Federal and state incentive programs for energy efficiency
- 4.2.3 Declining LED prices and higher luminous efficacy
- 4.2.4 Corporate ESG-driven retrofitting mandates
- 4.2.5 Micro-LED pilot production breakthroughs
- 4.2.6 Stricter building-energy codes at municipality level
- 4.3 Market Restraints
- 4.3.1 Supply-chain volatility for critical substrates
- 4.3.2 High upfront cost for specialty applications
- 4.3.3 Tariff uncertainty on Chinese LED components
- 4.3.4 Over-illumination concerns driving "dark-sky" ordinances
- 4.4 Industry Value Chain Analysis
- 4.5 Impact of Macroeconomic Factors
- 4.6 Regulatory Landscape
- 4.7 Technological Outlook
- 4.8 Porter's Five Forces Analysis
- 4.8.1 Threat of New Entrants
- 4.8.2 Bargaining Power of Suppliers
- 4.8.3 Bargaining Power of Buyers
- 4.8.4 Threat of Substitutes
- 4.8.5 Competitive Rivalry
5 MARKET SIZE AND GROWTH FORECASTS (VALUE)
- 5.1 By Product Type
- 5.1.1 Lamps
- 5.1.2 Luminaires / Fixtures
- 5.2 By Distribution Channel
- 5.2.1 Direct Sales
- 5.2.2 Wholesale Retail
- 5.2.3 E-commerce
- 5.3 By Installation Type
- 5.3.1 New Installation
- 5.3.2 Retrofit Installation
- 5.4 By Application
- 5.4.1 Commercial Offices
- 5.4.2 Retail Stores
- 5.4.3 Hospitality
- 5.4.4 Industrial
- 5.4.5 Highway and Roadway
- 5.4.6 Architectural
- 5.4.7 Public Places
- 5.4.8 Hospitals
- 5.4.9 Horticulture Gardens
- 5.4.10 Residential
- 5.4.11 Automotive
- 5.4.12 Others (Chemicals, Oil and Gas, Agriculture)
- 5.5 By End User
- 5.5.1 Indoor
- 5.5.2 Outdoor
- 5.5.3 Automotive
6 COMPETITIVE LANDSCAPE
- 6.1 Market Concentration
- 6.2 Strategic Moves
- 6.3 Market Share Analysis
- 6.4 Company Profiles (includes Global level Overview, Market level overview, Core Segments, Financials as available, Strategic Information, Market Rank/Share for key companies, Products and Services, and Recent Developments)
- 6.4.1 Acuity Brands Lighting Inc.
- 6.4.2 Signify North America Corp.
- 6.4.3 Cree LED Inc.
- 6.4.4 GE Current, a Daintree company
- 6.4.5 Hubbell Lighting Inc.
- 6.4.6 Cooper Lighting Solutions LLC
- 6.4.7 LSI Industries Inc.
- 6.4.8 RAB Lighting Inc.
- 6.4.9 MaxLite Inc.
- 6.4.10 LEDVANCE LLC
- 6.4.11 Revolution Lighting Technologies Inc.
- 6.4.12 Dialight PLC (U.S. operations)
- 6.4.13 Orion Energy Systems Inc.
- 6.4.14 Energy Focus Inc.
- 6.4.15 Musco Sports Lighting LLC
- 6.4.16 Lithonia Lighting (Acuity Brands)
- 6.4.17 NICOR Inc.
- 6.4.18 Gillux Lighting LLC
- 6.4.19 Lighting Science Group Corp.
- 6.4.20 Growlite (Barron Lighting Group)
- 6.4.21 Albeo Technologies Inc.
- 6.4.22 Flex Lighting Solutions Inc.
- 6.4.23 Sunoptics (Signify)
- 6.4.24 Nora Lighting LLC
7 MARKET OPPORTUNITIES AND FUTURE OUTLOOK
- 7.1 White-space and Unmet-Need Assessment
 LED 照明和 OLED 照明:市場分析和製造趨勢
 LED嵌燈市場報告:按應用和地區分類(2026-2034年)
 LED照明市場:2026-2032年全球市場預測(依產品類型、安裝方式、技術、應用、最終用戶及通路分類)相機LED照明市場:2026-2032年全球市場預測(依產品類型、照明類型、應用、最終用戶及通路分類)
 2026-2030年全球LED照明市場LED面板燈市場:按安裝方式、面板尺寸、產品類型、色溫、應用和分銷管道分類-全球預測,2026-2032年櫥櫃LED照明市場:依產品類型、安裝類型、安裝方式、應用、通路和最終用途分類-2026-2032年全球預測LED燈帶控制器市場按應用、顏色類型、控制技術、分銷管道、控制方式、安裝方式和電壓類型分類,全球預測(2026-2032年)
 軟性照明箔市場規模、佔有率和成長分析:按產品類型、材料類型、應用、最終用戶、分銷管道、地區和行業預測,2026-2033年
 LED照明市場分析及預測(至2035年):按類型、產品類型、服務、技術、組件、應用、形狀、材質、最終用戶和功能分類