


 |
市場調查報告書
商品編碼
1937313
服裝物流:市場佔有率分析、產業趨勢與統計、成長預測(2026-2031)Apparel Logistics - Market Share Analysis, Industry Trends & Statistics, Growth Forecasts (2026 - 2031) |
||||||
※ 本網頁內容可能與最新版本有所差異。詳細情況請與我們聯繫。
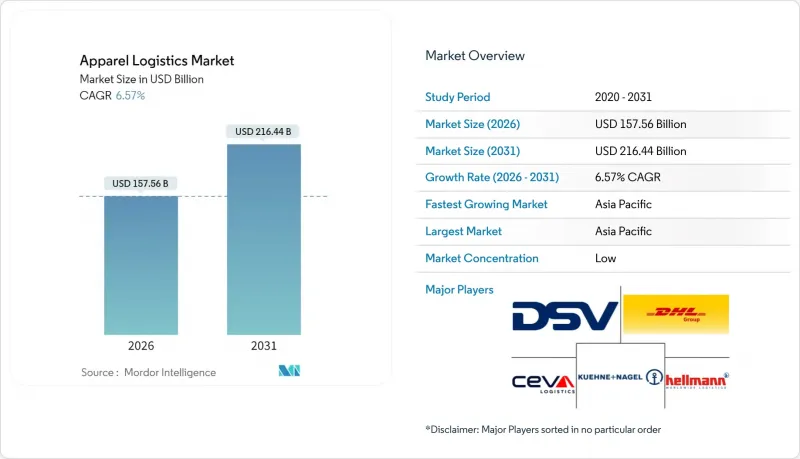
2025年服裝物流市場價值為1,478.5億美元,預計到2031年將達到2,164.4億美元,而2026年為1,575.6億美元。
預計在預測期(2026-2031 年)內,複合年成長率將達到 6.57%。
數位化、循環經濟模式和日益嚴格的環境法規正在重塑全球時尚供應鏈。電子商務的持續成長、按需配送的需求以及不斷增加的SKU數量迫使供應商投資於即時庫存視覺化工具和最後一公里最佳化。儘管亞太地區憑藉其龐大的製造業基地保持優勢,但美洲和歐洲的近岸外包正在逐步改變貿易流向。運輸服務仍然至關重要,預計到2024年將佔總收入的68%,而人工智慧驅動的預測和轉售支援等附加價值服務將成長最快,達到4.10%。為了因應美國高達20.8%的服飾退貨率,第三方物流公司正在將服務擴展到逆向物流,加劇了市場競爭。對範圍3排放的監管力道加大以及運費的波動進一步複雜化了成本結構,促使企業投資於低碳燃料和自動化技術。
全球服裝物流市場趨勢與洞察
2025年及以後:按需服飾和即時配送需求激增
在印度,快消平台預計將以每年75%至85%的速度成長,到2025會計年度,其商品交易總額(GMV)將達到60億美元。東南亞地區也呈現類似的成長動能。物流業者正在重建其最後一公里配送網路,京東物流承諾到2025年,將在數十個市場實現兩到三天的跨境配送。像By Rotation這樣的P2P租賃業者正在經營實體取貨點,以滿足當日達的需求。政府對配送車輛排放氣體的監管正在加速人口密集城市向電動貨車的轉型。隨著品牌試點微型倉配中心,即時調度軟體在實現兩小時送達方面發揮著至關重要的作用。一家整合預測分析技術的供應商在2024年的試點計畫中,將最後一公里配送成本降低了12%。
電子商務主導的SKU 激增需要先進的庫存可見性。
時尚品牌管理著數千個管道的數千個SKU,這使得傳統系統顯得過時。沃爾瑪的AI趨勢分析引擎能夠在幾週內將社交訊號轉化為採購訂單,從而減少緩衝庫存。已實施AI輔助需求計畫的零售商報告稱,存貨周轉提高了30%。庫存過剩仍然是一個重大問題,加劇了降價壓力。歐盟數位產品護照要求將在2026年之前強制執行精細化的產品追蹤,這將進一步提高資料需求。為此,第三方物流公司正在整合控制塔平台,以同步訂單、履行和退貨流程,並將自身定位為技術合作夥伴,而非貨運仲介業者。
高退貨率推高逆向物流成本
預計到2024年,美國零售退貨總額將達8,900億美元,服飾業的平均退貨率高達20.8%,倉儲成本是運輸成本的2.5倍。在英國,頻繁退貨每年造成的損失相當於86億美元。 Happy Returns的AI分類系統可將處理時間縮短70%。然而,預計到2024年,退貨詐騙將上升至15.14%,將促使RFID和電腦視覺認證技術的應用。為了最大限度地減少運輸排放和處理成本,各大品牌正在試點針對低價值商品的「保留退款制度,並積極尋求與二手零售商夥伴關係,將退貨轉化為次市場庫存。
細分市場分析
到2025年,運輸業將佔總收入的67.32%,支撐著規模達995.2億美元的服裝物流市場。道路運輸,海運負責國際散貨運輸,而空運則主要服務於高價值和時效性貨物的運輸。隨著托運人尋求減少範圍3排放,替代燃料的採用正在促使合約結構進行重組。儘管運輸業規模龐大,但由於運力波動和碳課稅的影響,其利潤率正面臨越來越大的壓力。
預計附加價值服務將以4.05%的複合年成長率(CAGR)實現最高成長,透過支持先前由品牌方自行完成的套裝組裝、貼標、維修和再銷售等業務,推動服裝物流市場的發展。像Ryder這樣的供應商現在能夠在全通路履約中心內提供包裝、拆包、縫紉和品質檢驗等服務。這些能力將物流更深入地融入品牌運營,從而提高合約續約率和獲利能力。將銷售點(POS)資料與倉庫管理系統整合,可實現需求驅動型包裝,而永續性評估模組則可提供每個小包裹的碳排放資料。
區域分析
預計到2025年,亞太地區將佔全球營收的40.58%,推動服飾物流市場規模達到599.9億美元,並預計到2031年將以5.03%的複合年成長率成長。中國、越南、孟加拉和印度將主導出口,而區域內消費支出的成長正在加強區域分銷網路。區域全面經濟夥伴協定(RCEP)下的貿易優惠以及印尼和菲律賓港口基礎設施的改善正在縮短前置作業時間。永續性法規,例如中國的“雙能目標”,正促使工廠位置靠近港口,從而改變短途運輸模式。
北美地區電子商務營運日趨成熟,自動化投資持續成長。加州內陸帝國和賓州利哈伊谷的勞動力短缺加速了機器人技術的應用,並降低了單位處理成本。墨西哥近岸外包的蓬勃發展(尤其是在巴希奧走廊沿線)正在推動跨境卡車運輸路線的重新調整,並支持雙邊物流中心。在美國,各州為推廣氫燃料卡車提供的激勵措施與聯邦工業稅額扣抵相輔相成。
在歐洲,合規是重中之重,《企業永續發展報告指令》(CSRD) 和碳邊境調節機制 (CBAM) 正推動運輸方式轉向鐵路和內河航運。東歐的第三方物流(3PL) 公司正在擴大產能,以滿足土耳其和摩洛哥日益成長的快時尚生產需求。歐盟排放交易體系下的碳定價將提高海運附加費,並促使港口倉庫提高貨櫃裝載效率。德國、法國和北歐國家電子商務的興起將促進都市區低排放區內微型倉配的發展。
其他福利:
- Excel格式的市場預測(ME)表
- 3個月的分析師支持
目錄
第1章 引言
- 研究假設和市場定義
- 調查範圍
第2章調查方法
第3章執行摘要
第4章 市場情勢
- 市場概覽
- 市場促進因素
- 從2025年起,人們對按需服裝和即時配送的期望將大幅提升。
- 電子商務SKU的激增要求對庫存有深入的了解。
- 永續性法規推動綠色物流投資
- 在美洲和歐洲擴大靠近市場的製造規模
- 利用人工智慧實現倉庫自動化,降低單位搬運成本
- 服裝租賃和二手商品交易模式的興起將推動逆向物流的發展。
- 市場限制
- 高退貨率推高逆向物流成本
- 運費波動和運力限制
- 倉儲作業高度集中的地區勞動力短缺
- 範圍 3 交通運輸排放的監管審查
- 價值/供應鏈分析
- 監管環境
- 技術展望
- 波特五力模型
- 新進入者的威脅
- 供應商的議價能力
- 買方的議價能力
- 替代品的威脅
- 競爭對手之間的競爭
- 政府法規和政策
- 亮點-電子商務對傳統服裝物流供應鏈的影響
- 逆向物流評論與說明
- 新冠疫情與地緣政治事件對市場的影響
第5章 市場規模與成長預測
- 透過服務
- 運輸
- 路
- 鐵路
- 航空
- 海事和內河航道
- 倉儲和配送服務
- 附加價值服務
- 運輸
- 依產品類型
- 衣服
- 鞋類
- 配件
- 按地區
- 北美洲
- 美國
- 加拿大
- 墨西哥
- 南美洲
- 巴西
- 秘魯
- 智利
- 阿根廷
- 南美洲其他地區
- 亞太地區
- 印度
- 中國
- 日本
- 澳洲
- 韓國
- 東南亞(新加坡、馬來西亞、泰國、印尼、越南、菲律賓)
- 亞太其他地區
- 歐洲
- 英國
- 德國
- 法國
- 西班牙
- 義大利
- 比荷盧經濟聯盟(比利時、荷蘭、盧森堡)
- 北歐國家(丹麥、芬蘭、冰島、挪威、瑞典)
- 其他歐洲
- 中東和非洲
- 阿拉伯聯合大公國
- 沙烏地阿拉伯
- 南非
- 奈及利亞
- 其他中東和非洲地區
- 北美洲
第6章 競爭情勢
- 市場集中度
- 策略趨勢
- 市佔率分析
- 公司簡介
- Ceva Logistics
- DSV
- Deutsche Post DHL Group
- Kuehne+Nagel
- Hellmann Worldwide Logistics
- Apparel Logistics Group Inc.
- PVS Fulfillment-Service GmbH
- Logwin AG
- GAC Group
- Nippon Express
- Genex Logistics
- Expeditors International of Washington Inc.
- BGROUP SRL
- FedEx Supply Chain
- GXO Logistics
- Bleckmann Logistics
- OIA Global
- XPO Logistics
- Lalamove
- JD Logistics
第7章 市場機會與未來展望
The Apparel Logistics Market was valued at USD 147.85 billion in 2025 and estimated to grow from USD 157.56 billion in 2026 to reach USD 216.44 billion by 2031, at a CAGR of 6.57% during the forecast period (2026-2031).
As digitalization, circular-economy models, and stricter environmental rules reshape global fashion supply chains. Sustained e-commerce growth, on-demand delivery expectations, and SKU proliferation are compelling providers to invest in real-time inventory visibility tools and last-mile optimization. Asia-Pacific retains supremacy owing to its extensive production base, yet nearshoring in the Americas and Europe is gradually redirecting trade flows. Transportation services remain indispensable, accounting for 68% of 2024 revenue, while value-added services such as AI-enabled forecasting and resale support are expanding fastest at 4.10%. Competitive intensity is rising as 3PLs broaden offerings into reverse logistics to counter a 20.8% apparel return rate in the United States. Regulatory scrutiny of Scope-3 emissions and volatile freight rates further complicate cost structures, spurring accelerated investment in low-carbon fuels and automation.
Global Apparel Logistics Market Trends and Insights
2025+ Surge in On-Demand Apparel and Instant Delivery Expectations
Quick-commerce platforms are set to grow 75-85% annually in India, hitting USD 6 billion GMV by FY 2025, and similar momentum is visible across Southeast Asia. Logistics providers are re-engineering last-mile networks, with JD Logistics pledging 2-3-day cross-border delivery to dozens of markets in 2025. Peer-to-peer rental players such as By Rotation now run physical pick-up points to satisfy same-day demand. Municipal rules on delivery-vehicle emissions accelerate the shift to electric vans in dense cities. As brands test micro-fulfillment centers, real-time routing software becomes decisive in meeting two-hour delivery windows. Providers integrating predictive analytics have trimmed last-mile costs by 12% during 2024 pilots.
E-Commerce-Driven SKU Proliferation Requiring Sophisticated Inventory Visibility
Fashion brands juggle thousands of SKUs across multiple channels, rendering legacy systems obsolete. Walmart's AI trend-to-product engine converts social signals into purchase orders within weeks, slashing buffer stock. Retailers deploying AI-assisted demand planning report 30% faster inventory velocity. Excess stock remains acute, magnifying markdown pressure. EU Digital Product Passport requirements mandate granular item tracking by 2026, further tightening data needs. In response, 3PLs bundle control-tower platforms that synchronize ordering, fulfillment, and returns, positioning themselves as tech partners rather than freight brokers.
High Returns Rate Inflating Reverse-Logistics Costs
US retail returns totaled USD 890 billion in 2024, with apparel averaging a 20.8% rate and carrying costs 2.5X greater than outbound fulfillment. Serial returners in the United Kingdom create USD 8.6 billion equivalent in annual costs. AI-driven sortation systems from Happy Returns reduce processing time 70%. However, return fraud climbed to 15.14% in 2024, forcing the adoption of RFID and computer-vision authentication. Brands are piloting "keep-it" refunds for low-value items to minimize transport emissions and handling overhead, while resale partnerships convert returns into secondary-market inventory.
Other drivers and restraints analyzed in the detailed report include:
- Sustainability Regulations Pushing Green Logistics Investments
- AI-Driven Warehouse Automation Lowering Per-Unit Handling Costs
- Volatile Freight Rates and Capacity Constraints
For complete list of drivers and restraints, kindly check the Table Of Contents.
Segment Analysis
Transportation generated 67.32% of 2025 revenue and anchors the apparel logistics market size at USD 99.52 billion. Road remains the backbone for intra-regional moves, while sea freight handles bulk international volumes; air retains a niche for high-value or time-critical stock. Adoption of alternative fuels is reshaping contract structures as shippers seek lower Scope-3 emissions. Despite its scale, transportation faces intensifying margin pressure from capacity volatility and carbon levies.
Value-added services posted the strongest 4.05% CAGR outlook, expanding the apparel logistics market by enabling kitting, labeling, repair, and recommerce tasks that once sat with brands. Providers like Ryder now bundle unpacking, sewing, and quality inspection within omnichannel fulfillment nodes. These functions embed logistics deeper into brand operations, driving stickier contracts and higher yields. Integration of point-of-sale data with warehouse management systems supports demand-driven packaging, while sustainability scoring modules attach carbon data to each parcel.
The Apparel Logistics Market Report is Segmented by Service (Transportation (Road, Rail, Air, Sea and Inland Waterways), Warehousing & Distribution Services, Value-Added Services), Product Type (Clothing, Footwear, Accessories), and Geography (North America, South America, Asia-Pacific, Europe, Middle East and Africa). The Market Forecasts are Provided in Terms of Value (USD).
Geography Analysis
Asia-Pacific held 40.58% of 2025 revenue and anchors the apparel logistics market size at USD 59.99 billion, rising at 5.03% CAGR through 2031. China, Vietnam, Bangladesh, and India dominate exports, yet intra-Asian consumer spending strengthens regional distribution networks. RCEP trade preferences and port infrastructure upgrades in Indonesia and the Philippines shorten lead times. Sustainability regulations, such as China's dual-control energy targets, push factories to near ports, altering drayage patterns.
North America combines mature e-commerce operations with on-going automation investments. Labor shortages in California's Inland Empire and Pennsylvania's Lehigh Valley accelerate adoption of robotics, lowering per-unit handling costs. Mexico's nearshoring boom, especially along the Bajio corridor, re-positions cross-border trucking lanes and supports bi-national distribution centers. U.S. state incentives for hydrogen trucking complement federal IRA credits.
Europe emphasizes regulatory compliance, with CSRD and CBAM guiding modal shifts toward rail and inland waterways. Eastern European 3PLs expand capacity to serve rising fast-fashion production in Turkey and Morocco. Carbon pricing in the EU Emissions Trading System raises ocean-freight surcharges, prompting more consolidation at port warehouses to optimize container loads. E-commerce penetration in Germany, France, and the Nordics supports micro-fulfillment deployment inside urban low-emission zones.
List of Companies Covered in this Report:
- Ceva Logistics
- DSV
- Deutsche Post DHL Group
- Kuehne + Nagel
- Hellmann Worldwide Logistics
- Apparel Logistics Group Inc.
- PVS Fulfillment-Service GmbH
- Logwin AG
- GAC Group
- Nippon Express
- Genex Logistics
- Expeditors International of Washington Inc.
- BGROUP SRL
- FedEx Supply Chain
- GXO Logistics
- Bleckmann Logistics
- OIA Global
- XPO Logistics
- Lalamove
- JD Logistics
Additional Benefits:
- The market estimate (ME) sheet in Excel format
- 3 months of analyst support
TABLE OF CONTENTS
1 Introduction
- 1.1 Study Assumptions and Market Definition
- 1.2 Scope of the Study
2 Research Methodology
3 Executive Summary
4 Market Landscape
- 4.1 Market Overview
- 4.2 Market Drivers
- 4.2.1 2025+ surge in on-demand apparel and instant delivery expectations
- 4.2.2 E-commerce-driven SKU proliferation requiring sophisticated inventory visibility
- 4.2.3 Sustainability regulations pushing green logistics investments
- 4.2.4 Expansion of near-market manufacturing in Americas and Europe
- 4.2.5 AI-driven warehouse automation lowering per-unit handling costs
- 4.2.6 Rise of apparel rental and recommerce models boosting reverse logistics
- 4.3 Market Restraints
- 4.3.1 High returns rate inflating reverse-logistics costs
- 4.3.2 Volatile freight rates and capacity constraints
- 4.3.3 Labor shortages in warehousing hotspots
- 4.3.4 Regulatory scrutiny of Scope-3 transport emissions
- 4.4 Value / Supply-Chain Analysis
- 4.5 Regulatory Landscape
- 4.6 Technological Outlook
- 4.7 Porter's Five Forces
- 4.7.1 Threat of New Entrants
- 4.7.2 Bargaining Power of Suppliers
- 4.7.3 Bargaining Power of Buyers
- 4.7.4 Threat of Substitutes
- 4.7.5 Competitive Rivalry
- 4.8 Government Regulations and Initiatives
- 4.9 Spotlight-Effect of E-commerce on Traditional Apparel Logistics Supply Chain
- 4.10 Review and Commentary on Reverse Logistics
- 4.11 Impact of COVID-19 and Geo-Political Events on the Market
5 Market Size and Growth Forecasts
- 5.1 By Service (Value)
- 5.1.1 Transportation
- 5.1.1.1 Road
- 5.1.1.2 Rail
- 5.1.1.3 Air
- 5.1.1.4 Sea and Inland Waterways
- 5.1.2 Warehousing and Distribution Services
- 5.1.3 Value-added Services
- 5.1.1 Transportation
- 5.2 By Product Type
- 5.2.1 Clothing
- 5.2.2 Footwear
- 5.2.3 Accessories
- 5.3 By Geography (Value)
- 5.3.1 North America
- 5.3.1.1 United States
- 5.3.1.2 Canada
- 5.3.1.3 Mexico
- 5.3.2 South America
- 5.3.2.1 Brazil
- 5.3.2.2 Peru
- 5.3.2.3 Chile
- 5.3.2.4 Argentina
- 5.3.2.5 Rest of South America
- 5.3.3 Asia-Pacific
- 5.3.3.1 India
- 5.3.3.2 China
- 5.3.3.3 Japan
- 5.3.3.4 Australia
- 5.3.3.5 South Korea
- 5.3.3.6 South East Asia (Singapore, Malaysia, Thailand, Indonesia, Vietnam, and Philippines)
- 5.3.3.7 Rest of Asia-Pacific
- 5.3.4 Europe
- 5.3.4.1 United Kingdom
- 5.3.4.2 Germany
- 5.3.4.3 France
- 5.3.4.4 Spain
- 5.3.4.5 Italy
- 5.3.4.6 BENELUX (Belgium, Netherlands, and Luxembourg)
- 5.3.4.7 NORDICS (Denmark, Finland, Iceland, Norway, and Sweden)
- 5.3.4.8 Rest of Europe
- 5.3.5 Middle East and Africa
- 5.3.5.1 United Arab of Emirates
- 5.3.5.2 Saudi Arabia
- 5.3.5.3 South Africa
- 5.3.5.4 Nigeria
- 5.3.5.5 Rest of Middle East And Africa
- 5.3.1 North America
6 Competitive Landscape
- 6.1 Market Concentration
- 6.2 Strategic Moves
- 6.3 Market Share Analysis
- 6.4 Company Profiles (includes Global Level Overview, Market Level Overview, Core Segments, Financials as available, Strategic Information, Market Rank/Share for key companies, Products and Services, and Recent Developments)
- 6.4.1 Ceva Logistics
- 6.4.2 DSV
- 6.4.3 Deutsche Post DHL Group
- 6.4.4 Kuehne + Nagel
- 6.4.5 Hellmann Worldwide Logistics
- 6.4.6 Apparel Logistics Group Inc.
- 6.4.7 PVS Fulfillment-Service GmbH
- 6.4.8 Logwin AG
- 6.4.9 GAC Group
- 6.4.10 Nippon Express
- 6.4.11 Genex Logistics
- 6.4.12 Expeditors International of Washington Inc.
- 6.4.13 BGROUP SRL
- 6.4.14 FedEx Supply Chain
- 6.4.15 GXO Logistics
- 6.4.16 Bleckmann Logistics
- 6.4.17 OIA Global
- 6.4.18 XPO Logistics
- 6.4.19 Lalamove
- 6.4.20 JD Logistics
7 Market Opportunities and Future Outlook
- 7.1 White-space and Unmet-need Assessment
 服飾物流市場:2026-2032年全球市場預測(依最終用戶產業、組織規模、服務類型及運輸方式分類)
 2026-2030年全球服飾物流市場可回收運輸包裝解決方案市場(按包裝類型、材料、所有權、供應鏈階段和最終用戶分類),全球預測,2026-2032年時尚及奢侈品物流服務市場(依服務類型、顧客類型、通路、服務模式及運輸方式分類)-2026-2032年全球預測
 美國服裝物流:市場佔有率分析、產業趨勢、統計數據、成長預測(2025-2030 年)
 服裝物流市場規模、佔有率、趨勢分析報告:按服務、運輸方式、銷售管道、最終用途、地區、細分市場預測,2024-2030
 全球服裝物流市場