


 |
市場調查報告書
商品編碼
1934916
資料中心託管:市場佔有率分析、產業趨勢與統計、成長預測(2026-2031)Data Center Colocation - Market Share Analysis, Industry Trends & Statistics, Growth Forecasts (2026 - 2031) |
||||||
※ 本網頁內容可能與最新版本有所差異。詳細情況請與我們聯繫。
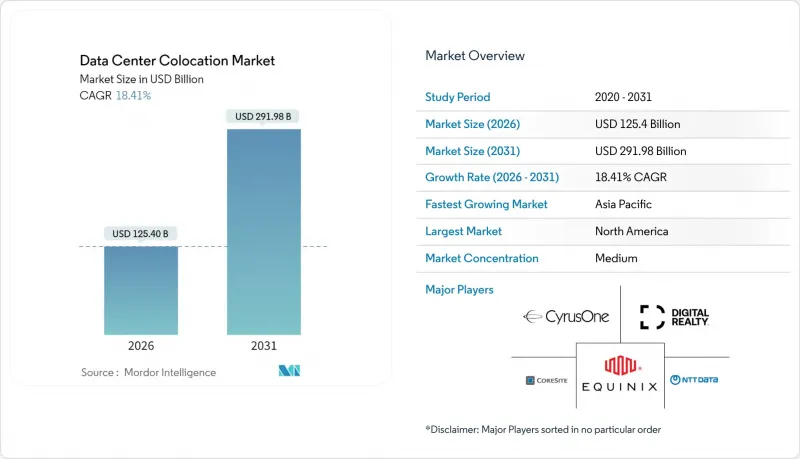
預計到 2025 年,資料中心託管市場規模將達到 1059.1 億美元,預計在預測期(2026-2031 年)內將以 18.41% 的複合年成長率成長,從 2026 年的 1254 億美元成長到 2031 年的 2919.8 億美元。
推動市場需求的因素包括:國家人工智慧指令要求提供可靠、中立的資料中心容量;邊緣運算的普及需要分散式架構;以及40kW以上機架密度的液冷機房的主流化應用。隨著企業自有設施向服務型模式的轉變加速,能夠提供雲端連接生態系統、快速部署選項和節能設計的中立服務供應商將繼續保持優勢。私募股權所有權是市場中的一股決定性力量,即使在高利率環境下,也能幫助營運商快速為大型園區計劃資金籌措。資料中心託管市場如今已涵蓋所有主要產業,能夠將高密度人工智慧基礎設施與合規環境結合的服務供應商最能掌握不斷成長的市場需求。
全球資料中心託管市場趨勢與洞察
雲端和SaaS工作負載整合持續成長
隨著混合IT架構主導企業發展藍圖的製定,企業正被迫將對延遲敏感的工作負載託管在距離主要公共雲端僅一個互連端口的託管資料中心。平均15-20個直連雲平台的連接埠正成為一項基本要求,這使得租戶能夠降低資料傳輸成本,並簡化多重雲端部署中的合規流程。互連服務已佔市場領導總收入的18%,因為客戶願意為即插即用的雲端接近性連線支付20-30%的溢價。
物聯網/人工智慧和邊緣工作負載帶來的資料爆炸
生成式人工智慧訓練叢集通常每個機架消耗 40-80kW 的電力消耗量,這對於傳統的風冷機房來說是難以承受的。為了解決這個問題,營運商正在安裝液冷歧管和浸沒式冷卻槽來支援 GPU鑽機,這些設備的功耗是傳統機架的三到五倍。並行邊緣部署方案是將微節點部署在工廠、體育場和電信塔附近,並透過暗纖環將流量聚合到中心託管站點。這種軸輻式拓撲結構使企業能夠在保持集中控制的同時進行即時分析。
高利率環境下,初始建設成本增加。
2024年,受鋼材、開關設備和燃料價格上漲的影響,美國毛坯建築的平均成本上漲至每平方英尺468.66美元,而這些價格上漲又與融資成本密切相關。開發商正透過預製模組、資產證券化和高品質的租戶租賃協議來緩解成本上漲的影響,但核准積壓仍意味著工期長達18至24個月。這使得財務實力成為一項日益重要的競爭優勢,精明的買家會在競爭對手獲得規劃核准之前就獲得建設資金。
細分市場分析
到2025年,零售型資料中心將佔據資料中心託管市場52.18%的佔有率,主要得益於企業對充足交叉連接和便利承包服務的偏好。同時,針對超大規模資料中心業者的單一租戶批發服務雖然面積大規模,但隨著超大規模資料中心業者不斷提升其內部建置能力,利潤率將面臨壓縮。模組化/邊緣運算單元細分市場正以18.74%的複合年成長率成長,成為業界成長最快的營收細分市場,凸顯了資料中心向接近性運算模式的轉變。像Digital Realty這樣的供應商正在傳統園區中增設工廠預製模組,將標準化設計與快速部署相結合,以滿足服務不足的大都會圈。這些混合型資料中心為營運商提供了更大的資金靈活性,使其能夠根據工作負載特性調整密度,並滿足以往依賴本地機房的新需求。
專注於維持零售市場佔有率的營運商正在將託管網路架構、合規認證和人工智慧賦能的機房捆綁銷售,模糊了零售和批發之間的傳統界限。合約擴大採用類似雲端的計量收費模式,吸引了尋求可預測成本調整的雲端原生Start-Ups。隨著企業在超大規模雲端和邊緣資料中心之間遷移工作負載,資料中心託管市場實際上正在從核心到邊緣形成一個連續的整體,而不是一個獨立的設施類別。能夠協調這項連續體容量規劃的供應商可望提高交叉銷售收入並降低客戶流失率。
到2025年,Tier III級資料中心將佔託管市場55.26%的佔有率,因為它們能夠為大多數企業工作負載提供冗餘性和成本效益之間的平衡。然而,金融交易、人工智慧訓練和生命安全等應用需要Tier IV級資料中心99.995%的運轉率,預計到2031年,該等級資料中心的複合年成長率將達到18.25%。架構轉型包括三模UPS配置、2N+1冷卻拓樸結構以及預測性維護分析,以防患於未然。超大規模租戶通常會簽訂長期租賃契約,以證明其高資本投入的合理性,從而提高營運商的盈利。
金融和醫療保健行業的監管機構目前已將運轉率標準納入其許可要求,有效地將Tier III標準鎖定為最低可接受標準,同時透過縮短供應商核准週期為Tier IV標準提供優先待遇。合規帶來的增值使營運商能夠獲得更長的合約期限和更高的每平方英尺經常性收入。隨著人工智慧工作負載從研發階段過渡到生產階段,預計Tier IV標準的應用範圍將超越高效能細分市場,並支援資料中心託管市場佔有率的穩定成長。
區域分析
北美地區在2025年仍將維持39.88%的需求佔有率,並繼續成為最大的收入貢獻者,這主要得益於數十年來暗纖的部署、密集的網際網路交換基礎設施以及支撐雲端運算GDP的成熟超大規模資料中心。然而,北維吉尼亞和矽谷的電力開發禁令正將新的需求推向鳳凰城、哥倫布和蒙特利爾,這些地區的公共產業仍可在24個月內核准100兆瓦的電力項目。在這些二線樞紐城市,地方政府正透過稅收減免和簡化核准流程來吸引開發商,從而緩解傳統大都會地區面臨的土地短缺問題。
亞太地區是成長最快的地區,預計到2031年將維持24.95%的複合年成長率。中國大力推動數位公共基礎設施建設、印度積極採用商業雲端服務以及日本嚴格的數據居住改革,都推動了該地區兆瓦級訂單的訂單。新加坡重新實施建設配額制度,也帶動了柔佛和巴淡島的電力需求。同時,澳洲、印尼和菲律賓迎來了首批超大規模投資,使該地區有望在2031年超越其他任何大洲。
歐洲-南美-中東-非洲走廊構成了第三個成長層級。隨著阿姆斯特丹實施更嚴格的能源效率標準,法蘭克福、都柏林和馬德里正在應對非洲大陸的過剩需求。聖保羅正崛起為南半球樞紐,而利雅德則利用國家資本建設一條符合其「2030願景」目標的全新數位走廊。在整個區域內,可再生能源的可用性和高效的電網互聯正在成為決定位置的重要因素,風能資源豐富的巴塔哥尼亞和太陽能資源豐富的阿拉伯聯合大公國出人意料地成為下一輪建設熱潮的理想候選地。
其他福利:
- Excel格式的市場預測(ME)表
- 3個月的分析師支持
目錄
第1章 引言
- 研究假設和市場定義
- 調查範圍
第2章調查方法
第3章執行摘要
第4章 市場情勢
- 市場概覽
- 市場促進因素
- 雲端和SaaS工作負載整合正在興起
- 物聯網/人工智慧和邊緣工作負載帶來的資料爆炸
- 更嚴格的資料主權法規推動了國內資料中心託管需求。
- 基於小型模組化反應器(SMR)的現場核能發電在大型校園中的興起
- 對於人工智慧驅動的工作負載密度,您需要一個液冷式託管機房。
- 國家主導的人工智慧舉措需要值得信賴的第三方能力
- 市場限制
- 高利率環境下,初始建設成本不斷上漲
- 主要大都市地區長期有電網和土地短缺問題
- 碳排放稅逐步增加導致營運成本的不確定性加劇。
- 與氣候風險相關的保險費上漲
- 供應鏈分析
- 監管環境
- 技術展望
- 波特五力模型
- 供應商的議價能力
- 買方的議價能力
- 新進入者的威脅
- 替代品的威脅
- 競爭對手之間的競爭
- 對影響市場的宏觀經濟因素進行評估
第5章 市場規模與成長預測
- 按託管類型
- 零售
- 批發的
- 層級標準
- 一級和二級
- Tier III
- 四級
- 按資料中心規模
- 小規模
- 中號
- 大規模
- 巨大的
- 百萬
- 按最終用戶行業分類
- BFSI
- 資訊科技/通訊
- 電子商務與零售
- 政府/國防
- 製造和工業IoT
- 媒體與娛樂
- 醫療保健和生命科學
- 能源與公共產業
- 按地區
- 北美洲
- 美國
- 加拿大
- 墨西哥
- 南美洲
- 巴西
- 阿根廷
- 南美洲其他地區
- 歐洲
- 英國
- 德國
- 法國
- 義大利
- 西班牙
- 俄羅斯
- 其他歐洲
- 亞太地區
- 中國
- 日本
- 印度
- 韓國
- 澳洲和紐西蘭
- 亞太其他地區
- 中東和非洲
- 中東
- 沙烏地阿拉伯
- 阿拉伯聯合大公國
- 土耳其
- 其他中東地區
- 非洲
- 南非
- 奈及利亞
- 肯亞
- 其他非洲地區
- 中東
- 北美洲
第6章 競爭情勢
- 市佔率分析
- 公司簡介
- Equinix Inc.
- Digital Realty Trust Inc.
- NTT Global Data Centers
- CyrusOne Inc.
- CoreSite Realty Corp.
- Cyxtera Technologies Inc.
- Iron Mountain Data Centers
- KDDI(telehouse)
- Flexential Corp.
- Rackspace Technology Inc.
- Vantage Data Centers
- QTS Data Centers(Blackstone)
- Switch Inc.
- EdgeConneX
- Stack Infrastructure
- Aligned Data Centers
- Global Switch
- Telefonica Tech
- China Telecom Global
- Scala Data Centers
- Teraco Data Environments
- Keppel DC REIT
第7章 市場機會與未來展望
The data center colocation market was valued at USD 105.91 billion in 2025 and estimated to grow from USD 125.4 billion in 2026 to reach USD 291.98 billion by 2031, at a CAGR of 18.41% during the forecast period (2026-2031).
Demand is fueled by sovereign-AI mandates that require trusted neutral capacity, edge computing deployments that need distributed footprints, and the mainstreaming of liquid-cool-ready suites for rack densities above 40 kW. The accelerating shift from enterprise-owned facilities toward service-based models continues to favor neutral providers that offer cloud-on-ramp ecosystems, rapid deployment options, and energy-efficient designs. Private-equity ownership has become a defining force, allowing operators to finance mega-campus projects quickly even as interest rates remain elevated. The data center colocation market now spans every major industry vertical, and providers able to combine high-density AI infrastructure with compliance-ready environments are best positioned to capture incremental demand.
Global Data Center Colocation Market Trends and Insights
Increasing Integration of Cloud and SaaS Workloads
Hybrid-IT architectures now dominate enterprise roadmaps, pushing organizations to house latency-sensitive workloads in colocation facilities that sit one cross-connect away from major public clouds. Direct-connect ports to an average of 15-20 cloud platforms are becoming table stakes, enabling tenants to shrink egress fees and simplify regulatory compliance for multi-cloud deployments.Interconnection services already contribute 18% of total revenue for market leaders as customers accept 20-30% price premiums for plug-and-play cloud proximity.
Proliferation of Data from IoT/AI and Edge Workloads
Generative-AI training clusters routinely draw 40-80 kW per rack, a power envelope unsustainable in legacy air-cooled halls. Operators are therefore fitting liquid manifolds and immersion tanks to support GPU rigs that devour 3-5 times the electricity of traditional racks. Parallel edge rollouts place micro-nodes near factories, stadia and telco towers, all funneling traffic back to hub colocation sites via dark-fiber rings. This hub-and-spoke topology lets enterprises run real-time analytics while maintaining centralized governance.
High Up-Front Build Cost Amid Elevated Interest Rates
Average U.S. shell-and-core outlays climbed to USD 468.66 per sq ft in 2024 as steel, switchgear and fuel prices rose in tandem with financing costs. Developers are mitigating sticker shock through prefabricated modules, asset-backed securitizations and credit-tenant leases, but permitting queues still stretch delivery cycles to 18-24 months. Balance-sheet strength is therefore becoming a competitive advantage as nimble buyers pre-fund capacity before rivals even secure zoning approval.
Other drivers and restraints analyzed in the detailed report include:
- Stricter Data-Sovereignty Laws Boosting In-Country Demand
- AI-Driven Workload Density Requiring Liquid-Cool-Ready Suites
- Chronic Grid-Power and Land Shortages in Tier-1 Metros
For complete list of drivers and restraints, kindly check the Table Of Contents.
Segment Analysis
Retail facilities commanded 52.18% of data center colocation market share in 2025, largely because enterprises value the convenience of cross-connect-rich ecosystems and turnkey services. Wholesale offerings targeting single-tenant hyperscalers supply larger footprints but face margin compression as hyperscalers develop self-build capabilities. The modular/edge-pod subsegment, growing at a 18.74% CAGR, represents the industry's fastest-rising revenue stream and highlights the pivot toward proximity-driven compute. Providers such as Digital Realty have added factory-built modules to traditional campuses, combining standardized design with rapid deployment for under-served metros. These hybrid estates enable operators to allocate capital more flexibly, match density tiers to workload profiles, and capture new demand nodes that previously defaulted to on-premises closets.
Operators keen to defend retail share now bundle managed-network fabrics, compliance attestations, and AI-ready cages, blurring historical boundaries between retail and wholesale. Contracts increasingly feature consumption-based pricing models similar to cloud, attracting cloud-native startups seeking predictable cost alignment. As enterprises shuffle workloads between hyperscale clouds and edge pods, the data center colocation market is effectively segmenting into core-edge continuums rather than distinct facility classes. Providers that orchestrate capacity-planning across this continuum stand to expand cross-sell revenue and reduce churn.
Tier III facilities held 55.26% of the data center colocation market size in 2025 because they balance redundancy with cost efficiency for most enterprise workloads. Financial trading, AI training, and life-safety applications, however, require the 99.995% uptime of Tier IV, driving an 18.25% CAGR forecast for that class through 2031. The architectural shift includes tri-mode UPS configurations, 2N+1 cooling topologies, and predictive-maintenance analytics that pre-empt failures. Hyperscale tenants often sign anchor leases that justify the higher capital intensity, improving the return profile for operators.
Regulators in finance and healthcare now incorporate uptime standards into licensing, effectively hard-coding Tier III as the minimum acceptable standard while rewarding Tier IV with accelerated vendor-approval cycles. This compliance halo inflates perceived value, allowing operators to secure longer contract terms and higher recurring revenue per square foot. As more AI workloads transition from R&D to production, expect Tier IV adoption to expand beyond its high-performance niche, underpinning steady share gains in the data center colocation market.
Data Center Colocation Market Report is Segmented by Colocation Type (Retail, Wholesale), Tier Standard (Tier I and II, Tier III, Tier IV), Data Center Size (Small, Medium and More), End-User Industry (BFSI, IT and Telecom, E-Commerce and Retail, Government and Defense, and More), and by Geography(North America and Europe and More). The Market Forecasts are Provided in Terms of Value (USD).
Geography Analysis
North America retained 39.88% demand in 2025, North America remains the largest revenue contributor thanks to decades of dark-fiber build-out, dense internet-exchange fabrics, and a mature hyperscale footprint that underpins cloud GDP. Power moratoriums in Northern Virginia and Silicon Valley, however, are steering new demand to Phoenix, Columbus, and Montreal, where utilities can still green-light 100 MW blocks inside 24 months. Local governments in these secondary hubs court developers with tax holidays and expedited permitting, tempering the land-scarcity issues dogging legacy metros.
Asia-Pacific is the fastest mover, Asia-Pacific is forecast to post a 24.95% CAGR through 2031. China's digital-public-infrastructure drive, India's commerce-cloud adoption, and Japan's stringent data-residency amendments are all piling megawatt orders into regional pipelines. Singapore has reinstated a constrained build quota, funneling spill-over demand to Johor and Batam. Meanwhile, Australia, Indonesia and the Philippines are receiving first-time hyperscale commitments, positioning the bloc to outpace every other continent in incremental capacity through 2031.
Europe, South America and the Middle East-Africa corridor form the third growth tier. Frankfurt, Dublin and Madrid handle continental overflow as Amsterdam imposes stricter energy-efficiency hurdles. Sao Paulo is emerging as a southern-hemisphere hub, whereas Riyadh is leveraging sovereign capital to erect new digital corridors linked to Vision 2030 goals. Across all regions, renewable accessibility and streamlined grid interconnections are decisive site-selection filters, making wind-rich Patagonia and solar-dense Emirates unexpectedly attractive for the next wave of builds.
- Equinix Inc.
- Digital Realty Trust Inc.
- NTT Global Data Centers
- CyrusOne Inc.
- CoreSite Realty Corp.
- Cyxtera Technologies Inc.
- Iron Mountain Data Centers
- KDDI (telehouse)
- Flexential Corp.
- Rackspace Technology Inc.
- Vantage Data Centers
- QTS Data Centers (Blackstone)
- Switch Inc.
- EdgeConneX
- Stack Infrastructure
- Aligned Data Centers
- Global Switch
- Telefonica Tech
- China Telecom Global
- Scala Data Centers
- Teraco Data Environments
- Keppel DC REIT
Additional Benefits:
- The market estimate (ME) sheet in Excel format
- 3 months of analyst support
TABLE OF CONTENTS
1 INTRODUCTION
- 1.1 Study Assumptions and Market Definition
- 1.2 Scope of the Study
2 RESEARCH METHODOLOGY
3 EXECUTIVE SUMMARY
4 MARKET LANDSCAPE
- 4.1 Market Overview
- 4.2 Market Drivers
- 4.2.1 Increasing integration of cloud and SaaS workloads
- 4.2.2 Proliferation of data from IoT/AI and edge workloads
- 4.2.3 Stricter data-sovereignty laws boosting in-country colo demand
- 4.2.4 Emergence of SMR-based on-site nuclear power for mega campuses
- 4.2.5 AI-driven workload density requiring liquid-cool-ready colo suites
- 4.2.6 Sovereign AI initiatives requiring trusted third-party capacity
- 4.3 Market Restraints
- 4.3.1 High up-front build cost amid elevated interest rates
- 4.3.2 Chronic grid-power and land shortages in Tier-1 metros
- 4.3.3 Carbon-tax escalation raising opex unpredictability
- 4.3.4 Rising insurance premiums linked to climate risk
- 4.4 Supply-Chain Analysis
- 4.5 Regulatory Landscape
- 4.6 Technological Outlook
- 4.7 Porter's Five Forces
- 4.7.1 Bargaining Power of Suppliers
- 4.7.2 Bargaining Power of Buyers
- 4.7.3 Threat of New Entrants
- 4.7.4 Threat of Substitutes
- 4.7.5 Intensity of Competitive Rivalry
- 4.8 Assesment of Macroeconomic Factors on the Market
5 MARKET SIZE AND GROWTH FORECASTS (VALUE)
- 5.1 By Colocation Type
- 5.1.1 Retail
- 5.1.2 Wholesale
- 5.2 By Tier Standard
- 5.2.1 Tier I & II
- 5.2.2 Tier III
- 5.2.3 Tier IV
- 5.3 By Data Center Size
- 5.3.1 Small
- 5.3.2 Medium
- 5.3.3 Large
- 5.3.4 Massive
- 5.3.5 Mega
- 5.4 By End-user Industry
- 5.4.1 BFSI
- 5.4.2 IT and Telecom
- 5.4.3 E-commerce and Retail
- 5.4.4 Government and Defense
- 5.4.5 Manufacturing and Industrial IoT
- 5.4.6 Media and Entertainment
- 5.4.7 Healthcare and Life Sciences
- 5.4.8 Energy and Utilities
- 5.5 By Geography
- 5.5.1 North America
- 5.5.1.1 United States
- 5.5.1.2 Canada
- 5.5.1.3 Mexico
- 5.5.2 South America
- 5.5.2.1 Brazil
- 5.5.2.2 Argentina
- 5.5.2.3 Rest of South America
- 5.5.3 Europe
- 5.5.3.1 United Kingdom
- 5.5.3.2 Germany
- 5.5.3.3 France
- 5.5.3.4 Italy
- 5.5.3.5 Spain
- 5.5.3.6 Russia
- 5.5.3.7 Rest of Europe
- 5.5.4 Asia-Pacific
- 5.5.4.1 China
- 5.5.4.2 Japan
- 5.5.4.3 India
- 5.5.4.4 South Korea
- 5.5.4.5 Australia and New Zealand
- 5.5.4.6 Rest of Asia-Pacific
- 5.5.5 Middle East and Africa
- 5.5.5.1 Middle East
- 5.5.5.1.1 Saudi Arabia
- 5.5.5.1.2 UAE
- 5.5.5.1.3 Turkey
- 5.5.5.1.4 Rest of Middle East
- 5.5.5.2 Africa
- 5.5.5.2.1 South Africa
- 5.5.5.2.2 Nigeria
- 5.5.5.2.3 Kenya
- 5.5.5.2.4 Rest of Africa
- 5.5.5.1 Middle East
- 5.5.1 North America
6 COMPETITIVE LANDSCAPE
- 6.1 Market Share Analysis
- 6.2 Company Profiles (includes Global level Overview, Market level overview, Core Segments, Financials as available, Strategic Information, Market Rank/Share for key companies, Products and Services, and Recent Developments)
- 6.2.1 Equinix Inc.
- 6.2.2 Digital Realty Trust Inc.
- 6.2.3 NTT Global Data Centers
- 6.2.4 CyrusOne Inc.
- 6.2.5 CoreSite Realty Corp.
- 6.2.6 Cyxtera Technologies Inc.
- 6.2.7 Iron Mountain Data Centers
- 6.2.8 KDDI (telehouse)
- 6.2.9 Flexential Corp.
- 6.2.10 Rackspace Technology Inc.
- 6.2.11 Vantage Data Centers
- 6.2.12 QTS Data Centers (Blackstone)
- 6.2.13 Switch Inc.
- 6.2.14 EdgeConneX
- 6.2.15 Stack Infrastructure
- 6.2.16 Aligned Data Centers
- 6.2.17 Global Switch
- 6.2.18 Telefonica Tech
- 6.2.19 China Telecom Global
- 6.2.20 Scala Data Centers
- 6.2.21 Teraco Data Environments
- 6.2.22 Keppel DC REIT
7 MARKET OPPORTUNITIES AND FUTURE OUTLOOK
- 7.1 White-space and Unmet-Need Assessment
 資料中心託管市場:按類型、服務類型、等級、電力容量、部署模式、企業規模和最終用戶產業分類-2026-2032年全球市場預測
 2026年全球多租戶資料中心市場報告
 資料中心託管市場分析及預測(至2035年):類型、產品類型、服務、技術、組件、應用、部署模式、最終用戶、解決方案
 2026-2030年全球資料中心託管與管理式主機服務市場2026年全球資料中心託管市場報告
 資料中心託管:決策者視角與策略重點,2026-2027 年全球多租戶資料中心市場規模、佔有率、趨勢和成長分析報告(2026-2034)
 資料中心託管市場 - 全球產業規模、佔有率、趨勢、機會、預測:託管類型、企業規模、最終用途、地區和競爭格局,2021-2031年全球資料中心營運商概況、託管、2026 年
 日本資料中心託管市場報告(按類型、組織規模、最終用途行業和地區分類,2026-2034 年)