


 |
市場調查報告書
商品編碼
1934886
美洲感測器市場:市場佔有率分析、產業趨勢與統計、成長預測(2026-2031 年)Americas Sensor - Market Share Analysis, Industry Trends & Statistics, Growth Forecasts (2026 - 2031) |
||||||
※ 本網頁內容可能與最新版本有所差異。詳細情況請與我們聯繫。
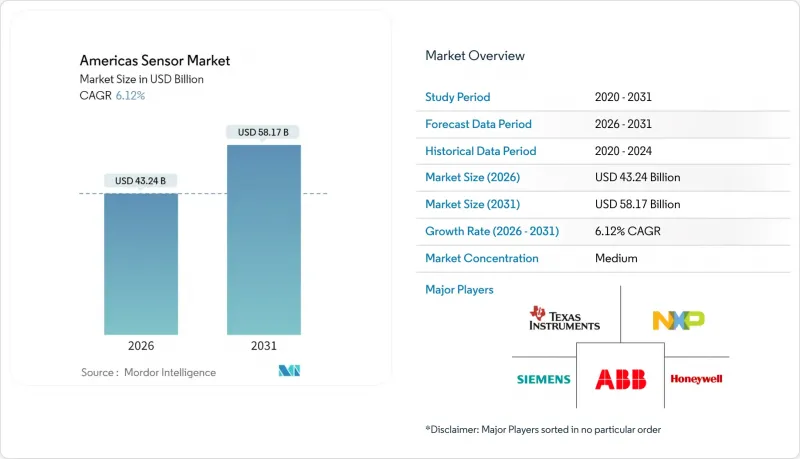
預計美洲感測器市場將從 2025 年的 407.5 億美元成長到 2026 年的 432.4 億美元,到 2031 年將達到 581.7 億美元,2026 年至 2031 年的複合年成長率為 6.12%。
量子導航系統、低功耗邊緣人工智慧處理以及微機電系統(MEMS)小型化正在融合,成為推動市場需求成長的主要動力。同時,政府對智慧基礎設施的大量投入正在加速其大規模應用。對自動駕駛汽車、精密農業和可再生能源監測的投資加劇了雷射雷達、環境和振動感測技術的競爭。持續的地緣政治摩擦促使人們迫切需要將氮化鎵和碳化矽基板的供應鏈遷回國內。策略併購,特別是意法半導體計畫以9.5億美元收購恩智浦半導體的感測器部門,標誌著市場正向垂直整合平台轉型,這些平台能夠提供安全可靠的、支援人工智慧的感測器融合功能。
美洲感測器市場趨勢與洞察
消費性物聯網設備的快速普及
智慧家庭在美國和加拿大的主要城市正逐步市場層級,形成對低功耗無線感測器的持續需求,這類感測器只需一枚紐扣電池即可運作數年。美國運輸部的SMART津貼正在推動城市交通和空氣品質感測器的部署,確保採購預算並規範連接通訊協定。這些設備中嵌入的邊緣AI晶片組消除了雲端延遲並保護了資料隱私,這對於實施嚴格數位主權規則的地區至關重要。由此帶來的銷售成長正在幫助MEMS供應商實現規模經濟,並刺激拉丁美洲大都市地區升級公共運輸網路的需求。
美洲製造業自動化投資不斷成長
美國和墨西哥的原始設備製造商 (OEM) 正在改造生產線,加裝振動、聲學和熱感測器,這些感測器能夠為預測性維護算法提供資訊,從而顯著減少計劃外停機時間。巴西石油公司 (Petrobras) 在巴西的工廠正在部署基於感測器的能源儀表板,以降低公用事業成本並履行環境、社會和治理 (ESG) 報告義務。道達爾能源 (Total Energies) 煉油廠無線振動感測器的試點部署在一個季度內實現了零計劃外停機,證明了大規模部署的投資回報率 (ROI)。隨著感測器在從底特律到蒙特雷和聖保羅的汽車、金屬和食品加工產業走廊得到應用,這些成果正在加速跨境技術轉移。
對安全關鍵感測器的嚴格監管認證
汽車功能安全法規將檢驗週期延長了至多18個月,這使得沒有專門合規團隊的新創公司處於不利地位。 FDA對臨床級穿戴裝置的監管要求包括高成本的生物相容性測試和上市後監管審核,隨著美洲感測器產業的整合,這進一步鞏固了現有企業的優勢。
細分市場分析
環境感測器以7.86%的複合年成長率成為成長最快的市場,這主要得益於企業競相達到範圍1排放目標,以及政府機構強制要求提供即時空氣品質數據。然而,溫度測量設備佔據了美洲感測器市場19.46%的最大佔有率,這主要歸功於其在暖通空調系統和家用電子電器的廣泛應用。壓力和液位感測器在能源管道和智慧水網中的應用日益普及,這一趨勢主要受美國西部地區抗旱計劃的推動。隨著工廠向無人營運轉型,流量和接近感測器在機器人和包裝生產線中的應用也日益廣泛。Honeywell為國防承包商進行的量子磁力計和慣性測量單元試驗,預示著超高精度導航應用時代的到來。
二次滲透效應在農業領域顯而易見,振動感測器和化學感測器分別用於評估土壤壓實度和養分含量。嵌入穿戴式裝置的微型MEMS濕度感測器正在推動健康監測應用,而磁感測器則有助於追蹤可再生能源渦輪機的位置。這些趨勢共同推動環境解決方案在採購計畫中佔據優先地位,並不斷擴大其在美洲感測器市場的佔有率。
隨著汽車OEM廠商最終敲定下一代ADAS平台,雷射雷達(LiDAR)的複合年成長率(CAGR)高達8.02%,超過了所有其他應用類別。同時,電容式感測器在出貨量方面保持了17.88%的領先地位,這主要得益於消費和工業領域對觸控螢幕、近距離感應和液位監測等應用的持續需求。光學和成像感測器受益於邊緣AI增強的噪音抑制技術,其在遠端醫療和空氣品質分析領域的應用日益廣泛。電阻式感測器和生物感測器則在對精度和校準漂移高度敏感的低溫運輸物流和連續血糖監測領域開闢了一片天地。
除了防碰撞系統之外,雷達模組的應用範圍正在擴展到周界安防和工業起重機自動化領域,填補了光學視距(LOS)失效環境下的性能空白。整合了雷射雷達、雷達和成像單元的多模融合堆疊正逐漸成為自動駕駛班車的標準架構,進一步擴大了美洲自動駕駛解決方案的感測器市場。
其他福利:
- Excel格式的市場預測(ME)表
- 分析師支持(3個月)
目錄
第1章 引言
- 研究假設和市場定義
- 調查範圍
第2章調查方法
第3章執行摘要
第4章 市場情勢
- 市場概覽
- 市場促進因素
- 消費性物聯網設備的快速普及
- 北美和南美製造業自動化投資增加
- 政府對智慧基礎設施維修的激勵措施
- 隨著電動車和自動駕駛汽車的日益普及,對多感測器套件的需求也日益成長。
- 低功耗邊緣人工智慧的興起使得感測器端分析成為可能。
- 可印刷/軟性感測器在醫療穿戴設備中的應用日益廣泛
- 市場限制
- 對安全關鍵感測器的嚴格監管認證
- MEMS生產線的高資本投入
- 特種材料(GaN、SiC)供應鏈的集中化
- 與感測器資料完整性相關的網路安全責任
- 產業價值鏈分析
- 監管環境
- 技術展望
- 波特五力分析
- 供應商的議價能力
- 消費者議價能力
- 新進入者的威脅
- 替代品的威脅
- 競爭對手之間的競爭
- 宏觀經濟因素如何影響市場
第5章 市場規模與成長預測
- 透過測量參數
- 溫度
- 壓力
- 等級
- 流動
- 鄰近性
- 環境
- 化學
- 慣性測量單元
- 磁的
- 振動
- 其他參數
- 按操作模式
- 光學
- 電阻
- 生物感測器
- 壓阻式
- 影像
- 電容式
- 壓電
- LiDAR
- 雷達
- 其他模式
- 透過感測器技術
- MEMS感測器
- 非MEMS感測器
- 按最終用戶行業分類
- 車
- 家用電子電器
- 智慧型手機
- 平板電腦、筆記型電腦、電腦
- 穿戴式裝置
- 智慧家庭設備
- 其他家用電子電器
- 能源與公共產業
- 工業自動化
- 醫療衛生領域
- 建築業、農業、礦業
- 航太
- 國防與安全
- 按國家/地區
- 美國
- 加拿大
- 巴西
- 墨西哥
- 阿根廷
- 智利
- 其他美洲國家
第6章 競爭情勢
- 市場集中度
- 策略趨勢
- 市佔率分析
- 公司簡介
- Texas Instruments Incorporated
- TE Connectivity Ltd.
- Omega Engineering Inc.
- Honeywell International Inc.
- Rockwell Automation Inc.
- Siemens AG
- ams-OSRAM AG
- NXP Semiconductors NV
- Infineon Technologies AG
- Bosch Sensortec GmbH
- SICK AG
- ABB Ltd.
- OMRON Corporation
- STMicroelectronics NV
- Analog Devices, Inc.
- Microchip Technology Inc.
- Sensata Technologies Holding plc
- Murata Manufacturing Co., Ltd.
- Panasonic Holdings Corporation
- Qualcomm Incorporated
第7章 市場機會與未來展望
The Americas sensor market is expected to grow from USD 40.75 billion in 2025 to USD 43.24 billion in 2026 and is forecast to reach USD 58.17 billion by 2031 at 6.12% CAGR over 2026-2031.
Quantum-enabled navigation systems, low-power edge-AI processing, and MEMS miniaturization together create the strongest pull on demand, while heavy public-sector funding for smart infrastructure accelerates large-scale deployments. Investments in autonomous vehicles, precision agriculture, and renewable-energy monitoring are intensifying competition around LiDAR, environmental, and vibration sensing technologies. Supply-chain reshoring for gallium-nitride and silicon-carbide substrates gains urgency as geopolitical frictions persist. Strategic M&A - most notably STMicroelectronics' planned USD 950 million purchase of NXP's sensor unit - signals a shift toward vertically integrated platforms offering secure, AI-ready sensor fusion capabilities.
Americas Sensor Market Trends and Insights
Rapid Proliferation of Consumer IoT Devices
Smart-home penetration now reaches mass-market levels in major U.S. and Canadian cities, creating sustained demand for low-power wireless sensors that can operate for years on a coin cell. The U.S. Department of Transportation's SMART Grants are catalyzing citywide traffic and air-quality sensor rollouts, locking in procurement budgets and standardizing connectivity protocols. Edge-AI chipsets embedded inside these devices eliminate cloud latency and protect data privacy - critical for jurisdictions implementing strict digital sovereignty rules. The resulting volume lift underpins economies of scale for MEMS suppliers, with spillover demand in Latin American metros upgrading public-transport networks.
Rising Automation Investments in North and South American Manufacturing
OEMs across the United States and Mexico retool production lines with vibration, acoustic, and thermal sensors that feed predictive-maintenance algorithms, slashing unplanned downtime. Petrobras-supplied Brazilian plants deploy sensor-based energy dashboards to curb utility costs and satisfy ESG reporting mandates. TotalEnergies' refinery pilot with wireless vibration sensors demonstrated a full quarter without unscheduled shutdowns, validating ROI for widescale rollouts. These wins accelerate cross-border knowledge transfer, hardwiring sensor adoption into automotive, metals, and food-processing corridors from Detroit to Monterrey and Sao Paulo.
Stringent Regulatory Certification for Safety-Critical Sensors
Automotive functional-safety regulations extend validation cycles by up to 18 months, disfavoring venture-backed startups that lack dedicated compliance teams. FDA mandates for clinical-grade wearables impose costly biocompatibility and post-market surveillance audits, reinforcing incumbent advantage as the Americas sensor industry consolidates.
Other drivers and restraints analyzed in the detailed report include:
- Government Incentives for Smart-Infrastructure Retrofits
- Expansion of Electric and Autonomous Vehicles Requiring Multi-Sensor Suites
- Supply-Chain Concentration in Exotic Materials (GaN, SiC)
For complete list of drivers and restraints, kindly check the Table Of Contents.
Segment Analysis
Environmental sensors post the fastest 7.86% CAGR as corporates race to meet Scope-1 emissions targets and municipal bodies mandate real-time air-quality data. Temperature devices nonetheless hold the largest 19.46% slice of the Americas sensor market share, thanks to ubiquitous HVAC and consumer-electronics integration. Pressure and level sensors scale within energy pipelines and smart water networks, a trend amplified by drought-mitigation projects across the Western United States. Flow and proximity sensing gain traction in robotics and packaging lines as factories pivot to lights-out operations. Quantum magnetometers and inertial units - piloted by Honeywell for defense contracts - hint at a coming wave of ultra-precise navigation applications.
Second-order adoption effects surface in agriculture, where vibration and chemical sensors diagnose soil compaction and nutrient levels, respectively. Miniaturized MEMS humidity sensors embedded in wearables push health-monitoring use cases, while magnetic sensors underpin renewable-energy turbine position tracking. Collectively, these dynamics keep environmental solutions front and center in procurement roadmaps and increase their proportion of the Americas sensor market.
LiDAR's 8.02% CAGR outpaces all other operational classes as automotive OEMs lock in next-generation ADAS platforms. Simultaneously, capacitive devices maintain an 17.88% leading share by unit shipments because of sustained touchscreen, proximity, and fill-level applications across consumer and industrial sectors. Optical and imaging sensors deepen penetration in telemedicine and air-quality analytics, benefitting from edge-AI-enhanced noise suppression. Electrical-resistance and biosensors carve niches in cold-chain logistics and continuous glucose monitoring-segments highly sensitive to accuracy and calibration drift.
Radar modules extend beyond collision-avoidance systems into perimeter security and industrial crane automation, filling performance gaps where optical LOS is compromised. Multi-mode fusion stacks that co-package LiDAR, radar, and imaging units emerge as the reference architecture for autonomous shuttles, further expanding the Americas sensor market size attached to autonomy solutions.
The Americas Sensor Market Report is Segmented by Parameters Measured (Temperature, Pressure, Level, Flow, and More), Mode of Operations (Optical, Electrical Resistance, Biosensor, Piezoresistive, and More), Sensor Technology (MEMS Sensors, and More), End-User Industry (Automotive, Consumer Electronics, Energy, and More), and Country (United States, Canada, and More). The Market Forecasts are Provided in Terms of Value (USD).
List of Companies Covered in this Report:
- Texas Instruments Incorporated
- TE Connectivity Ltd.
- Omega Engineering Inc.
- Honeywell International Inc.
- Rockwell Automation Inc.
- Siemens AG
- ams-OSRAM AG
- NXP Semiconductors N.V.
- Infineon Technologies AG
- Bosch Sensortec GmbH
- SICK AG
- ABB Ltd.
- OMRON Corporation
- STMicroelectronics N.V.
- Analog Devices, Inc.
- Microchip Technology Inc.
- Sensata Technologies Holding plc
- Murata Manufacturing Co., Ltd.
- Panasonic Holdings Corporation
- Qualcomm Incorporated
Additional Benefits:
- The market estimate (ME) sheet in Excel format
- 3 months of analyst support
TABLE OF CONTENTS
1 INTRODUCTION
- 1.1 Study Assumptions and Market Definition
- 1.2 Scope of the Study
2 RESEARCH METHODOLOGY
3 EXECUTIVE SUMMARY
4 MARKET LANDSCAPE
- 4.1 Market Overview
- 4.2 Market Drivers
- 4.2.1 Rapid proliferation of consumer IoT devices
- 4.2.2 Rising automation investments in North and South American manufacturing
- 4.2.3 Government incentives for smart-infrastructure retrofits
- 4.2.4 Expansion of electric and autonomous vehicles requiring multi-sensor suites
- 4.2.5 Emergence of low-power edge AI enabling on-sensor analytics
- 4.2.6 Increasing adoption of printable/flexible sensors in healthcare wearables
- 4.3 Market Restraints
- 4.3.1 Stringent regulatory certification for safety-critical sensors
- 4.3.2 High capital expenditure for MEMS fabrication lines
- 4.3.3 Supply-chain concentration in exotic materials (GaN, SiC)
- 4.3.4 Cyber-security liabilities tied to sensor data integrity
- 4.4 Industry Value Chain Analysis
- 4.5 Regulatory Landscape
- 4.6 Technological Outlook
- 4.7 Porter's Five Forces Analysis
- 4.7.1 Bargaining Power of Suppliers
- 4.7.2 Bargaining Power of Consumers
- 4.7.3 Threat of New Entrants
- 4.7.4 Threat of Substitute Products
- 4.7.5 Intensity of Competitive Rivalry
- 4.8 Impact of Macroeconomic Factors on the Market
5 MARKET SIZE AND GROWTH FORECASTS (VALUE)
- 5.1 By Parameter Measured
- 5.1.1 Temperature
- 5.1.2 Pressure
- 5.1.3 Level
- 5.1.4 Flow
- 5.1.5 Proximity
- 5.1.6 Environmental
- 5.1.7 Chemical
- 5.1.8 Inertial
- 5.1.9 Magnetic
- 5.1.10 Vibration
- 5.1.11 Other Parameters
- 5.2 By Mode of Operation
- 5.2.1 Optical
- 5.2.2 Electrical Resistance
- 5.2.3 Biosensor
- 5.2.4 Piezoresistive
- 5.2.5 Image
- 5.2.6 Capacitive
- 5.2.7 Piezoelectric
- 5.2.8 LiDAR
- 5.2.9 Radar
- 5.2.10 Other Modes
- 5.3 By Sensor Technology
- 5.3.1 MEMS Sensors
- 5.3.2 Non-MEMS Sensors
- 5.4 By End-user Industry
- 5.4.1 Automotive
- 5.4.2 Consumer Electronics
- 5.4.2.1 Smartphones
- 5.4.2.2 Tablets, Laptops and Computers
- 5.4.2.3 Wearable Devices
- 5.4.2.4 Smart Appliances
- 5.4.2.5 Other Consumer Electronics
- 5.4.3 Energy and Utilities
- 5.4.4 Industrial Automation
- 5.4.5 Medical and Wellness
- 5.4.6 Construction, Agriculture and Mining
- 5.4.7 Aerospace
- 5.4.8 Defense and Security
- 5.5 By Country
- 5.5.1 United States
- 5.5.2 Canada
- 5.5.3 Brazil
- 5.5.4 Mexico
- 5.5.5 Argentina
- 5.5.6 Chile
- 5.5.7 Rest of Americas
6 COMPETITIVE LANDSCAPE
- 6.1 Market Concentration
- 6.2 Strategic Moves
- 6.3 Market Share Analysis
- 6.4 Company Profiles (includes Global level Overview, Market level overview, Core Segments, Financials as available, Strategic Information, Market Rank/Share for key companies, Products and Services, and Recent Developments)
- 6.4.1 Texas Instruments Incorporated
- 6.4.2 TE Connectivity Ltd.
- 6.4.3 Omega Engineering Inc.
- 6.4.4 Honeywell International Inc.
- 6.4.5 Rockwell Automation Inc.
- 6.4.6 Siemens AG
- 6.4.7 ams-OSRAM AG
- 6.4.8 NXP Semiconductors N.V.
- 6.4.9 Infineon Technologies AG
- 6.4.10 Bosch Sensortec GmbH
- 6.4.11 SICK AG
- 6.4.12 ABB Ltd.
- 6.4.13 OMRON Corporation
- 6.4.14 STMicroelectronics N.V.
- 6.4.15 Analog Devices, Inc.
- 6.4.16 Microchip Technology Inc.
- 6.4.17 Sensata Technologies Holding plc
- 6.4.18 Murata Manufacturing Co., Ltd.
- 6.4.19 Panasonic Holdings Corporation
- 6.4.20 Qualcomm Incorporated
7 MARKET OPPORTUNITIES AND FUTURE OUTLOOK
- 7.1 White-space and Unmet-need Assessment
 鋼材接近感測器市場報告:趨勢、預測和競爭分析(至2035年)
 電導率儀市場:全球市場按產品類型、測量範圍、電極類型、應用和最終用戶分類的預測——2026-2032年
 2026年全球自由落體金屬探測器市場報告互動式感測器市場:依技術、應用、最終用途、連接方式和外形規格-2026-2032年全球市場預測整合感測器市場:按技術、感測器類型、輸出訊號和應用分類-2026-2032年全球市場預測
 頻譜感測器市場:商業機會、成長要素、產業趨勢分析及2026-2035年預測消費級CP感測器市場:2026-2032年全球預測(依感測器技術、應用、最終用戶和銷售管道)重力感測器市場:按輸出類型、軸數、技術類型、應用和分銷管道分類-2026-2032年全球預測螢光氯化物感測器市場:依產品類型、技術、便攜性、應用、最終用戶和分銷管道分類-2026-2032年全球預測種子智慧計數系統市場:按產品類型、最終用戶、應用、分銷管道和部署模式分類的全球預測,2026-2032年