


 |
市場調查報告書
商品編碼
1934883
鋅:市場佔有率分析、產業趨勢與統計、成長預測(2026-2031)Zinc - Market Share Analysis, Industry Trends & Statistics, Growth Forecasts (2026 - 2031) |
||||||
※ 本網頁內容可能與最新版本有所差異。詳細情況請與我們聯繫。
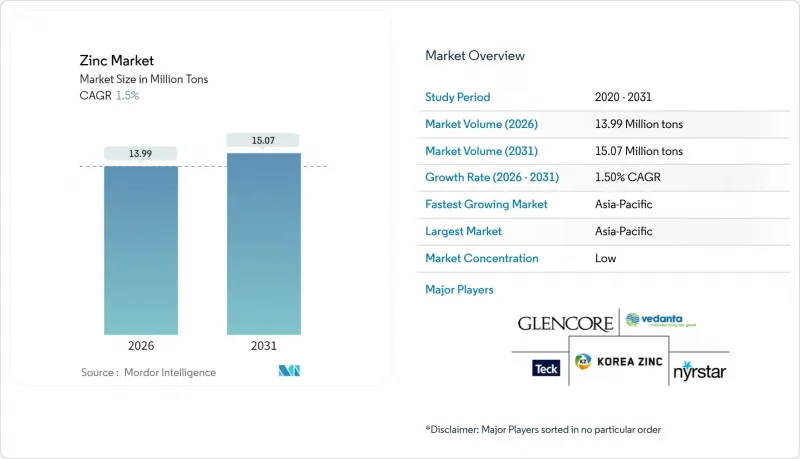
預計到 2026 年,鋅市場規模將達到 1,399 萬噸,高於 2025 年的 1,378 萬噸。
預計到 2031 年將達到 1,507 萬噸,2026 年至 2031 年的複合年成長率為 1.5%。
亞太地區的基礎設施升級、鋅基電池技術的進步以及鋅強化肥料的日益普及正在重塑消費模式,抵消了傳統鍍鋅行業成長放緩的影響。生產商正在平衡原生礦開採和二次回收,以符合更嚴格的環境、社會和治理(ESG)法規,同時冶煉技術的升級旨在減少排放並提高利潤率。儘管供應過剩導致價格波動,但長期儲能和農業生物強化代表著新的需求機遇,並有望在本十年後半期收緊供需平衡。競爭格局有利於同時擁有礦產資源和回收能力的綜合性公司,使它們能夠在永續應用領域抓住溢價機會。
全球鋅市場趨勢及展望
基礎建設主導鋅電鍍需求激增
新興經濟體創紀錄的基礎設施投資計畫直接轉化為鍍鋅鋼消費量的成長,即便中國住宅房地產市場降溫,鋅的需求仍然強勁。每投資1兆美元用於公路、鐵路和電網建設,鍍鋅過程中就會消耗約0.3公斤鋅。政府的綠色基礎設施政策也為此提供了進一步的支撐,因為太陽能板和離岸風力發電發電塔架都需要厚厚的鋅塗層來確保數十年的防腐蝕性能。因此,到2030年,基礎設施建設預計將佔鋅需求成長的一半以上,這在礦石和精礦供應緊張的情況下支撐了鋅價,並促使冶煉廠採用低碳焙燒和浸出技術以獲得環保認證。
耐腐蝕鋼在電動車和可再生能源領域的應用日益廣泛
電動車和風力發電機製造商正從傳統的鍍鋅製程轉向鋅鋁鎂複合塗層。即使產量成長緩慢,這種複合塗層也能提供更長的使用壽命、更薄的塗層厚度以及更高的每公斤金屬價值。高階電動車平台要求在底盤零件和電池外殼上使用高鋅塗層,以降低高壓環境下的腐蝕風險。離岸風電結構進一步推動了鋅的需求,因為塔架和過渡段需要能夠承受25年以上海水噴濺的塗層。這將使每兆瓦的鋅需求量比石化燃料發電廠增加約40%。隨著電動車產量在2025年超過2,000萬輛,市場滲透率每提高1%,車輛所需的鋅量將增加15,000至2萬噸。特種塗層的高價支撐了冶煉廠的利潤,並鼓勵合金製造商在汽車產業群附近擴大產能。
嚴格的環境和ESG法規
空氣排放法規和碳足跡揭露要求正在增加合規成本。美國環保署 (EPA) 修訂的標準已將顆粒物排放限值提高至 50 毫克/標準立方公尺 (mg/dscm),尤其針對歐洲和北美的冶煉廠。歐洲的《關鍵材料法》增加了回收配額和實質審查審核,有利於那些能夠證明其低碳供應鏈的營運商。遵循成本使營運成本增加 5-8%,同時淘汰了獲利能力的高排放設施,從而有效地收緊了精煉供應。像印度斯坦鋅業這樣的領先正在透過品牌化的低碳鋼坯將其優勢貨幣化,從而在汽車競標中獲得溢價。從中長期來看,更嚴格的 ESG 法規將重塑貿易格局,因為進口國將實施邊境碳機制,迫使該地區的生產商加速脫碳進程。
細分市場分析
截至2025年,精煉鋅產量佔總供應量的71.58%。這主要得益於鍍鋅生產線優先使用標準化鋼坯進行連續捲材生產,從而確保了建築和汽車行業需求的穩定。這一優勢使生產商免受短期需求衝擊的影響,因為合約物流、品質保證和信貸條款已融入涵蓋礦山、冶煉廠和線圈塗布的長期供應鏈中。因此,鋅市場的精煉環節對於支持冶煉廠的營運資金計畫至關重要,因為冶煉廠需要快速週轉金屬以支付礦石精礦的款項。
然而,隨著化肥混合商、電子產品製造商和電池技術創新者尋求能夠帶來更高利潤率和更低單位收入運輸成本的高價值衍生產品,成長重心正轉向化合物領域。在印度土壤改良計畫和將高純度氧化鋅轉化為鋅空氣電池正極材料的先導工廠的推動下,化合物領域預計到2031年將以2.73%的複合年成長率成長,成為整個鋅市場中成長最快的細分領域之一。
到2025年,初級採礦和冶煉佔總產量的65.10%。這主要得益於紅狗礦、拉姆普拉阿古查礦和安塔米納礦等具有全球重要性的礦山,這些礦山供應雜質含量可靠的精礦。這些資產能夠促成長期精礦契約,支持下游一體化,並確保為與基礎設施建設相關的鍍鋅企業提供穩定的原料供應。然而,礦石品位下降和更嚴格的ESG(環境、社會和治理)資訊揭露規則正在推高維持性資本成本,而供應過剩時期加工效率的下降也對利潤率構成壓力。
同時,隨著廢鋼消耗量的成長,城市礦山原料供應增加,包括煉鋼粉塵、壓鑄廢料和電弧爐殘渣,二次生產正以每年2.55%的速度成長。歐盟和北美地區的回收網路每年已回收超過170萬噸殘渣,這使得回收商的總維修成本超過了大多數新建礦場。
此鋅報告按形態(精煉鋅(板條)、鋅合金等)、生產流程(初級生產(採礦和冶煉)和二級生產(回收))、應用(鍍鋅、壓鑄、黃銅等)、最終用戶行業(建築、運輸、電氣和電子等)以及地區(亞太地區、北美、歐洲、南美、中東和非洲)分析鋅市場。
區域分析
到2025年,亞太地區將佔全球出貨量的62.25%,預計到2031年將以每年2.38%的速度成長,這主要得益於中國的基礎建設規劃和印度不斷成長的化肥需求。當地冶煉廠享有向附近鋼廠運輸成本優勢,這有助於在礦石進口日益緊張的情況下增強區域自給自足能力。政府鼓勵低碳金屬的政策為早期採用者創造了溢價,從而強化了垂直整合營運商的競爭優勢。
儘管礦產資源長期短缺,北美仍是關鍵地區,美國對進口的依賴程度可透過阿拉斯加紅狗礦等戰略資產緩解。對赫莫薩礦計劃的投資標誌著政策轉向國內關鍵礦產生產能力,並可能推動2028年以後的貿易流量。加拿大和墨西哥可提供額外的礦產資源和冶煉能力,並利用接近性汽車和建築中心的優勢。
歐洲需求前景溫和,且日益注重價值驅動,汽車製造商和可再生能源開發商優先考慮經認證的低碳鋼坯。回收基礎設施實現了全球領先的回收率,並將再生金屬集中於主要鍍鋅產業叢集附近。能源價格波動仍是冶煉廠面臨的不利因素,但優質化學衍生支撐著特種出口市場。
在中東和非洲,由於尚比亞和奈米比亞工業區和礦產資源的開發,鋅需求正在加速成長。大規模海水淡化、電網升級和交通走廊建設都需要鍍鋅鋼,沿岸地區的投資者正專注於下游合金廠,以創造本地附加價值。在南美洲,秘魯和玻利維亞向亞洲冶煉廠供應優質精礦,從而維持了資源區和需求區之間平衡的鋅市場結構。
其他福利:
- Excel格式的市場預測(ME)表
- 3個月的分析師支持
目錄
第1章 引言
- 研究假設和市場定義
- 調查範圍
第2章調查方法
第3章執行摘要
第4章 市場情勢
- 市場概覽
- 市場促進因素
- 基礎建設主導鋅電鍍需求激增
- 耐腐蝕鋼在電動車和可再生能源領域的應用成長
- 使用大量鋅的電子設備的微型化
- 擴大鋅基肥料在缺乏微量元素的土壤中的使用
- 鋅離子電池和鋅空氣電池的出現
- 市場限制
- 嚴格的環境和ESG法規
- 由於供應過剩導致價格波動
- 鋁和複合材料替代
- 價值鏈分析
- 波特五力模型
- 供應商的議價能力
- 買方的議價能力
- 新進入者的威脅
- 替代品的威脅
- 競爭程度
第5章 市場規模與成長預測
- 按形式
- 精製鋅(板條)
- 鋅合金
- 鋅化合物(氧化物、硫酸鹽等)
- 再生/回收鋅
- 透過製造程序
- 初級生產(採礦和冶煉)
- 二次生產(回收利用)
- 透過使用
- 鍍鋅
- 壓鑄
- 黃銅
- 氧化鋅及化學品
- 其他用途
- 按最終用戶行業分類
- 建造
- 運輸
- 電氣和電子設備
- 消費品
- 其他終端用戶產業
- 地區
- 亞太地區
- 中國
- 印度
- 日本
- 韓國
- 印尼
- 馬來西亞
- 泰國
- 越南
- 亞太其他地區
- 北美洲
- 美國
- 加拿大
- 墨西哥
- 歐洲
- 法國
- 德國
- 義大利
- 北歐國家
- 俄羅斯
- 西班牙
- 土耳其
- 英國
- 其他歐洲地區
- 南美洲
- 巴西
- 阿根廷
- 哥倫比亞
- 其他南美洲
- 中東和非洲
- 沙烏地阿拉伯
- 阿拉伯聯合大公國
- 卡達
- 南非
- 埃及
- 奈及利亞
- 其他中東和非洲地區
- 亞太地區
第6章 競爭情勢
- 市場集中度
- 策略趨勢
- 市佔率分析
- 公司簡介
- Boliden Group
- Glencore
- Grupo Mexico
- Hindustan Zinc(Vedanta)
- Hudbay Minerals Inc.
- Korea Zinc
- MMG Australia Limited
- Nexa
- Nyrstar
- South32
- Teck Resources Limited
- Vedanta Limited
- Volcan
第7章 市場機會與未來展望
Zinc market size in 2026 is estimated at 13.99 Million tons, growing from 2025 value of 13.78 Million tons with 2031 projections showing 15.07 Million tons, growing at 1.5% CAGR over 2026-2031.
Infrastructure renewal across Asia-Pacific, breakthroughs in zinc-based batteries and rising use of zinc-fortified fertilizers are reshaping consumption patterns, offsetting slower growth in traditional galvanizing. Producers are balancing primary mining with secondary recovery to meet stricter ESG rules, while technology upgrades in smelting aim to curb emissions and improve margins. Supply surpluses have kept prices volatile, yet long-duration energy storage and agricultural biofortification point to fresh outlets that could tighten balances later in the decade. Competitive dynamics favor integrated players with both mine ownership and recycling capacity, positioning them to capture premium opportunities in sustainable applications.
Global Zinc Market Trends and Insights
Infrastructure-Led Galvanizing Demand Surge
Record infrastructure spending programs across emerging economies are translating directly into higher coated-steel offtake, lifting zinc demand even as residential real estate cools in China. Each USD 1 trillion allocated to roads, rail and power grids generates roughly 0.3 kg of zinc per dollar through galvanizing. Government green-infrastructure mandates add momentum because solar arrays and offshore wind towers rely on thick zinc coatings that ensure multi-decade corrosion protection. As a result, infrastructure accounts for more than half of projected incremental zinc demand to 2030, underpinning pricing during periods of mine-concentrate tightness and encouraging smelters to adopt low-carbon roasting and leaching technologies to secure environmental approvals.
Growth of Corrosion-Resistant Steel in EV and Renewables
Electric-vehicle makers and wind-turbine fabricators are shifting from conventional galvanizing toward zinc-aluminum-magnesium coatings that deliver longer service life at thinner coating weights, lifting the metal's value per kilogram even when volumes grow slowly. Premium EV platforms now specify zinc-rich layers for under-body components and battery housings to mitigate corrosion risk in high-voltage environments. Offshore wind structures intensify the pull because tower sections and transition pieces need coatings that withstand brine spray for more than 25 years, making zinc demand per megawatt roughly 40% higher than in fossil-fuel plants. As EV production tops 20 million units in 2025, each incremental point of market penetration embeds an additional 15-20 kilotons of zinc in the vehicle fleet. The premium commanded by specialized coatings supports smelter margins and encourages alloy makers to expand production capacity near automotive clusters.
Stringent Environmental and ESG Regulations
Air-emission limits and carbon-footprint disclosures are inflating compliance costs, particularly for smelters in Europe and North America where particulate thresholds now sit at 50 mg/dscm under updated U.S. EPA standards. The European Critical Raw Materials Act adds recycling quotas and due-diligence audits that favor operators able to certify low-carbon supply chains. Compliance spending raises operating costs by 5-8% but also filters out marginal, high-emission capacity, effectively tightening refined supply. Early adopters such as Hindustan Zinc monetize their advantage through branded low-carbon slabs that secure premiums in automotive tenders. Over the medium term, ESG stringency will reshape trade patterns as importers institute border-carbon mechanisms, compelling producers in all regions to accelerate decarbonization efforts.
Other drivers and restraints analyzed in the detailed report include:
- Zinc-Intensive Electronics Miniaturization
- Expansion of Zinc-Based Fertilizers in Micronutrient-Deficient Soils
- Material Substitution by Aluminum and Composites
For complete list of drivers and restraints, kindly check the Table Of Contents.
Segment Analysis
Refined output held 71.58% of total supply in 2025 as galvanizing lines favored standardized slabs for continuous-coil operations, locking in predictable off-take volumes across construction and auto sectors. This dominance shields producers from short-run demand shocks because contract logistics, quality assurance and credit terms are already embedded in long-standing supply chains that span mines, smelters and coil coaters. The refined slice of the zinc market therefore underpins working-capital planning for smelters that must move metal quickly to manage concentrate payables.
Growth, however, is tilting toward compounds as fertilizer blenders, electronics makers and battery innovators seek value-added derivatives that lift margins and cut shipping costs per dollar of revenue. A 2.73% CAGR through 2031 places compounds among the fastest-rising niches in the broader zinc market, helped by India's push to fortify soils and by pilot plants that turn high-purity oxide into zinc-air cathodes.
Primary mining and smelting accounted for 65.10% of 2025 tonnage, anchored by globally significant operations such as Red Dog, Rampura Agucha and Antamina that deliver concentrates with reliable impurity profiles. These assets enable long-term concentrate contracts that support downstream integration and provide feedstock security for galvanizers tied to infrastructure roll-outs. Even so, mine-grade deterioration and stricter ESG disclosure rules are inflating sustaining capital costs, pinching margins when spot treatment charges soften in surplus years.
Secondary production is meanwhile advancing 2.55% a year as urban-mine flows of steel-making dust, die-cast scrap and EAF residues expand in line with scrap-steel consumption. Collection networks across the European Union and North America already divert more than 1.7 million t of residues annually, giving recyclers a cost base that beats most greenfield mines on an all-in-sustaining-cost basis.
The Zinc Report is Segmented by Form (Refined Zinc (Slab), Zinc Alloys, and More), Production Process (Primary Production (Mining and Smelting) and Secondary Production (Recycling)), Application (Galvanizing, Die-Casting, Brass, and More), End-User Industry (Construction, Transportation, Electrical and Electronics, and More), and Geography (Asia-Pacific, North America, Europe, South America, and Middle-East and Africa).
Geography Analysis
Asia-Pacific controlled 62.25% of global shipments in 2025 and will expand by 2.38% annually to 2031, propelled by China's infrastructure pipeline and India's fertilizer push. Local smelters enjoy freight advantages to neighboring steel mills, strengthening regional self-sufficiency even as concentrate imports tighten. Government directives that favor low-carbon metal add premium layers for early adopters, reinforcing competitive moats for vertically integrated players.
North America maintains a meaningful role despite chronic concentrate deficits, with U.S. import reliance offset by strategic assets such as Red Dog in Alaska. Investment in the Hermosa project signals a policy turn toward domestic critical-mineral capacity, which could shift trade flows after 2028. Canada and Mexico provide additional mine supply and smelting output, leveraging proximity to automotive and construction hubs.
Europe's demand outlook is moderate but increasingly value-oriented, as automakers and renewable developers prioritize certified low-carbon slabs. Recycling infrastructure yields some of the globe's highest recovery ratios, keeping secondary metal close to major galvanizing clusters. Energy-price volatility remains a headwind for smelters; nonetheless, premium-grade chemical derivatives anchor specialty export niches.
Middle-East and Africa post accelerating demand tied to industrial-zone build-outs and mineral-resource development in Zambia and Namibia. Large-scale desalination, power-grid upgrades and transport corridors call for galvanized steel, while Gulf-based investors eye downstream alloy plants to add local value. South America rounds out the global map with Peru and Bolivia supplying high-grade concentrates to Asian smelters, sustaining a balanced portfolio of resource and demand centers for the zinc market.
- Boliden Group
- Glencore
- Grupo Mexico
- Hindustan Zinc (Vedanta)
- Hudbay Minerals Inc.
- Korea Zinc
- MMG Australia Limited
- Nexa
- Nyrstar
- South32
- Teck Resources Limited
- Vedanta Limited
- Volcan
Additional Benefits:
- The market estimate (ME) sheet in Excel format
- 3 months of analyst support
TABLE OF CONTENTS
1 Introduction
- 1.1 Study Assumptions and Market Definition
- 1.2 Scope of the Study
2 Research Methodology
3 Executive Summary
4 Market Landscape
- 4.1 Market Overview
- 4.2 Market Drivers
- 4.2.1 Infrastructure-led galvanizing demand surge
- 4.2.2 Growth of corrosion-resistant steel in EV and renewables
- 4.2.3 Zinc-intensive electronics miniaturisation
- 4.2.4 Expansion of zinc-based fertilisers in micronutrient-deficient soils
- 4.2.5 Emergence of zinc-ion and zinc-air batteries
- 4.3 Market Restraints
- 4.3.1 Stringent environmental and ESG regulations
- 4.3.2 Price volatility from supply surpluses
- 4.3.3 Material substitution by aluminium and composites
- 4.4 Value Chain Analysis
- 4.5 Porter's Five Forces
- 4.5.1 Bargaining Power of Suppliers
- 4.5.2 Bargaining Power of Buyers
- 4.5.3 Threat of New Entrants
- 4.5.4 Threat of Substitutes
- 4.5.5 Degree of Competition
5 Market Size and Growth Forecasts (Volume)
- 5.1 By Form
- 5.1.1 Refined Zinc (Slab)
- 5.1.2 Zinc Alloys
- 5.1.3 Zinc Compounds (Oxide, Sulfate, etc.)
- 5.1.4 Secondary/Recycled Zinc
- 5.2 By Production Process
- 5.2.1 Primary Production (Mining and Smelting)
- 5.2.2 Secondary Production (Recycling)
- 5.3 By Application
- 5.3.1 Galvanizing
- 5.3.2 Die-Casting
- 5.3.3 Brass
- 5.3.4 Zinc Oxide and Chemicals
- 5.3.5 Other Applications
- 5.4 By End-User Industry
- 5.4.1 Construction
- 5.4.2 Transportation
- 5.4.3 Electrical and Electronics
- 5.4.4 Consumer Goods
- 5.4.5 Other End-user Industries
- 5.5 Geography
- 5.5.1 Asia-Pacific
- 5.5.1.1 China
- 5.5.1.2 India
- 5.5.1.3 Japan
- 5.5.1.4 South Korea
- 5.5.1.5 Indonesia
- 5.5.1.6 Malaysia
- 5.5.1.7 Thailand
- 5.5.1.8 Vietnam
- 5.5.1.9 Rest of Asia-Pacific
- 5.5.2 North America
- 5.5.2.1 United States
- 5.5.2.2 Canada
- 5.5.2.3 Mexico
- 5.5.3 Europe
- 5.5.3.1 France
- 5.5.3.2 Germany
- 5.5.3.3 Italy
- 5.5.3.4 Nordic Countries
- 5.5.3.5 Russia
- 5.5.3.6 Spain
- 5.5.3.7 Turkey
- 5.5.3.8 United Kingdom
- 5.5.3.9 Rest of Europe
- 5.5.4 South America
- 5.5.4.1 Brazil
- 5.5.4.2 Argentina
- 5.5.4.3 Colombia
- 5.5.4.4 Rest of South America
- 5.5.5 Middle-East and Africa
- 5.5.5.1 Saudi Arabia
- 5.5.5.2 United Arab Emirates
- 5.5.5.3 Qatar
- 5.5.5.4 South Africa
- 5.5.5.5 Egypt
- 5.5.5.6 Nigeria
- 5.5.5.7 Rest of Middle-East and Africa
- 5.5.1 Asia-Pacific
6 Competitive Landscape
- 6.1 Market Concentration
- 6.2 Strategic Moves
- 6.3 Market Share Analysis
- 6.4 Company Profiles (includes Global level Overview, Market level overview, Core Segments, Financials as available, Strategic Information, Market Rank/Share for key companies, Products and Services, Recent Developments)
- 6.4.1 Boliden Group
- 6.4.2 Glencore
- 6.4.3 Grupo Mexico
- 6.4.4 Hindustan Zinc (Vedanta)
- 6.4.5 Hudbay Minerals Inc.
- 6.4.6 Korea Zinc
- 6.4.7 MMG Australia Limited
- 6.4.8 Nexa
- 6.4.9 Nyrstar
- 6.4.10 South32
- 6.4.11 Teck Resources Limited
- 6.4.12 Vedanta Limited
- 6.4.13 Volcan
7 Market Opportunities and Future Outlook
- 7.1 White-space and Unmet-Need Assessment
 2026-2030年全球高純度鋅市場
 無機鋅塗佈市場機會、成長要素、產業趨勢分析及2026-2035年預測。
 全球丁香酚鋅市場規模、佔有率、趨勢和成長分析報告(2026-2034)
 ZDDP添加劑市場:依基礎油類型、添加劑形式、鋅濃度、應用和分銷管道分類-2026-2032年全球預測鋅市場:全球鋅市場預測(依產品類型、形態、應用、終端用戶產業和分銷管道分類)-2026年至2032年鍍鋅市場:依技術、製程、鍍層厚度、基材及應用分類-2026年至2032年全球預測
 2026年全球銅、鎳、鉛和鋅市場報告2026年全球鋅市場報告2026年全球熱鍍鋅市場報告2026年全球檸檬酸鋅市場報告