


 |
市場調查報告書
商品編碼
1934861
白銀:市場佔有率分析、產業趨勢與統計、成長預測(2026-2031)Silver - Market Share Analysis, Industry Trends & Statistics, Growth Forecasts (2026 - 2031) |
||||||
※ 本網頁內容可能與最新版本有所差異。詳細情況請與我們聯繫。
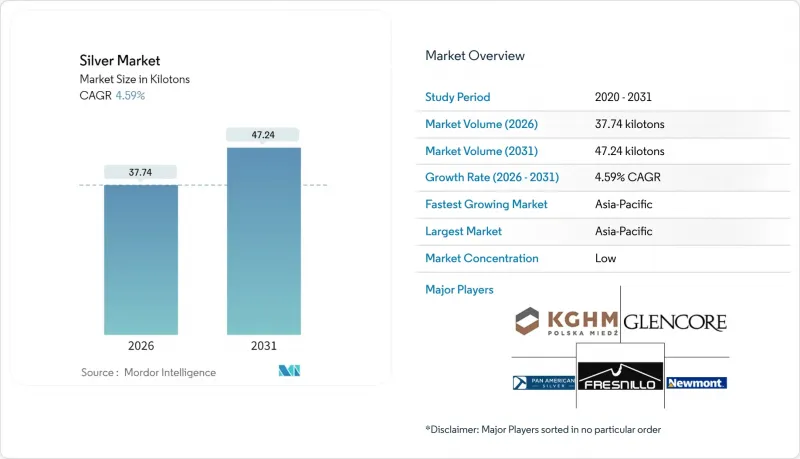
2025 年白銀市場價值為 36.08 千噸,預計從 2026 年的 37.74 千噸成長到 2031 年的 47.24 千噸,在預測期(2026-2031 年)內複合年成長率為 4.59%。
白銀需求的擴張反映了其作為貴金屬和重要工業原料的雙重角色,預計2024年總需求量將達到約12億盎司,創歷史第二高。自2021年以來,供不應求(2024年缺口達2.15億盎司),導致庫存趨緊,改變了以往主要受裸金屬投資情緒驅動的價格機制。電子設備的微型化、太陽能光伏發電裝置的快速擴張以及新興的抗菌應用,增強了白銀終端用途的多樣性,使其免受單一行業波動的影響。然而,礦山廢水監管的持續壓力以及白銀於2025年8月被列為美國關鍵礦產,都預示著白銀的供應環境不如其他工業金屬那樣具有韌性,這進一步凸顯了二次回收途徑的重要性。
全球白銀市場趨勢與洞察
電子設備小型化和對5G組件的需求
專為 5G 設計的通訊設備,其每台設備使用的銀量約為 4G 設備的 3 到 5 倍,因為高頻率需要更低電阻的互連線。半導體裝置尺寸的縮小反而增加了每顆晶片的銀用量,因為較小的結構增加了導體的數量和先進的熱界面。系統級封裝 (SiP) 和 3D 晶片堆疊技術正在拓展銀的應用範圍,使其超越傳統的焊線。同時,邊緣運算和人工智慧工作負載需要極高的功率密度,而只有銀的高導熱性才能有效滿足這些需求。電動車 (EV) 的普及也推動了這一成長。每輛電池式電動車含有 25 到 50 克銀,遠高於內燃機汽車(15 到 28 克)。隨著高階汽車製造商將高級駕駛輔助系統 (ADAS) 作為標配,額外的雷達、雷射雷達和高速數據線將進一步增加銀的使用量。
光電設施快速擴張,實現大規模太陽能發電
隨著業界從PERC技術向高耗銀量的TOPCon和異質結設計轉型,預計太陽能電池的工業白銀需求將從2015年的6,000萬盎司成長到2024年的2.32億盎司。下一代雙面組件每塊面板所需的銀膠將增加高達20%,僅在2025年上半年,中國市場的主要製造商就新增了212吉瓦的裝置容量。雖然公用事業開發傾向於使用更大尺寸的矽晶圓,這可以略微降低每瓦的白銀消耗量,但由於裝機量的成長速度遠超效率提升速度,總消耗量仍在上升。國際能源總署(IEA)的淨零排放情境預測,到2030年,每年需要新增630吉瓦的太陽能裝置容量,這意味著每年需要3億至4億盎司的白銀。美國、印度和歐盟的在地採購政策正在重塑區域籌資策略,並加劇白銀現貨價格對採礦中斷的敏感度。
限制採礦業重金屬排放
美國環保署 (EPA) 目前將廢水中銀的濃度限制在每月 0.0122 毫克/公升以內,這要求礦業公司安裝高成本的水處理系統,並將許可證有效期延長至多 15 年。加拿大、澳洲和歐盟 (EU) 的類似標準增加了環境管理評估區域內計劃的資本密集度。由於 72% 的原生銀供應來自基底金屬開採,營運商正在權衡遵守銀礦法規的成本與銅鋅礦的收益,在某些情況下,這導致他們推遲了擴張計劃。在水資源緊張地區實施的新的零液體排放強制令進一步增加了複雜性,提高了製程用水的循環利用要求,可能使整個計劃的水循環利用成本翻倍。歷史遺留問題也是一個重要議題。一些生產商將高達 20% 的年度自由現金流用於修復儲備金,從而減少了可用於白銀市場現有礦區探勘的資金。
細分市場分析
到2025年,純銀將佔據白銀市場71.61%的佔有率,這主要得益於純度達到99.9%或更高的純銀,其符合電子產品、光伏和醫療設備嚴格的導電性和耐腐蝕性標準。此細分市場的優勢在於其完善的提煉基礎設施,能夠提供穩定的產品等級,使原始設備製造商(OEM)能夠在跨國生產基地簡化品管通訊協定。大學主導的基於脂肪酸的溶解技術研究有望提高二次回收率,從而在不相應擴大採礦規模的情況下增加純銀的供應量。這些創新有望幫助大型太陽能板製造商降低投入成本,這些製造商每年已消耗數千噸白銀。同時,隨著奢華珠寶品牌和手工製造商採用Argentium銀卓越的抗氧化性,建立高利潤產品線並證明其高昂原料投入的合理性,預計到2031年,Argentium銀的複合年成長率將達到4.68%。
純銀的優勢因可再生能源設施和半導體產能的擴張而進一步增強,這兩者都需要高純度銀來防止裝置在嚴苛的熱循環條件下失效。因此,隨著亞太和歐洲各國脫碳目標的推進,純銀市場規模預計將持續擴大。 Argentium銀的需求成長主要得益於客製化設計和3D列印珠寶產業的需求,以及電子商務平台推動的直接面對消費者銷售模式的發展。然而,其總銷量仍然相對小規模。硬幣銀和各種特種合金佔據了諸如錢幣收藏、硬焊和抗菌表面處理等細分市場,佔該細分市場收入的不到10%,但在那些具有獨特性能、足以支撐溢價的領域,它們能夠提供特別高的利潤率。
白銀市場報告按類型(純銀、標準銀、銀幣、其他)、應用(實體投資、電氣和電子設備、攝影膠片、硬焊合金和焊料、珠寶飾品和銀器、醫藥和生物醫學、其他)和地區(亞太地區、北美、歐洲、南美、中東和非洲)進行細分。
區域分析
亞太地區2025年57.35%的消費佔有率凸顯了該地區作為白銀市場製造地和可再生能源中心的位置。中國在2025年上半年新增212吉瓦太陽能光電裝置容量,凸顯了該地區對白銀密集技術的強勁需求。印度珠寶飾品需求的強勁成長和電子產品組裝的興起將進一步推動這一需求,而韓國和日本的高精度半導體和感測器製造也將帶動需求。各國政府正優先發展戰略材料的國內供應鏈,並鼓勵投資興建回收設施,以回收消費性電子產品和太陽能光電模組中的廢銀,從而增強供應安全。
北美市場的需求日趨成熟,但同時也不斷演變,這主要得益於汽車電氣化、資料中心擴張和醫療設備製造的推動。美國決定2025年8月將白銀列為關鍵礦產,此舉可望透過簡化採礦許可流程和開闢戰略儲備的可能性,改變白銀市場動態。加拿大成熟的裸金屬提煉體系和墨西哥的大型原生銀礦為整個北美大陸的加工商提供了持續的供應優勢。歐洲的消費則受到積極的淨零排放目標的支撐,這些目標要求快速部署太陽能,同時相關法規也促進了循環經濟實踐,從而推動了對電子廢棄物收集和金屬回收工廠的投資。
南美洲在白銀供應方面仍然至關重要,秘魯、墨西哥和智利三國合計貢獻了全球超過三分之一的白銀產量。然而,由於當地民眾的反對、用水限制和特許權使用費糾紛,擴張計畫面臨許多挑戰。儘管中東和非洲地區目前僅佔全球白銀需求的一小部分,但醫療基礎設施的擴建和電信網路的升級正在推動白銀需求的成長。許多非洲國家擁有尚未開發的白銀礦床,如果按照負責任的採礦標準進行開發,預計將在未來十年內實現全球白銀供應的多元化。
其他福利:
- Excel格式的市場預測(ME)表
- 3個月的分析師支持
目錄
第1章 引言
- 研究假設和市場定義
- 調查範圍
第2章調查方法
第3章執行摘要
第4章 市場情勢
- 市場概覽
- 市場促進因素
- 電子設備小型化和對5G組件的需求
- 光電設施快速擴張,實現大規模太陽能發電
- 新興醫療領域中照相和X光膠片的回收利用
- 包裝食品中銀基抗菌塗層的興起
- 擴大投資需求以對沖通貨膨脹
- 市場限制
- 採礦業重金屬排放的監理限值
- 互連線中鋁/銅取代銀
- 價格波動劇烈不利於簽訂長期合約。
- 價值鏈分析
- 監管環境
- 波特五力模型
- 供應商的議價能力
- 買方的議價能力
- 新進入者的威脅
- 替代品的威脅
- 競爭程度
第5章 市場規模與成長預測
- 按類型
- 純銀
- 純銀
- 銀
- 銀幣
- 其他類型
- 透過使用
- 實物投資(白銀裸金屬和銀幣)
- 電氣和電子設備
- 攝影膠卷
- 釬焊硬焊料和焊料
- 珠寶飾品和銀器
- 製藥和生物醫學
- 其他用途
- 按地區
- 生產分析
- 美國
- 阿根廷
- 澳洲
- 玻利維亞
- 智利
- 中國
- 印度
- 墨西哥
- 秘魯
- 波蘭
- 俄羅斯
- 世界其他地區
- 消費分析
- 亞太地區
- 中國
- 印度
- 日本
- 韓國
- 亞太其他地區
- 北美洲
- 美國
- 加拿大
- 墨西哥
- 歐洲
- 德國
- 英國
- 義大利
- 法國
- 俄羅斯
- 其他歐洲地區
- 南美洲
- 巴西
- 阿根廷
- 其他南美洲
- 中東和非洲
- 沙烏地阿拉伯
- 南非
- 其他中東和非洲地區
- 亞太地區
- 生產分析
第6章 競爭情勢
- 市場集中度
- 策略趨勢
- 市佔率/排名分析
- 公司簡介
- Americas Gold & Silver Corporation
- Avino Silver & Gold Mines Ltd.
- Coeur Mining, Inc.
- First Majestic Silver Corp.
- Fortuna Silver Mines Inc.
- Fresnillo plc
- Glencore
- Hecla Mining Company
- Hindustan Zinc
- Hochschild Mining PLC
- Honey Badger Silver Inc
- IMPACT Silver Corp.
- Industrias Penoles
- KGHM
- MAG Silver Corp
- Newmont Corporation
- Orla Mining Ltd.
- Pan American Silver Corp
- Polymetal International plc
- Royal Gold Inc.
- Silvercorp Metals Inc.
- SSR Mining Inc.
- Wheaton Precious Metals Corp.
第7章 市場機會與未來展望
The Silver Market was valued at 36.08 kilotons in 2025 and estimated to grow from 37.74 kilotons in 2026 to reach 47.24 kilotons by 2031, at a CAGR of 4.59% during the forecast period (2026-2031).
The expansion reflects silver's dual role as a precious asset and an indispensable industrial input that pushed total demand to nearly 1.2 billion ounces in 2024-the second-highest annual level on record. Five consecutive annual supply deficits since 2021, including a 215 million-ounce shortfall in 2024, have tightened inventories and altered pricing signals that once relied mainly on bullion investment sentiment. Electronics miniaturization, rapid photovoltaic (PV) build-outs, and emerging antimicrobial uses are reinforcing end-use diversity and buffering the silver industry from single-sector swings. Ongoing regulatory pressure on mine effluents, coupled with silver's August 2025 designation as a U.S. critical mineral, underscores a supply landscape that is less elastic than most industrial metals, intensifying the importance of secondary recovery channels.
Global Silver Market Trends and Insights
Electronics Miniaturization and 5G Component Demand
Telecommunications hardware built for 5G uses roughly three to five times more silver per unit than 4G equivalents, as higher frequencies require low-resistance interconnects. Semiconductor device scaling paradoxically raises silver intensity per chip because finer geometries call for more conductors and advanced thermal interfaces. System-in-package and three-dimensional chip stacking widen silver's role beyond traditional wire bonding, while edge-computing and AI workloads push power densities that only silver's high thermal conductivity can manage effectively. Electric vehicles add momentum; each battery electric model contains 25-50 grams of silver compared with 15-28 grams in internal-combustion cars. As premium automakers standardize advanced driver-assistance systems, additional radar, lidar and high-speed data lines further elevate silver use.
Rapid PV Build-out for Utility-Scale Solar
Industrial silver demand from solar cells climbed from 60 million ounces in 2015 to 232 million ounces in 2024 as the industry shifted from PERC to silver-intensive TOPCon and heterojunction designs. Next-generation bifacial modules require up to 20% more silver paste per panel, and market-leading manufacturers in China installed 212 GW of capacity in the first half of 2025 alone. Utility developers favor larger wafers that modestly improve silver-per-watt metrics, yet total consumption rises because deployment volumes vastly outpace efficiency gains. International Energy Agency net-zero pathways call for annual solar additions of 630 GW through 2030, implying PV demand of 300-400 million ounces per year. Localization policies in the United States, India, and the European Union are reshaping regional sourcing strategies and reinforcing silver market spot-price sensitivity to mining disruptions.
Regulatory Caps on Heavy-Metal Discharge in Mining
The U.S. Environmental Protection Agency now limits silver concentrations in effluent to 0.0122 mg/L monthly, compelling miners to install costly water-treatment systems and extending permitting timelines to as long as 15 years. Similar standards in Canada, Australia, and the European Union increase capital intensity for projects in jurisdictions respected for environmental stewardship. Because 72% of the primary silver supply is a byproduct of base-metal mining, operators often weigh silver compliance costs against copper or zinc revenues, occasionally delaying expansions. Emerging zero-liquid-discharge mandates in water-stressed regions add further complexity by raising process-water recycling requirements that can double overall project water-circulation costs. Legacy liabilities are material as well; some producers channel up to 20% of annual free cash flow toward remediation provisions, diminishing funds available for brown-field exploration in the silver market.
Other drivers and restraints analyzed in the detailed report include:
- Recovery of Photographic/X-ray Film Usage in Emerging Healthcare
- Emergence of Silver-Based Antimicrobial Coatings for Packaged Foods
- Silver Substitution by Aluminum and Copper in Wiring
For complete list of drivers and restraints, kindly check the Table Of Contents.
Segment Analysis
Fine Silver accounted for 71.61% of the silver market share in 2025, thanks to its minimum 99.9% purity that satisfies stringent conductivity and corrosion-resistance standards in electronics, photovoltaics, and medical devices. The segment benefits from established refining infrastructure that delivers consistent product grades, allowing OEMs to streamline quality protocols across multinational production footprints. University-led research into fatty-acid-based dissolution technologies promises to lift secondary recovery rates, improving Fine Silver availability without proportionate mining expansion. These innovations could moderate input costs for large PV pastemakers who already consume thousands of metric tons annually. Meanwhile, Argentium Silver is projected to grow at 4.68% CAGR through 2031 as luxury jewelry brands and artisan manufacturers adopt its enhanced tarnish resistance, leading to higher-margin product lines that justify premium raw-material inputs.
Fine Silver's commanding position is reinforced by expanding renewable-energy installations and semiconductor capacity additions, both of which specify high-purity silver to prevent device failure under demanding thermal cycles. The silver market size for Fine Silver is therefore set to widen in tandem with national decarbonization targets across Asia-Pacific and Europe. Argentium's appeal in custom design and 3D-printed jewelry also taps growth in e-commerce platforms that enable direct-to-consumer sales, although its overall volume remains comparatively small. Coin Silver and various specialty alloys occupy niche spaces in coinage, brazing and antimicrobial surfaces, collectively capturing less than 10% of segment revenues yet offering outsized margins where unique property sets warrant price premiums.
The Silver Market Report is Segmented by Type (Fine Silver, Sterling Silver, Argentium Silver, Coin Silver, Other Types), Application (Physical Investment, Electrical and Electronics, Photographic Films, Brazing Alloys and Solders, Jewelry and Silverware, Pharmaceuticals and Biomedical, Other Applications), and Geography (Asia-Pacific, North America, Europe, South America, Middle-East and Africa).
Geography Analysis
Asia-Pacific's 57.35% consumption share in 2025 underscores its status as both manufacturing hub and renewable-energy epicenter within the silver market. China's installation of 212 GW of solar capacity in just six months of 2025 exemplifies the region's appetite for silver-intensive technologies. India complements with vigorous jewelry demand and rising electronics assembly, while South Korea and Japan add high-precision semiconductor and sensor fabrication. Regional governments prioritize domestic supply chains for strategic materials, catalyzing investments in recycling facilities that can capture end-of-life silver from appliances and PV modules, thereby reinforcing supply security.
North America exhibits mature yet evolving demand anchored by automotive electrification, data-center build-outs and medical-device manufacturing. The U.S. decision in August 2025 to classify silver as a critical mineral paves the way for streamlined mine permitting and possible strategic stockpiles that could alter silver market dynamics. Canada's established bullion-refining ecosystem and Mexico's large primary-silver mines provide contiguous supply advantages that support downstream fabricators across the continent. European consumption is buoyed by aggressive net-zero targets that require rapid solar deployment, and by regulations that promote circular-economy practices, spurring investment in e-waste collection and metal recovery plants.
South America remains integral on the supply front; Peru, Mexico and Chile collectively deliver more than one-third of mined output, yet community opposition, water-use restrictions and royalty debates challenge expansion plans. In the silver market, the Middle East and Africa account for a small share of global demand today, but healthcare infrastructure build-outs and telecom network upgrades are translating into incremental silver requirements. Many African nations hold untapped silver prospects that, if developed under responsible mining standards, could diversify global supply over the next decade.
- Americas Gold & Silver Corporation
- Avino Silver & Gold Mines Ltd.
- Coeur Mining, Inc.
- First Majestic Silver Corp.
- Fortuna Silver Mines Inc.
- Fresnillo plc
- Glencore
- Hecla Mining Company
- Hindustan Zinc
- Hochschild Mining PLC
- Honey Badger Silver Inc
- IMPACT Silver Corp.
- Industrias Penoles
- KGHM
- MAG Silver Corp
- Newmont Corporation
- Orla Mining Ltd.
- Pan American Silver Corp
- Polymetal International plc
- Royal Gold Inc.
- Silvercorp Metals Inc.
- SSR Mining Inc.
- Wheaton Precious Metals Corp.
Additional Benefits:
- The market estimate (ME) sheet in Excel format
- 3 months of analyst support
TABLE OF CONTENTS
1 Introduction
- 1.1 Study Assumptions and Market Definition
- 1.2 Scope of the Study
2 Research Methodology
3 Executive Summary
4 Market Landscape
- 4.1 Market Overview
- 4.2 Market Drivers
- 4.2.1 Electronics miniaturisation and 5G component demand
- 4.2.2 Rapid PV build-out for utility-scale solar
- 4.2.3 Recovery of photographic/X-ray film usage in emerging healthcare
- 4.2.4 Emergence of silver-based antimicrobial coatings for packaged foods
- 4.2.5 Growing investment demand amid inflation-hedging
- 4.3 Market Restraints
- 4.3.1 Regulatory caps on heavy-metal discharge in mining
- 4.3.2 Silver substitution by aluminium/copper in wiring
- 4.3.3 High price volatility discouraging long-term contracts
- 4.4 Value Chain Analysis
- 4.5 Regulatory Landscape
- 4.6 Porter's Five Forces
- 4.6.1 Bargaining Power of Suppliers
- 4.6.2 Bargaining Power of Buyers
- 4.6.3 Threat of New Entrants
- 4.6.4 Threat of Substitutes
- 4.6.5 Degree of Competition
5 Market Size and Growth Forecasts (Volume)
- 5.1 By Type
- 5.1.1 Fine Silver
- 5.1.2 Sterling Silver
- 5.1.3 Argentium Silver
- 5.1.4 Coin Silver
- 5.1.5 Other Types
- 5.2 By Application
- 5.2.1 Physical Investment (Bars and Coins)
- 5.2.2 Electrical and Electronics
- 5.2.3 Photographic Films
- 5.2.4 Brazing Alloys and Solders
- 5.2.5 Jewelry and Silverware
- 5.2.6 Pharmaceuticals and Biomedical
- 5.2.7 Other Applications
- 5.3 By Geography
- 5.3.1 Production Analysis
- 5.3.1.1 United States
- 5.3.1.2 Argentina
- 5.3.1.3 Australia
- 5.3.1.4 Bolivia
- 5.3.1.5 Chile
- 5.3.1.6 China
- 5.3.1.7 India
- 5.3.1.8 Mexico
- 5.3.1.9 Peru
- 5.3.1.10 Poland
- 5.3.1.11 Russia
- 5.3.1.12 Rest of the World
- 5.3.2 Consumption Analysis
- 5.3.2.1 Asia-Pacific
- 5.3.2.1.1 China
- 5.3.2.1.2 India
- 5.3.2.1.3 Japan
- 5.3.2.1.4 South Korea
- 5.3.2.1.5 Rest of Asia-Pacific
- 5.3.2.2 North America
- 5.3.2.2.1 United States
- 5.3.2.2.2 Canada
- 5.3.2.2.3 Mexico
- 5.3.2.3 Europe
- 5.3.2.3.1 Germany
- 5.3.2.3.2 United Kingdom
- 5.3.2.3.3 Italy
- 5.3.2.3.4 France
- 5.3.2.3.5 Russia
- 5.3.2.3.6 Rest of Europe
- 5.3.2.4 South America
- 5.3.2.4.1 Brazil
- 5.3.2.4.2 Argentina
- 5.3.2.4.3 Rest of South America
- 5.3.2.5 Middle-East and Africa
- 5.3.2.5.1 Saudi Arabia
- 5.3.2.5.2 South Africa
- 5.3.2.5.3 Rest of Middle-East and Africa
- 5.3.2.1 Asia-Pacific
- 5.3.1 Production Analysis
6 Competitive Landscape
- 6.1 Market Concentration
- 6.2 Strategic Moves
- 6.3 Market Share**/Ranking Analysis
- 6.4 Company Profiles (includes Global level Overview, Market level overview, Core Segments, Financials as available, Strategic Information, Market Rank/Share for key companies, Products and Services, and Recent Developments)
- 6.4.1 Americas Gold & Silver Corporation
- 6.4.2 Avino Silver & Gold Mines Ltd.
- 6.4.3 Coeur Mining, Inc.
- 6.4.4 First Majestic Silver Corp.
- 6.4.5 Fortuna Silver Mines Inc.
- 6.4.6 Fresnillo plc
- 6.4.7 Glencore
- 6.4.8 Hecla Mining Company
- 6.4.9 Hindustan Zinc
- 6.4.10 Hochschild Mining PLC
- 6.4.11 Honey Badger Silver Inc
- 6.4.12 IMPACT Silver Corp.
- 6.4.13 Industrias Penoles
- 6.4.14 KGHM
- 6.4.15 MAG Silver Corp
- 6.4.16 Newmont Corporation
- 6.4.17 Orla Mining Ltd.
- 6.4.18 Pan American Silver Corp
- 6.4.19 Polymetal International plc
- 6.4.20 Royal Gold Inc.
- 6.4.21 Silvercorp Metals Inc.
- 6.4.22 SSR Mining Inc.
- 6.4.23 Wheaton Precious Metals Corp.
7 Market Opportunities and Future Outlook
- 7.1 White-space and Unmet-Need Assessment
 全球鹵化銀市場規模、佔有率、趨勢和成長分析報告(2026-2034年)
 2026-2030年全球硝酸銀市場
 碘化銀:市場佔有率分析、產業趨勢與統計、成長預測(2026-2031)
 硝酸銀市場:依等級、應用、終端用戶產業、銷售管道和地區分類。
 碘化銀市場:依形態、等級、純度、通路和應用分類-2026-2032年全球市場預測膠體銀市場:依粒徑、形態、應用、通路、終端用戶產業及地區分類
 2026年全球硝酸銀市場報告
 輝石礦市場規模、佔有率和成長分析:按產品類型、形態、應用、終端用戶產業、純度、分銷管道和地區分類-產業預測,2026-2033年汞測試接觸器市場按產品類型、應用、最終用戶、安裝類型和接點材料分類 - 全球預測,2026-2032年2026年全球銀礦市場報告