


 |
市場調查報告書
商品編碼
1934783
美國校車市佔率分析、產業趨勢與統計、成長預測(2026-2031)United States School Bus - Market Share Analysis, Industry Trends & Statistics, Growth Forecasts (2026 - 2031) |
||||||
※ 本網頁內容可能與最新版本有所差異。詳細情況請與我們聯繫。
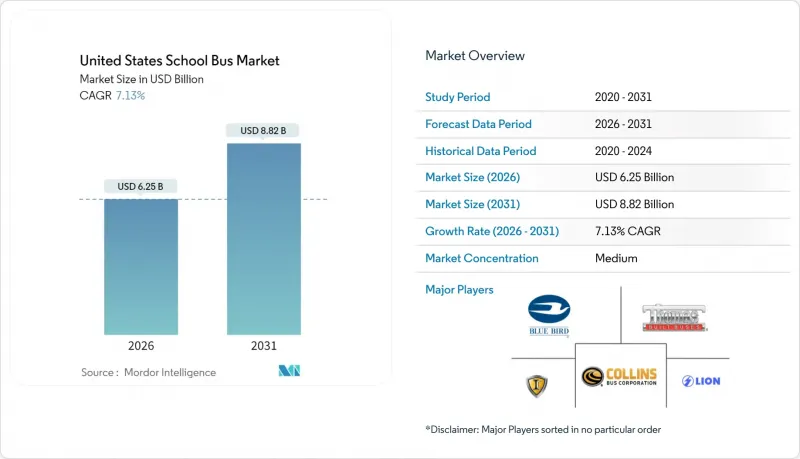
2025年美國校車市場價值58.3億美元,預計2031年將達到88.2億美元,高於2026年的62.5億美元。
預計在預測期(2026-2031 年)內,複合年成長率將達到 7.13%。
隨著科技進步,電動校車的出現凸顯了保護環境和造福子孫後代的決心。預計向電池式電動車的快速轉型以及創新的低氮氧化物排放解決方案將顯著加速電動校車的普及。同時,美國國家公路交通安全管理局 (NHTSA) 加強的安全標準以及各州對零排放車輛採購期限的設定,正在加速先前推遲的車輛更新換代決策。業內相關人員正在努力平衡短期挑戰(例如底盤短缺、技術人員培訓困難以及充電基礎設施不完善)與長期機會(例如V2G收入來源和基於站點的微電網,這些都能顯著降低總體擁有成本)。
美國校車市場趨勢與洞察
美國環保署清潔校車計畫的聯邦資金激增
美國環保署的清潔校車計畫正在改變採購經濟格局,該計畫為電池電動校車提供高達80%的增量成本補貼,激勵學區加快升級換代步伐,超越傳統的折舊免稅額週期。優先評分機制確保45%的資金流向低收入社區和美洲原住民社區,從而在歷來受低稅基限制的市場中形成普及叢集。預計在2026年該計畫結束前,這波由補貼驅動的需求浪潮將達到高峰,縮短採購時間,並加劇生產名額的競爭。這促使原始設備製造商(OEM)和電池供應商與公共產業合作,簡化充電基礎設施的部署,同時擴大國內生產能力。
全國老舊的公車車隊(車齡超過11年)推動了對新車的需求。
目前,公車的平均車齡已超過11年,遠超過聯邦交通管理局規定的12年或50萬英里的使用年限。這導致大量公車積壓,需要在五年內更換。延期維修成本飆升,尤其是在中西部地區,嚴寒的冬季會加速腐蝕。電動車型的維護成本約為每英里0.40美元,而柴油車型則為0.70美元,因此,更高的購置價格可以透過12年生命週期內更低的維護成本來抵消。擁有最老舊車隊的農村地區正在評估電氣化基礎設施津貼,同時也正在探索使用丙烷或壓縮天然氣的過渡方案。原始設備製造商(OEM)正在推出模組化電動底盤,這些底盤可以重複利用現有的C型佈局,從而縮短當地維修人員的學習曲線。這些車輛的到期日和補助金計畫的推出,都支撐了美國校車市場強勁的成長前景。
農村地區充電基礎設施不足
農村學區公共充電樁密度低——比都市區低五到十倍——這使得長途路線規劃變得複雜。伊利諾州的威廉斯菲爾德學區透過建造校內微電網克服了這項挑戰,目前該微電網能夠滿足其94%的能源需求。然而,大多數農村學區缺乏技術人員和電力公司的合作,無法複製這種模式。 《基礎建設投資與就業法案》撥款12.5億美元用於農村電動車基礎建設。然而,由於計劃前置作業時間超過了即時的升級週期,資金到位存在時間上的偏差。在3級充電樁普及之前,美國校車市場的電氣化進程預計將會放緩,因為柴油和丙烷仍將是重要的替代能源。
細分市場分析
C型(傳統型)校車是美國校車市場的核心細分市場,預計到2025年將占美國校車市場78.05%的佔有率。在學區優先考慮兼顧出行便利性和座位容量的推動下,預計到2031年,C型校車將維持8.05%的複合年成長率。隨著升級週期與純電動校車改裝獎勵政策的實施期相吻合,美國此類校車的市場規模預計將穩定擴大。汽車製造商正在C型校車平台上整合最新的駕駛輔助系統,同時保持維修人員熟悉的車架尺寸。升級套件包括電子穩定控制系統和360度全景影像系統,這些系統簡化了駕駛人培訓並降低了保險費用。
同時,90人座D型公車的現代化改造也在進行中,以適應綜合線路的需求。托馬斯·布伊特公司(Thomas Built)的Saf-T-Liner EFX2於2025年3月發布,其車身結構經過加強,可有效防止側翻,並配備了車道偏離預警系統,徵兆公交行業正朝著公共交通安全標準轉型。隨著各區域整合公車場站並延長線路,預計D型公車的需求將超過歷史平均水平,但產能限制可能會在短期內導致交貨延遲。小型A型和B型公車則服務於特殊需求人口的出行和狹窄的都市區線路。雖然就銷量而言,A型和B型公車仍屬於小眾市場,但個人化教育計畫的普及正在推動其成長,尤其是在清晨接送學生的高峰時段,這進一步刺激了對更安靜的電動車的需求。
截至2025年,內燃機將占美國校車市場88.40%的佔有率,但隨著聯邦政府撥款加速推廣純電動校車,預計這一佔有率將會下降。美國校車市場規模預計將快速成長,到2031年複合年成長率將達到37.09%。在冬季耐久性和燃料供應仍然是首要考慮因素的偏遠地區,柴油車仍然佔據主導地位。然而,隨著環保法規日益嚴格,汽車製造商正在推出低氮氧化物排放引擎和怠速降低系統,以維持柴油車的市場競爭力。
電動巴士發展勢頭強勁,尤其是在那些實施排放排放採購政策和電力需量反應獎勵的州。混合動力傳動系統雖然佔據著小規模但具有戰略意義的細分市場,為學區提供了一種過渡方案,既能節省20-30%的燃料,又能緩解里程焦慮。丙烷和壓縮天然氣(CNG)車型則有助於在臭氧超標地區達到標準,這些地區的低採購價格和現有的燃料供應基礎設施正在推動其普及。這種多樣化的動力系統組合解釋了為什麼美國校車市場在不斷發展的同時日益成熟。
其他福利:
- Excel格式的市場預測(ME)表
- 分析師支持(3個月)
目錄
第1章 引言
- 研究假設和市場定義
- 調查範圍
第2章調查方法
第3章執行摘要
第4章 市場情勢
- 市場概覽
- 市場促進因素
- 美國環保署清潔校車計畫的聯邦資金激增
- 老舊(超過11年)國家鐵路車輛的更換需求增加
- 嚴格的汽車安全標準加速了車輛更新換代。
- 未達標縣對低氮氧化物「其他燃料」的需求
- 學區可以從車輛到電網(V2G)中獲得收入
- 結合車廠微電網和太陽能發電,降低電力總擁有成本(TCO)
- 市場限制
- 農村地區充電基礎設施不足
- 儘管有獎勵,電動公車的初始成本仍然很高。
- 高壓維修工程師短缺
- 中型底盤供應瓶頸
- 價值/供應鏈分析
- 監理情勢與資金籌措環境
- 技術展望
- 波特五力模型
- 供應商的議價能力
- 買方的議價能力
- 新進入者的威脅
- 替代品的威脅
- 競爭對手之間的競爭
第5章 市場規模及成長預測(金額:美元 / 數量:單位)
- 依設計類型
- A 型(剖面圖)
- B型
- C型(常規)
- D 型(交通工具風格)
- 依動力傳動系統類型
- 內燃機(IC引擎)
- 混合動力汽車和電動車
- 依所有權類型
- 轄區車輛
- 承包商車隊
- 按座位數
- 不到30個座位
- 30至60個座位
- 60個或更多座位
第6章 競爭情勢
- 市場集中度
- 策略舉措和聯盟
- 市佔率分析
- 公司簡介
- Blue Bird Corporation
- Daimler Truck North America LLC(Thomas Built)
- Navistar Inc.(IC Bus)
- Collins Bus Corporation
- Lion Electric Company
- GreenPower Motor Company Inc.
- Micro Bird Inc.(Girardin)
- BYD Motors USA
- Van-Con, Inc.
- Starcraft Bus
- Trans Tech Bus
第7章 市場機會與未來展望
The United States school bus market was valued at USD 5.83 billion in 2025 and estimated to grow from USD 6.25 billion in 2026 to reach USD 8.82 billion by 2031, at a CAGR of 7.13% during the forecast period (2026-2031).
With technological advancements, the emergence of electric school buses on roads underscores a dedication to environmental care and the future of younger generations. The swift transition towards battery-electric vehicles and innovative low-NOx solutions is poised to boost the adoption of electric school buses significantly. Simultaneously, stricter NHTSA safety mandates and state-level zero-emission purchase deadlines are advancing replacement decisions that might otherwise have been deferred. Industry participants are therefore balancing near-term chassis shortages, technician training gaps, and uneven charging infrastructure with longer-term opportunities such as vehicle-to-grid revenue streams and depot-based micro-grids that materially reduce total cost of ownership.
United States School Bus Market Trends and Insights
Federal Funding Surge via EPA Clean School Bus Program
The EPA Clean School Bus Program has altered procurement economics by offsetting up to 80% of incremental costs for battery-electric models, prompting districts to accelerate replacement schedules beyond normal depreciation cycles. Priority scoring directs 45% of funds to low-income and tribal communities, creating adoption clusters in markets that have historically faced limitations due to low tax bases. This wave of subsidized demand is expected to peak before the program sunsets in 2026, compressing procurement windows and intensifying competition for production slots. OEMs and battery suppliers are therefore expanding domestic capacity while forging utility partnerships to streamline charging deployments.
Aging National Fleet (Above 11 yrs) Pushing Replacement Demand
Average bus age now exceeds 11 years, well beyond the Federal Transit Administration's 12-year or 500,000-mile guidance, creating a backlog of sigiifcnat amount of buses units that must be cycled out within five years. Deferred maintenance costs are escalating, particularly in the Midwest, where harsh winters accelerate corrosion. Electric models cost roughly USD 0.40 per mile to maintain versus USD 0.70 for diesel, allowing life-cycle savings to offset higher purchase prices over 12 years . Rural systems with the oldest fleets are exploring propane or CNG bridges while evaluating grants for electrification infrastructure. OEMs are responding with modular electrified chassis that reuse existing Type C layouts, shortening the learning curve for district mechanics. This alignment of end-of-life timing and incentive availability underpins the robust growth outlook for the United States school bus market.
Sparse Rural Charging Infrastructure
Rural districts face a five-to-ten-fold deficit in public charging density compared with urban areas, complicating route planning for long daily runs. While Illinois' Williamsfield Schools overcame the hurdle via a campus microgrid that now meets 94% of energy needs, most rural systems lack the technical staff or utility partnerships to replicate the model. The Infrastructure Investment and Jobs Act allocated USD 1.25 billion for rural EV infrastructure. However, project lead times exceed immediate replacement cycles, resulting in timing misalignments. Until Level 3 chargers become more widely available, diesel and propane will remain important fallback options, tempering overall electrification momentum in the United States school bus market.
Other drivers and restraints analyzed in the detailed report include:
- Stringent On-Board Safety Mandates Accelerating Fleet Renewal
- Low-NOx "Other Fuels" Demand in Non-Attainment Counties
- High Upfront Cost Of E-Buses Despite Incentives
For complete list of drivers and restraints, kindly check the Table Of Contents.
Segment Analysis
Type C (conventional) buses anchored the United States school bus market in 2025 with 78.05% share, and the segment is expected to deliver an 8.05% CAGR through 2031 as districts favor its blend of maneuverability and seating capacity. The United States school bus market size for this design is therefore poised to rise steadily as replacement cycles align with incentive windows that subsidize battery-electric retrofits. OEMs are fortifying Type C platforms with updated driver-assistance suites, while maintaining frame dimensions familiar to maintenance staff. Upgrade packages include electronic stability control and 360-degree camera systems that simplify driver training and reduce insurance premiums.
A parallel modernization wave is unfolding in Type D transit-style configurations, which cater to consolidated routes requiring 90-passenger capacity. Thomas Built's Saf-T-Liner EFX2 launch in March 2025 added rollover-enhanced body structures and lane-departure warnings, signaling an industry shift toward mass-transit safety norms. As districts consolidate depots and extend route lengths, Type D demand is projected to outpace historical averages, though limited production slots may constrain near-term deliveries. At the smaller end, Type A and B buses serve special-needs transport and tight urban corridors. While they remain niche in unit volume, a surge in individualized education programs is boosting growth prospects, especially for electric variants that can operate quietly during early-morning pickup windows.
Internal-combustion engines captured 88.40% of the United States School Bus Market size in 2025, yet the segment's share is forecast to shrink as battery-electric deployments accelerate under federal funding schemes. The United States school bus market size for electric models is set to climb rapidly, given their 37.09% CAGR through 2031. Diesel retains an edge in remote geographies where winter resilience and fuel availability remain paramount. Nevertheless, OEMs are integrating lower-NOx engines and idle-reduction systems to extend diesel relevance amid environmental scrutiny.
Electric momentum is particularly strong in states with zero-emission purchase mandates and utility demand-response incentives. Hybrid powertrains occupy a small but strategic niche, offering districts a transitional pathway that mitigates range anxiety while providing fuel savings of 20-30%. Propane and CNG models underpin compliance in ozone-non-attainment counties, their adoption bolstered by lower acquisition prices and familiar fueling infrastructure. Collectively, this diverse propulsion mix underlines why the United States school bus market remains simultaneously mature and transformative.
The United States School Bus Market Report is Segmented by Design Type (Type A (Cut-Away), Type B, and More), Powertrain Type (Internal Combustion Engine, Hybrid, and Electric), Ownership Model (District-Owned Fleets and Contractor-Owned Fleets), and Seating Capacity (Less Than 30 Seats, 30-60 Seats, and More). The Market Forecasts are Provided in Terms of Value (USD) and Volume (Units).
List of Companies Covered in this Report:
- Blue Bird Corporation
- Daimler Truck North America LLC (Thomas Built)
- Navistar Inc. (IC Bus)
- Collins Bus Corporation
- Lion Electric Company
- GreenPower Motor Company Inc.
- Micro Bird Inc. (Girardin)
- BYD Motors USA
- Van-Con, Inc.
- Starcraft Bus
- Trans Tech Bus
Additional Benefits:
- The market estimate (ME) sheet in Excel format
- 3 months of analyst support
TABLE OF CONTENTS
1 Introduction
- 1.1 Study Assumptions & Market Definition
- 1.2 Scope of the Study
2 Research Methodology
3 Executive Summary
4 Market Landscape
- 4.1 Market Overview
- 4.2 Market Drivers
- 4.2.1 Federal Funding Surge via EPA Clean School Bus Program
- 4.2.2 Aging National Fleet (Above 11 yrs) Pushing Replacement Demand
- 4.2.3 Stringent On-board Safety Mandates Accelerating Fleet Renewal
- 4.2.4 Low-NOx "Other Fuels" Demand in Non-attainment Counties
- 4.2.5 Vehicle-to-grid (V2G) Revenue Potential for School Districts
- 4.2.6 Depot Micro-grid and Solar Pairing Lowers Electric TCO
- 4.3 Market Restraints
- 4.3.1 Sparse Rural Charging Infrastructure
- 4.3.2 High Upfront Cost Of E-Buses Despite Incentives
- 4.3.3 Scarcity Of High-Voltage Maintenance Technicians
- 4.3.4 Medium-Duty Chassis Supply Bottlenecks
- 4.4 Value / Supply-Chain Analysis
- 4.5 Regulatory & Funding Landscape
- 4.6 Technological Outlook
- 4.7 Porter's Five Forces
- 4.7.1 Bargaining Power of Suppliers
- 4.7.2 Bargaining Power of Buyers
- 4.7.3 Threat of New Entrants
- 4.7.4 Threat of Substitutes
- 4.7.5 Competitive Rivalry
5 Market Size & Growth Forecasts (Value in USD and Volume in Units)
- 5.1 By Design Type
- 5.1.1 Type A (Cut-away)
- 5.1.2 Type B
- 5.1.3 Type C (Conventional)
- 5.1.4 Type D (Transit-Style)
- 5.2 By Powertrain Type
- 5.2.1 Internal Combustion Engine (IC Engine)
- 5.2.2 Hybrid and Electric
- 5.3 By Ownership Model
- 5.3.1 District-Owned Fleets
- 5.3.2 Contractor-Owned Fleets
- 5.4 By Seating Capacity
- 5.4.1 Less than 30 Seats
- 5.4.2 30-60 Seats
- 5.4.3 Above 60 Seats
6 Competitive Landscape
- 6.1 Market Concentration
- 6.2 Strategic Moves & Partnerships
- 6.3 Market Share Analysis
- 6.4 Company Profiles (includes Global Level Overview, Market Level Overview, Core Segments, Financials as Available, Strategic Information, Market Rank/Share for Key Companies, Products and Services, SWOT Analysis, and Recent Developments)
- 6.4.1 Blue Bird Corporation
- 6.4.2 Daimler Truck North America LLC (Thomas Built)
- 6.4.3 Navistar Inc. (IC Bus)
- 6.4.4 Collins Bus Corporation
- 6.4.5 Lion Electric Company
- 6.4.6 GreenPower Motor Company Inc.
- 6.4.7 Micro Bird Inc. (Girardin)
- 6.4.8 BYD Motors USA
- 6.4.9 Van-Con, Inc.
- 6.4.10 Starcraft Bus
- 6.4.11 Trans Tech Bus
7 Market Opportunities & Future Outlook
- 7.1 White-Space & Unmet-Need Assessment


