


 |
市場調查報告書
商品編碼
1934725
農業生物製品:市場佔有率分析、產業趨勢與統計、成長預測(2026-2031)Agricultural Biologicals - Market Share Analysis, Industry Trends & Statistics, Growth Forecasts (2026 - 2031) |
||||||
※ 本網頁內容可能與最新版本有所差異。詳細情況請與我們聯繫。
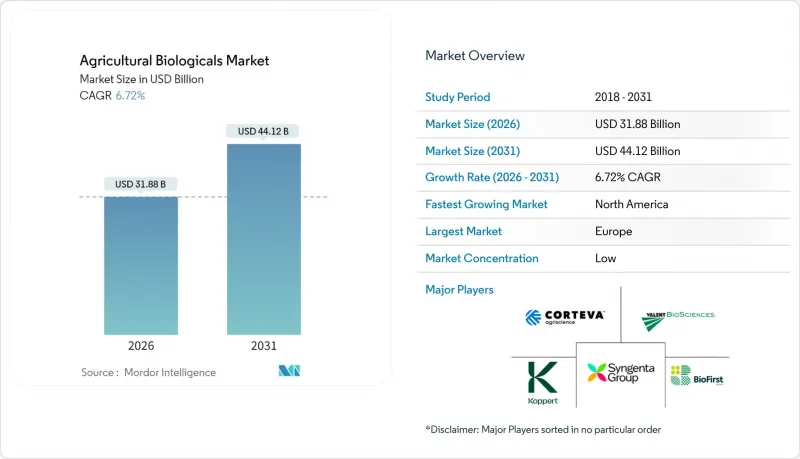
預計農業生物產品市場將從 2025 年的 298.7 億美元成長到 2026 年的 318.8 億美元,到 2031 年將達到 441.2 億美元,2026 年至 2031 年的複合年成長率為 6.72%。
對合成殘留物的監管力度加大、農民對土壤健康解決方案的需求不斷成長,以及人工智慧加速菌株發現,這些因素共同推動了市場成長。隨著大型食品零售商收緊殘留物標準,目標客戶群正從認證有機農場擴展到更廣泛的範圍。微生物研發週期正在加快,商業候選產品如今只需數月而非數年即可上市,這縮短了產品上市時間,也加劇了市場競爭。企業對本地生產和農場發酵的投資降低了物流成本,並擴大了產品覆蓋範圍。
全球農業生技藥品市場趨勢與洞察
對有機和無農藥農產品的需求不斷成長
預計到2024年,美國有機食品銷售額將成長4.6%,達到672億美元,反映出消費者對農藥殘留的日益關注。認證農產品的高價促使傳統農戶採用生物投入品,以滿足零售商嚴格的檢測標準。在亞洲這個新興的中等收入地區,也出現了類似的趨勢,食品安全是當地家庭最關心的問題之一。隨著超級市場收緊農藥殘留標準,許多供應合約中的生物解決方案正從可選變為強制。這種拉動效應正在推動生物肥料、生物促效劑和生物農藥等產品持續成長的需求。
加強全球對合成農藥的監管
自2020年以來,歐盟在其「從農場到餐桌」戰略下禁用了70多種活性成分,而美國環保署(EPA)則允許合格的微生物農藥快速註冊。更嚴格的基準值縮短了許多合成產品的商業壽命。隨著農民可選擇的化學農藥種類減少,生物替代品正變得越來越重要,其核准流程僅需約18個月——僅為傳統活性成分所需時間的一半。政策制定者致力於降低風險,這增強了生物農藥的長期需求基礎。
許多藥品保存期限短,且依賴低溫運輸運輸。
許多活性菌製劑需要在2°C至8°C的溫度下儲存,這在冷藏車運輸受限的地區可能會使分銷成本增加高達40%。在最終分銷過程中暴露於高溫會顯著降低活菌數量,從而影響其在田間的功效並降低農民的信心。東南亞和撒哈拉以南非洲等熱帶市場面臨最高的劣化率,除非常溫保存的製劑供應日益充足,否則將限制銷售量成長。
細分市場分析
2025年,作物營養領域在農業生物製品市場中佔據主導地位,市佔率高達63.55%,主要得益於種植者對土壤微生物群落韌性和養分利用效率的重視。該領域的領先地位主要源於合成肥料需求減少帶來的顯著成本節約以及碳權收益的增加。其中,固氮生物肥料每英畝可提供高達50磅的氮當量,直接降低投入成本。此外,生物促效劑還能增強作物對非生物脅迫的耐受性,這在氣候變遷日益嚴峻的背景下顯得特別重要。
作物營養領域持續保持強勁成長,以6.78%的複合年成長率 (CAGR) 超過其他所有功能領域。此外,作物營養領域的成熟將確保其繼續保持銷售領先地位。然而,隨著製造商追求跨功能價值提案,他們正日益將產品組合多元化,推出兼具營養和保護功能的複合產品。
除了數量指標之外,創新能力將成為企業間差異化的關鍵因素。人工智慧驅動的菌株篩選將成為下一代接種劑的基礎,提供精準的代謝物譜,從而降低試驗成本並提高田間均勻性。營養配方中擴大融入載體化學物質,以保護微生物免受紫外線和乾燥的影響,從而無需冷藏即可實現長達18個月的保存期限。
農業生物製品市場報告按功能(作物營養:有機肥料、生物肥料、生物促效劑)、作物保護(生物農藥、生物防治劑)、作物類型(大田作物、園藝作物、經濟作物)和地區(北美、南美、歐洲、其他)進行細分。市場預測以價值(美元)和數量(公噸)為單位。
區域分析
到2025年,歐洲將佔據全球農業生物產品市場34.05%的佔有率,這主要得益於歐盟的化學品禁令以及為有機農業轉型提供的財政支持措施。成員國透過「生態計畫」(Eco Scheme)補貼,報銷高達25%的生物投入成本,從而縮短了種植者的投資回收期。鑑於其龐大的規模,高價值水果產業的擴張速度較為緩慢,滲透率已接近100%,歐洲供應商正轉向透過技術合作,出口監管方面的專業知識和配方。
北美地區到2031年將達到8.55%的複合年成長率,成為成長最快的地區。生物技術協調架構簡化了微生物核准,中位核准時間為18個月,並加快了產品平臺。科迪華和BASF在國內發酵工廠的7億美元以上投資,反映了其長期發展承諾。與加拿大的跨境監管協調進一步拓展了鄰近的潛在市場,而墨西哥以出口為導向的水果產業正在採用生物農藥,以滿足歐洲的殘留標準。
亞太地區已成為新興的成長區域,主要得益於印度加速核准15種生物農藥於2024年上市,以及中國提供高達30%農產品採購補貼的計畫。對分散式生產基地的投資緩解了低溫運輸挑戰,使得熱帶地區的小規模農戶也能採用生物農藥。消費者對過度使用化學物質和土壤污染日益成長的抵制也推動了區域市場的成長。在南美洲,巴西的大豆生產優勢持續推動強勁的銷售成長。當地的發酵能力和巴西IN 36加速核准程序降低了核准成本,促進了專注於塞拉多土壤的國內和跨國公司產品推出。阿根廷和智利正在加速採用生物農藥,以應對歐洲進口國日益嚴格的殘留物標準,從而保持出口競爭力。
其他福利:
- Excel格式的市場預測(ME)表
- 3個月的分析師支持
目錄
第1章 引言
- 研究假設和市場定義
- 調查範圍
- 調查方法
第2章執行摘要和主要發現
第3章 報告
第4章:主要產業趨勢
- 有機耕作面積
- 人均有機產品支出
- 法律規範
- 阿根廷
- 澳洲
- 巴西
- 加拿大
- 中國
- 埃及
- 法國
- 德國
- 印度
- 印尼
- 義大利
- 日本
- 墨西哥
- 荷蘭
- 奈及利亞
- 菲律賓
- 俄羅斯
- 南非
- 西班牙
- 泰國
- 土耳其
- 英國
- 美國
- 越南
- 價值鍊和通路分析
- 市場促進因素
- 有機種植和無農藥農產品的需求不斷成長
- 加強全球對合成農藥的監管
- 將生物農藥納入企業綜合蟲害管理(IPM)計劃
- 透過再生農業實踐獲得的排碳權收益
- 人工智慧驅動的微生物菌株發現加速研發週期
- 農場發酵與本地生物投入生產模式
- 市場限制
- 許多藥品保存期限短,且依賴低溫運輸運輸。
- 複雜且不連貫的註冊流程
- 仿冒品和劣質生物農藥的普遍存在
- 海藻等關鍵原料供應不穩定
第5章 市場規模和成長預測(價值和數量)
- 按功能
- 作物營養
- 有機肥料
- 生物肥料
- 生物促效劑
- 作物保護
- 生物農藥
- 生物防治劑
- 作物營養
- 按作物類型
- 田間作物
- 園藝作物
- 經濟作物
- 按地區
- 北美洲
- 美國
- 加拿大
- 墨西哥
- 北美其他地區
- 南美洲
- 巴西
- 阿根廷
- 其他南美洲
- 歐洲
- 德國
- 英國
- 法國
- 西班牙
- 義大利
- 荷蘭
- 俄羅斯
- 土耳其
- 其他歐洲地區
- 亞太地區
- 中國
- 印度
- 日本
- 澳洲
- 越南
- 泰國
- 印尼
- 菲律賓
- 亞太其他地區
- 中東
- 伊朗
- 沙烏地阿拉伯
- 其他中東地區
- 非洲
- 南非
- 奈及利亞
- 埃及
- 其他非洲地區
- 北美洲
第6章 競爭情勢
- 市場集中度
- 策略趨勢
- 市佔率分析
- 公司簡介
- Corteva Agriscience
- BASF SE
- Bayer AG
- Syngenta AG
- UPL Limited
- Novonesis A/S
- Koppert Biological Systems BV
- Biofirst Group NV
- Valent BioSciences LLC
- FMC Corporation
- Rovensa SA
- Certis USA LLC
- ProFarm Group Inc.
- Andermatt Biocontrol AG
- Yara International ASA
第7章:CEO們需要思考的關鍵策略問題
The agricultural biologicals market is expected to grow from USD 29.87 billion in 2025 to USD 31.88 billion in 2026 and is forecast to reach USD 44.12 billion by 2031 at 6.72% CAGR over 2026-2031.
Escalating regulatory scrutiny of synthetic residues, farmer demand for soil health solutions, and the acceleration of artificial intelligence-enabled strain discovery collectively propel growth. Large food retailers are tightening residue standards, widening the addressable base beyond certified-organic farms. Rapid microbial research and development (R&D) cycles now deliver commercial candidates in months instead of years, compressing time-to-market and intensifying competitive churn. Corporate capital commitments to local manufacturing and on-farm fermentation lower logistics costs and widen geographic reach.
Global Agricultural Biologicals Market Trends and Insights
Rising Demand for Organic, Residue-Free Produce
Organic food sales in the United States rose 4.6% to USD 67.2 billion in 2024, reflecting shoppers' heightened vigilance over pesticide residues. Premium pricing for certified produce incentivizes conventional growers to adopt biological inputs that help them clear stringent retailer tests. Similar patterns unfold in expanding middle-income segments of Asia, where food safety ranks high among household concerns. As supermarkets tighten private residue standards, biological solutions move from optional to compulsory within many supply contracts. The pull effect boosts recurring demand across biofertilizer, biostimulant, and biopesticide categories.
Stringent Global Curbs on Synthetic Agro-Chemicals
The European Union has banned more than 70 active ingredients since 2020 under its Farm to Fork Strategy, whereas the United States Environmental Protection Agency allows fast-track registration for eligible microbial pesticides. Tighter maximum residue limits shorten the commercial life of many synthetic products. Farmers now face fewer chemical options, raising the strategic value of biological substitutes that clear regulatory hurdles in roughly 18 months, half the timeline of conventional actives. Policymakers' alignment on risk-reduction amplifies the long-run demand floor for biologicals.
Short Shelf Life and Cold-Chain Dependence Of Many Formulations
Many live-culture formulations require storage between 2 °C and 8 °C, which can increase distribution costs by up to 40% where refrigerated trucking is limited. Heat exposure during last-mile delivery can significantly reduce viable colony counts and compromise field performance, eroding farmer confidence. Tropical markets in Southeast Asia and sub-Saharan Africa experience the highest spoilage rates, which constrain volume growth unless shelf-stable formulations scale rapidly.
Other drivers and restraints analyzed in the detailed report include:
- Integration of Biologicals into Corporate IPM Programs
- Carbon-Credit Revenue from Regenerative Farming Practices
- Complex, Non-Harmonized Registration Pathways
For complete list of drivers and restraints, kindly check the Table Of Contents.
Segment Analysis
Crop nutrition maintained a commanding 63.55% share of the agricultural biologicals market in 2025 as growers prioritized soil microbiome resilience and nutrient-use efficiency. The segment's leadership reflects tangible cost savings from reduced synthetic fertilizer demand and improved carbon-credit earnings. Within this category, biofertilizers that fix nitrogen deliver up to 50 pounds per acre equivalence, directly lowering input purchases. Biostimulants extend benefits by enhancing abiotic stress tolerance, a valued trait amid widening climate variability.
Crop nutrition is growing at a robust pace, outpacing all other functions with a 6.78% CAGR. In addition, the maturity of crop nutrition ensures continued volume dominance. However, portfolio diversification into combined nutrition-protection products is rising as manufacturers pursue cross-functional value propositions.
Beyond volume metrics, innovation intensity differentiates players. AI-guided strain selection now underpins next-generation inoculants that deliver precise metabolite profiles, cutting trial-and-error costs while elevating field consistency. Nutrient formulations are increasingly integrating carrier chemistries that shield microbes from UV radiation and desiccation, extending shelf life to 18 months without refrigeration.
The Agricultural Biologicals Market Report is Segmented by Function (Crop Nutrition Into Organic Fertilizers, Biofertilizers, and Biostimulants); (Crop Protection Into Biopesticides and Biocontrol Agents), by Crop Type (Row Crops, Horticultural Crops, Cash Crops), and Geography (North America, South America, Europe, and More). The Market Forecasts are Provided in Terms of Value (USD) and Volume (Metric Tons).
Geography Analysis
Europe held a 34.05% share of the agricultural biologicals market in 2025, underpinned by the European Union's combination of chemical bans and financial stimuli for organic transitions. Member states reimburse up to 25% of biological input costs within eco-scheme payments, shortening grower payback horizons. Despite its scale, expansion moderates as penetration nears 100% in high-value fruit sectors, prompting European suppliers to pivot outward and export regulatory expertise and formulations through technology partnerships.
North America registered the fastest 8.55% CAGR by 2031. The Coordinated Framework for Biotechnology simplifies microbial approvals to an 18-month median, catalyzing product pipeline throughput. Capital spending on domestic fermentation plants by Corteva and BASF exceeds USD 700 million, signaling a long-term commitment. Cross-border regulatory alignment with Canada further enlarges the contiguous addressable market, while Mexico's export-oriented fruit sector adopts biologicals to meet European residue limits.
The Asia-Pacific region stands as the emerging frontier, driven by India's expedited clearance of 15 biological pesticides in 2024 and China's subsidy program, which rebates up to 30% of farmers' purchases. Investment in decentralized production hubs mitigates cold-chain gaps, making biologicals viable in tropical smallholder systems. Regional market growth also benefits from mounting consumer backlash against chemical overuse and soil contamination. South America sustains robust volume growth anchored in Brazil's soybean dominance. Local fermentation capacity and Brazil's IN 36 fast-track process reduce approval costs, catalyzing a surge in domestic and multinational launches tailored to Cerrado soils. Argentina and Chile accelerate adoption to preserve export competitiveness as European importers enforce tougher residue ceilings.
- Corteva Agriscience
- BASF SE
- Bayer AG
- Syngenta AG
- UPL Limited
- Novonesis A/S
- Koppert Biological Systems B.V.
- Biofirst Group NV
- Valent BioSciences LLC
- FMC Corporation
- Rovensa S.A.
- Certis USA LLC
- ProFarm Group Inc.
- Andermatt Biocontrol AG
- Yara International ASA
Additional Benefits:
- The market estimate (ME) sheet in Excel format
- 3 months of analyst support
TABLE OF CONTENTS
1 Introduction
- 1.1 Study Assumptions and Market Definition
- 1.2 Scope of the Study
- 1.3 Research Methodology
2 Executive Summary and Key Findings
3 Report Offers
4 Key Industry Trends
- 4.1 Area Under Organic Cultivation
- 4.2 Per Capita Spending On Organic Products
- 4.3 Regulatory Framework
- 4.3.1 Argentina
- 4.3.2 Australia
- 4.3.3 Brazil
- 4.3.4 Canada
- 4.3.5 China
- 4.3.6 Egypt
- 4.3.7 France
- 4.3.8 Germany
- 4.3.9 India
- 4.3.10 Indonesia
- 4.3.11 Italy
- 4.3.12 Japan
- 4.3.13 Mexico
- 4.3.14 Netherlands
- 4.3.15 Nigeria
- 4.3.16 Philippines
- 4.3.17 Russia
- 4.3.18 South Africa
- 4.3.19 Spain
- 4.3.20 Thailand
- 4.3.21 Turkey
- 4.3.22 United Kingdom
- 4.3.23 United States
- 4.3.24 Vietnam
- 4.4 Value Chain & Distribution Channel Annalysis
- 4.5 Market Drivers
- 4.5.1 Rising demand for organic, residue-free produce
- 4.5.2 Stringent global curbs on synthetic agro-chemicals
- 4.5.3 Integration of biologicals into corporate IPM programs
- 4.5.4 Carbon-credit revenue from regenerative farming practices
- 4.5.5 AI-enabled microbial-strain discovery accelerates R&D cycles
- 4.5.6 On-farm fermentation and local bio-input manufacturing models
- 4.6 Market Restraints
- 4.6.1 Short shelf-life and cold-chain dependence of many formulations
- 4.6.2 Complex, non-harmonized registration pathways
- 4.6.3 Proliferation of counterfeit and sub-standard biologicals
- 4.6.4 Volatile supply of critical feedstocks such as seaweed
5 Market Size and Growth Forecasts (Value and Volume)
- 5.1 By Function
- 5.1.1 Crop Nutrition
- 5.1.1.1 Organic Fertilizers
- 5.1.1.2 Biofertilizers
- 5.1.1.3 Biostimulants
- 5.1.2 Crop Protection
- 5.1.2.1 Biopesticides
- 5.1.2.2 Biocontrol Agents
- 5.1.1 Crop Nutrition
- 5.2 By Crop Type
- 5.2.1 Row Crops
- 5.2.2 Horticultural Crops
- 5.2.3 Cash Crops
- 5.3 By Geography
- 5.3.1 North America
- 5.3.1.1 United States
- 5.3.1.2 Canada
- 5.3.1.3 Mexico
- 5.3.1.4 Rest of North America
- 5.3.2 South America
- 5.3.2.1 Brazil
- 5.3.2.2 Argentina
- 5.3.2.3 Rest of South America
- 5.3.3 Europe
- 5.3.3.1 Germany
- 5.3.3.2 United Kingdom
- 5.3.3.3 France
- 5.3.3.4 Spain
- 5.3.3.5 Italy
- 5.3.3.6 Netherlands
- 5.3.3.7 Russia
- 5.3.3.8 Turkey
- 5.3.3.9 Rest of Europe
- 5.3.4 Asia-Pacific
- 5.3.4.1 China
- 5.3.4.2 India
- 5.3.4.3 Japan
- 5.3.4.4 Australia
- 5.3.4.5 Vietnam
- 5.3.4.6 Thailand
- 5.3.4.7 Indonesia
- 5.3.4.8 Philippines
- 5.3.4.9 Rest of Asia-Pacific
- 5.3.5 Middle East
- 5.3.5.1 Iran
- 5.3.5.2 Saudi Arabia
- 5.3.5.3 Rest of Middle East
- 5.3.6 Africa
- 5.3.6.1 South Africa
- 5.3.6.2 Nigeria
- 5.3.6.3 Egypt
- 5.3.6.4 Rest of Africa
- 5.3.1 North America
6 Competitive Landscape
- 6.1 Market Concentration
- 6.2 Strategic Moves
- 6.3 Market Share Analysis
- 6.4 Company Profiles (includes Global Overview, Market Overview, Core Segments, Financials, Strategic Information, Market Rank/Share, Products & Services, and Recent Developments)
- 6.4.1 Corteva Agriscience
- 6.4.2 BASF SE
- 6.4.3 Bayer AG
- 6.4.4 Syngenta AG
- 6.4.5 UPL Limited
- 6.4.6 Novonesis A/S
- 6.4.7 Koppert Biological Systems B.V.
- 6.4.8 Biofirst Group NV
- 6.4.9 Valent BioSciences LLC
- 6.4.10 FMC Corporation
- 6.4.11 Rovensa S.A.
- 6.4.12 Certis USA LLC
- 6.4.13 ProFarm Group Inc.
- 6.4.14 Andermatt Biocontrol AG
- 6.4.15 Yara International ASA
7 Key Strategic Questions for Agricultural Biological CEOs
 動物微生物組市場規模、佔有率和成長分析:按動物種類、產品類型、原料、形態、應用、最終用戶、通路和地區分類——2026-2033年行業預測
 全球農業生技藥品市場規模、佔有率、趨勢和成長分析報告(2026-2034年)
 2026年全球農業生技藥品市場報告
 生物合理作物保護市場依產品類型、作物類型、配方、作用機制、成分及應用方法分類-2026-2032年全球預測
 農業生技藥品市場規模、佔有率和趨勢分析報告:按作物類型、產品類型、應用方法、地區和細分市場預測(2026-2033 年)
 日本農業生物製品市場報告(按類型、來源、應用方式、應用領域和地區分類,2026-2034年)
 農業生技藥品市場規模、佔有率和成長分析(按類型、來源、應用、作物類型和地區分類)-2026-2033年產業預測
 農業生技藥品市場規模、佔有率和成長分析(按類型、來源、應用、作物類型和地區分類)-2026-2033年產業預測農業生技藥品市場-2025-2030年預測
 全球農業生技藥品市場按類型、來源、配方、應用方式、作物類型和地區分類-預測至2030年