


 |
市場調查報告書
商品編碼
1934670
美國活性碳:市場佔有率分析、產業趨勢與統計、成長預測(2026-2031)United States Activated Carbon - Market Share Analysis, Industry Trends & Statistics, Growth Forecasts (2026 - 2031) |
||||||
※ 本網頁內容可能與最新版本有所差異。詳細情況請與我們聯繫。
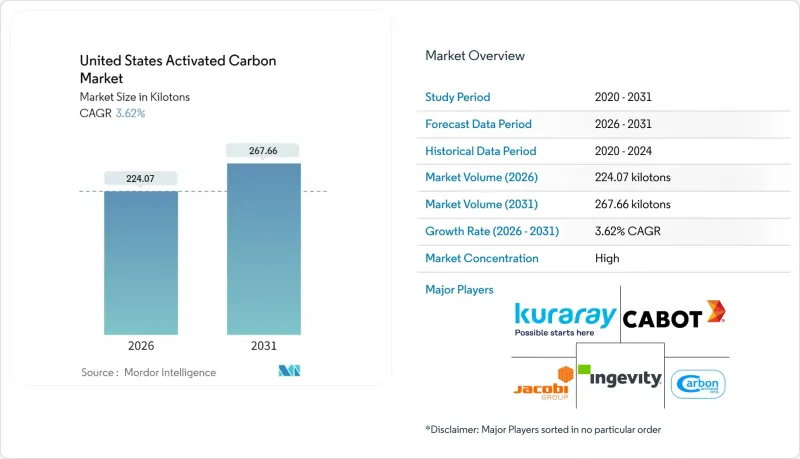
美國活性碳市場預計將從 2025 年的 216.24 千噸成長到 2026 年的 224.07 千噸,預計到 2031 年將達到 267.66 千噸,2026 年至 2031 年的複合年成長率為 3.62%。
這一強勁成長直接歸功於聯邦水質法規,該法規要求將顆粒活性碳作為 PFAS 合規的標準;政府對長效吸附器的資助;以及對燃煤發電廠汞污染和石化產品中揮發性有機化合物 (VOC) 替代處理方法日益成長的需求。兩黨基礎設施法案下的基礎設施津貼,以及與 3M 和杜邦科慕-科迪華達成的單獨和解協議,正在為大型處理計劃提供資金。同時,汽車蒸發排放氣體法規和國內原料藥 (API) 生產也推動了該成長要素。這些結構性利好因素受到新型高能耗活化製程、原料價格上漲以及離子交換樹脂和奈米過濾濾膜等替代技術的限制,但並未阻止產能擴張或長期供應協議的簽署。
美國活性碳市場趨勢與分析
美國環保署關於飲用水中 PFAS 的規定
將於2024年4月生效的《國家飲用水標準》將全氟辛酸(PFOA)和全氟辛烷磺酸(PFOS)的濃度限制在4 ppt(十億分之四)以內,這促使人們迅速採購顆粒活性炭,將其作為最佳可行可用技術(BAT)。監測將於2027年4月開始,全面合規要求將於2029年4月前完成,這意味著尚未配備PFAS處理設備的系統中,77%必須在三年內完成安裝。目前,典型的市政水質淨化廠每年投入9,000至45,000公斤活性炭,並以9至12個月的突破週期運作。這造成了持續的需求,並增加了活性碳重新運作處理量。卡爾岡炭素公司與美國水務公司簽訂的為期九年的供應合約(涵蓋50多個地點)就是一個典型的例子,說明了確保庫存、熱重新運作能力和物流資源的迫切需求。由於短鏈 PFAS 和高有機物含量會縮短 GAC 的運作,因此正在採用粉末活性碳、離子交換和膜處理的混合方法,但這種轉變往往會增加而不是降低總處理成本。
排放燃煤發電廠的汞排放
2024 年的《汞和空氣毒物評估報告》將褐煤發電廠的汞排放限值從 4 磅/TBtu 收緊至 1.2 磅/TBtu,並在 55 台燃煤機組中實施了溴化粉末活性碳噴射,噴射量為 2-5 磅/百萬英畝。 Arq 的精煉煤計劃支撐著其既有的噸級規模,其在佛羅裡達州、伊利諾伊州、肯塔基州、北卡羅來納州、德克薩斯州和西維吉尼亞的改造項目也為近期生產提供了支持。這項因素對複合年成長率 (CAGR) 的貢獻為 0.6 個百分點,但隨著燃煤機組的退役和碳捕集改造維修舊機組,其影響將在 2028 年後逐漸減弱。美國環保署 (EPA) 於 2025 年 3 月進行的評估存在政策風險,可能導致長期 PAC 授權的撤銷。
原生蒸氣活化的高能耗成本
原生活化製程在 800–1000°C 的溫度下運作,每公斤煤基碳產生高達 9.5 公斤二氧化碳排放排放,是熱重新運作製程的三倍。由於天然氣和電力成本佔工廠總成本的 30% 之多,美國公用事業公司在 17 座重新運作爐中回收廢棄的活性碳床,目前可回收 66% 的無害碳。卡爾岡碳公司在美國的五座重新運作爐以及 JACOBI 公司 2025 年的價格轉嫁策略都反映了能源通膨的連鎖反應。微波和真空活化試驗預計將節省 50–70% 的成本,但目前仍處於資本密集的試點階段,到 2028 年,這種影響仍將持續,造成 0.7 個百分點的負面影響。
細分市場分析
到2025年,顆粒活性碳將佔出貨量的45.78%,凸顯了其在市政化糞池中的成熟應用,這些化糞池旨在滿足美國環保署(EPA)4 ppt的PFAS限值。像威立雅斯坦頓工廠這樣日處理量3000萬加侖的設施,需要將168萬磅活性碳裝入42個貨櫃,這表明公用事業公司在簽訂長期服務協議時,會嚴格控制噸位。粒徑在0.6毫米至2.4毫米之間的產品,在壓力降和高效再生之間取得了良好的平衡,而五座公共產業窯爐則縮短了重新運作循環的運輸距離。儘管美國活性碳市場面臨混合產品的競爭,但大多數公共產業仍使用顆粒床來去除除PFAS以外的多種污染物,例如土臭素引起的異味以及農業徑流中的有機物。
隨著加州空氣資源委員會收緊蒸發預防罐標準,要求其具有均勻的大孔以確保碳氫化合物的終身保留,擠出或顆粒狀產品預計將以4.18%的複合年成長率成為成長最快的產品。 Ingevity公司70%的特殊活性碳銷售額來自汽車業,由於OEM庫存調整和亞洲進口增加,其2024年的收入下降了5%。顆粒狀活性碳在商業空氣淨化領域也日益普及,直徑4毫米的圓柱形顆粒可以降低鼓風機的能耗。 CarbonXT公司於2025年第一季在肯塔基州運作了一條擠出生產線,年產能達到1萬噸,縮短了中西部和東南部客戶的前置作業時間。粉狀活性碳可以解決季節性的口感和氣味控制問題,並滿足對用於煤汞控制的溴化PAC噴射劑的需求,從而在美國活性碳市場形成均衡的產品組合,同時又不犧牲顆粒狀活性碳的核心市場佔有率。
美國活性碳市場報告按產品類型(粉末活性碳、顆粒活性碳)、原料應用(氣體淨化、水處理、金屬提取、醫療等)和終端用戶產業(水處理、食品飲料、醫療、汽車、工業流程及其他終端用戶產業)進行細分。市場預測以公噸為單位。
其他福利:
- Excel格式的市場預測(ME)表
- 3個月的分析師支持
目錄
第1章 引言
- 研究假設和市場定義
- 調查範圍
第2章調查方法
第3章執行摘要
第4章 市場情勢
- 市場概覽
- 市場促進因素
- 美國環保署關於飲用水中 PFAS/PFOA 的規定
- 逐步排放燃煤發電廠的汞排放
- 工業用Airstream拖車VOC排放法規更加嚴格
- 原料藥生產能力快速擴張
- 利用活性碳的電網級超級電容計劃
- 市場限制
- 原生蒸氣活化的高能耗成本
- 與矽膠、生物炭和先進膜技術的競爭
- 氣候變遷導致椰殼原料供應面臨風險
- 價值鏈分析
- 波特五力模型
- 供應商的議價能力
- 消費者議價能力
- 新進入者的威脅
- 替代產品和服務的威脅
- 競爭程度
第5章 市場規模與成長預測
- 依產品類型
- 粉末活性碳
- 顆粒活性碳
- 擠壓或造粒活性碳
- 按原料
- 氣體淨化
- 水處理
- 金屬提取
- 製藥
- 其他用途
- 按最終用戶行業分類
- 水處理
- 食品/飲料
- 衛生保健
- 車
- 工業製程
- 其他終端用戶產業
第6章 競爭情勢
- 市場集中度
- 策略趨勢
- 市佔率(%)/排名分析
- 公司簡介
- Advanced Emissions Solutions, Inc.
- Albemarle Corporation
- Arq, Inc.
- Boyce Carbon.
- Cabot Corporation
- Carbon Activated Corporation
- CarbUSA
- CPL Activated Carbons
- Donau Chemie AG
- Evoqua Water Technologies LLC
- General Carbon Corporation
- Ingevity
- JACOBI CARBONS GROUP
- Kuraray Co., Ltd.
- Kureha Corporation
- Prominent Systems, Inc.
- Puragen Activated Carbons
- Veolia
第7章 市場機會與未來展望
The United States Activated Carbon Market is expected to grow from 216.24 kilotons in 2025 to 224.07 kilotons in 2026 and is forecast to reach 267.66 kilotons by 2031 at 3.62% CAGR over 2026-2031.
This steady climb links directly to federal water rules that now treat granular activated carbon as the benchmark for PFAS compliance, municipal budgets earmarked for long-life adsorption beds, and growing replacements across coal plant mercury-control and petrochemical VOC streams. Infrastructure grants under the Bipartisan Infrastructure Law and separate 3M and DuPont-Chemours-Corteva settlements are underwriting large-scale treatment projects, while automotive evaporative-emission standards and domestic API manufacturing add second-layer momentum. Against these structural tailwinds, high-energy virgin activation, feedstock inflation, and emerging substitutes such as ion-exchange resins and nanofiltration membranes act as counterweights yet have not stalled capacity expansions or long-term supply contracts.
United States Activated Carbon Market Trends and Insights
EPA Regulations on PFAS in Drinking Water
The April 2024 National Primary Drinking Water Regulation established a 4 ppt limit for PFOA and PFOS, prompting the rapid procurement of granular activated carbon as Best Available Technology. Monitoring starts in April 2027, and full compliance is due by April 2029, forcing 77% of systems still lacking PFAS treatment to install beds within three years. A typical municipal plant now loads between 9,000 kg and 45,000 kg of carbon with 9- to 12-month breakthrough cycles, creating repeat demand and lifting carbon reactivation volumes. Calgon Carbon's nine-year supply pact with American Water covering more than 50 sites showcases the rush to lock in inventory, thermal reactivation slots, and logistics. Short-chain PFAS and high organic matter lessen GAC's run length, prompting hybrid pairs with powdered carbon, ion exchange, or membranes, yet this shift enlarges rather than shrinks total treatment spending.
Phase-Out of Mercury Emissions from Coal-Fired Utilities
The 2024 Mercury and Air Toxics review tightened lignite plant mercury limits from 4.0 lb to 1.2 lb per TBtu, prompting the use of brominated powdered carbon injections at 2-5 lb per million acf across 55 coal units. Arq's refined coal production underscores the tonnage scale already in place, while retrofit projects in Florida, Illinois, Kentucky, North Carolina, Texas, and West Virginia keep short-term volume buoyant. The driver contributes 0.6 percentage points to CAGR yet fades as coal retirements and carbon-capture retrofits displace aging units after 2028. The EPA's March 2025 reconsideration introduces policy risk that could lead to a reversal of long-run PAC orders.
High Energy Cost of Virgin Steam Activation
Virgin activation runs at 800-1,000°C and emits up to 9.5 kg CO2-eq per kg of coal-based carbon, triple that of thermal reactivation. Natural gas and electricity account for as much as 30% of a factory's cost, encouraging utilities to recycle spent beds through 17 U.S. reactivation furnaces, where 66% of non-hazardous carbon now finds a second life. Calgon Carbon's five domestic reactivation kilns and JACOBI's 2025 price pass-throughs illustrate the ripple effects of energy inflation. Microwave and vacuum activation trials promise 50-70% savings but remain capital-intensive pilots, keeping this drag at -0.7 percentage points through 2028.
Other drivers and restraints analyzed in the detailed report include:
- Tightening VOC Limits for Industrial Air Streams
- Rapid Expansion of Pharmaceutical API Capacity
- Competition from Silica Gel, Biochar and Advanced Membranes
For complete list of drivers and restraints, kindly check the Table Of Contents.
Segment Analysis
Granular activated carbon accounted for 45.78% of 2025 shipments, a figure that underscores its entrenched use in municipal beds designed to meet the EPA's 4 ppt PFAS ceiling. A single 30 MGD facility, such as Veolia's Stanton plant, loads 1.68 million pounds across 42 vessels, showcasing the tonnage discipline utilities lock into when entering long-dated service contracts. Granular grades ranging from 0.6 mm to 2.4 mm balance pressure drop with efficient regeneration, and five domestic kilns keep trucking lanes short for reactivation loops. Although the United States activated carbon market faces hybrid contenders, most utilities retain granular beds for multi-contaminant removal beyond PFAS, from geosmin taste episodes to agricultural runoff organics.
Extruded or pelletized forms capture the fastest 4.18% CAGR as the California Air Resources Board boosts evaporative canister standards that require uniform macropores for lifetime hydrocarbon retention. Ingevity credits 70% of its specialty carbon sales to the auto sector, yet saw a 5% dip in 2024 revenue tied to OEM destocking and Asian imports. Pellet demand also grows in commercial air purification, where cylindrical 4 mm pellets reduce the energy required by blowers. Carbonxt placed its Kentucky extrusion line onstream in Q1 2025 at 10,000 tpa, cutting lead times to Midwest and Southeast clients. Powdered activated carbon maintains seasonal swings for taste and odor spikes and brominated PAC injections for coal mercury, giving the United States activated carbon market a balanced product mosaic without undermining granular's core share.
The United States Activated Carbon Market Report is Segmented by Product Type (Powdered Activated Carbon, and Granular Activated Carbon), Raw Material (Gas Purification, Water Purification, Metal Extraction, Medicine, and More), and End-User Industry (Water Treatment, Food and Beverage, Healthcare, Automotive, Industrial Processing, and Other End-User Industries). The Market Forecasts are Provided in Terms of Volume (tons).
List of Companies Covered in this Report:
- Advanced Emissions Solutions, Inc.
- Albemarle Corporation
- Arq, Inc.
- Boyce Carbon.
- Cabot Corporation
- Carbon Activated Corporation
- CarbUSA
- CPL Activated Carbons
- Donau Chemie AG
- Evoqua Water Technologies LLC
- General Carbon Corporation
- Ingevity
- JACOBI CARBONS GROUP
- Kuraray Co., Ltd.
- Kureha Corporation
- Prominent Systems, Inc.
- Puragen Activated Carbons
- Veolia
Additional Benefits:
- The market estimate (ME) sheet in Excel format
- 3 months of analyst support
TABLE OF CONTENTS
1 Introduction
- 1.1 Study Assumptions & Market Definition
- 1.2 Scope of the Study
2 Research Methodology
3 Executive Summary
4 Market Landscape
- 4.1 Market Overview
- 4.2 Market Drivers
- 4.2.1 EPA Regulations on PFAS/PFOA in Drinking Water
- 4.2.2 Phase-Out of Mercury Emissions from Coal-Fired Utilities
- 4.2.3 Tightening VOC Limits for Industrial Air Streams
- 4.2.4 Rapid Expansion of Pharmaceutical API Capacity
- 4.2.5 Grid-Scale Supercapacitor Projects Using Activated Carbon
- 4.3 Market Restraints
- 4.3.1 High Energy Cost of Virgin Steam Activation
- 4.3.2 Competition from Silica Gel, Biochar and Advanced Membranes
- 4.3.3 Climate-Driven Supply Risk for Coconut-Shell Feedstocks
- 4.4 Value Chain Analysis
- 4.5 Porter's Five Forces
- 4.5.1 Bargaining Power of Suppliers
- 4.5.2 Bargaining Power of Consumers
- 4.5.3 Threat of New Entrants
- 4.5.4 Threat of Substitute Products and Services
- 4.5.5 Degree of Competition
5 Market Size & Growth Forecasts (Volume)
- 5.1 By Product Type
- 5.1.1 Powdered Activated Carbon
- 5.1.2 Granular Activated Carbon
- 5.1.3 Extruded or Pelletized Activated Carbon
- 5.2 By Raw Material
- 5.2.1 Gas Purification
- 5.2.2 Water Purification
- 5.2.3 Metal Extraction
- 5.2.4 Medicine
- 5.2.5 Other Applications
- 5.3 By End-User Industry
- 5.3.1 Water Treatment
- 5.3.2 Food and Beverage
- 5.3.3 Healthcare
- 5.3.4 Automotive
- 5.3.5 Industrial Processing
- 5.3.6 Other End-user Industries
6 Competitive Landscape
- 6.1 Market Concentration
- 6.2 Strategic Moves
- 6.3 Market Share (%)/ Ranking Analysis
- 6.4 Company Profiles (includes Global level Overview, Market level overview, Core Segments, Financials as available, Strategic Information, Market Rank/Share for key companies, Products & Services, and Recent Developments)
- 6.4.1 Advanced Emissions Solutions, Inc.
- 6.4.2 Albemarle Corporation
- 6.4.3 Arq, Inc.
- 6.4.4 Boyce Carbon.
- 6.4.5 Cabot Corporation
- 6.4.6 Carbon Activated Corporation
- 6.4.7 CarbUSA
- 6.4.8 CPL Activated Carbons
- 6.4.9 Donau Chemie AG
- 6.4.10 Evoqua Water Technologies LLC
- 6.4.11 General Carbon Corporation
- 6.4.12 Ingevity
- 6.4.13 JACOBI CARBONS GROUP
- 6.4.14 Kuraray Co., Ltd.
- 6.4.15 Kureha Corporation
- 6.4.16 Prominent Systems, Inc.
- 6.4.17 Puragen Activated Carbons
- 6.4.18 Veolia
7 Market Opportunities and Future Outlook
- 7.1 White-space and Unmet-Need Assessment
 活性碳產品市場-全球產業規模、佔有率、趨勢、機會和預測:按原料、應用、分銷通路、地區和競爭格局分類,2021-2031年
 活性碳市場:2026-2032年全球市場預測(依產品類型、原料、孔徑分佈、製造流程、最終用戶、分銷管道及應用分類)廢氣吸附淨化系統市場:依技術、吸附劑類型、產品類型、運作模式、流量、應用和最終用戶分類-2026-2032年全球預測竹粒活性碳市場:依原料、製造流程、粒徑、應用及通路-2026-2032年全球預測腐蝕性氣體吸附分析儀市場:依技術、終端用戶產業及通路分類,全球預測(2026-2032年)顆粒活性碳接觸器市場:依應用、階段、最終用戶、操作模式和系統配置分類,全球預測,2026-2032年
 全球活性碳市場(2026-2036)
 擠壓活性碳市場規模、佔有率和成長分析:按類型、功能、物理形態、包裝類型、應用、最終用戶和地區分類-2026-2033年產業預測
 活性碳基非不織布市場分析及預測(至2035年):類型、產品類型、應用、材料類型、技術、最終用戶、功能、形式、安裝類型全球活性碳市場規模、佔有率、趨勢和成長分析報告(2026-2034)