


 |
市場調查報告書
商品編碼
1934630
特種石墨:市場佔有率分析、產業趨勢與統計、成長預測(2026-2031)Special Graphite - Market Share Analysis, Industry Trends & Statistics, Growth Forecasts (2026 - 2031) |
||||||
※ 本網頁內容可能與最新版本有所差異。詳細情況請與我們聯繫。
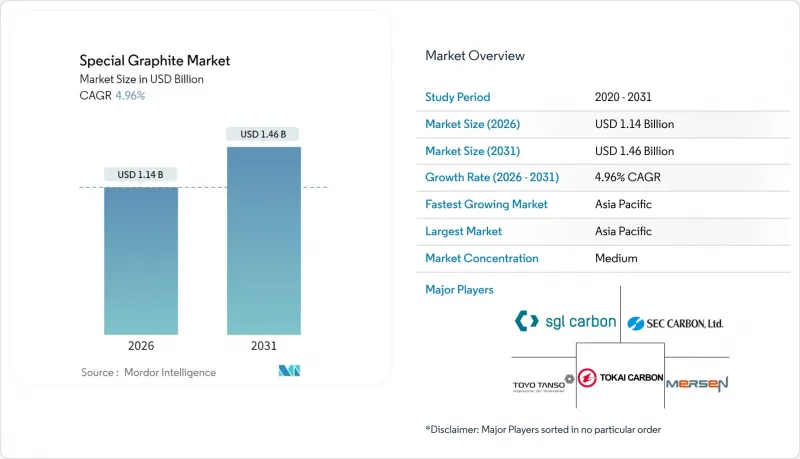
預計到 2025 年,特種石墨市場價值將達到 10.9 億美元,從 2026 年的 11.4 億美元成長到 2031 年的 14.6 億美元。
預計在預測期(2026-2031 年)內,複合年成長率將達到 4.96%。
在脫碳政策、太陽能晶片產量增加以及歐美電池負極材料本地化程度不斷提高的背景下,對高純度等向性石墨和模壓級石墨的需求正超越傳統鋼電極的範疇。中國將於2024年推出天然鱗片石墨出口許可證制度,美國將於2026年徵收25%的關稅,運作舉措正在加速非中國原料的合格,並促使歐美閒置產能暫停狀態。鑄造廠從金屬模具轉向石墨模具用於複雜合金鑄造、半導體坩堝需求以及太陽能熱點地區的消費,都支撐著終端市場的多元化發展。同時,鈉離子電池的替代風險限制了其長期銷售前景。在這種競爭激烈的環境下,能夠保證雜質含量低於10 ppm並提供ISO 9001和ISO 14001認證的供應商更具優勢,因為買家越來越重視原產地而非最低成本。整體而言,特種石墨市場集中度適中,但技術差異化程度較高,這為西方和日本的老牌企業捍衛其有利可圖的細分市場留下了空間。
全球特種石墨市場趨勢與洞察
政府脫碳政策推動了對太陽能晶片的需求
實現淨零排放太陽能發電的藍圖正引領吉瓦級規模的擴張,每安裝1吉瓦太陽能發電系統就需要消耗180至220噸高純度石墨坩堝和高溫區組件。歐盟的目標是到2030年實現750吉瓦的太陽能發電裝置容量,這將每年額外產生超過3萬噸石墨的需求。同時,中國的「十四五」計畫要求到2030年風能和太陽能發電總裝置容量達到1,200吉瓦。印度2024年推出的光學模組生產連結獎勵計畫(PLI)將進一步擴大區域消費品需求。由於政策支持的採購週期使供應商能夠預測未來多年的需求,有助於證明資本投資的合理性,因此這種需求促進因素受鋼鐵週期固有波動的影響較小。
美國和歐盟電動車電池本地化將推動對特種石墨的需求。
《通膨控制法案》規定,到2027年將取消對中國產電池材料的補貼,促使非中國石墨計劃激增。 Nouveau Monde Graphite公司成功從通用汽車和Panasonic能源公司資金籌措,用於每年從魁北克採購3.6萬噸片狀石墨。Panasonic還與Novonix公司位於田納西州的工廠簽訂了契約,每年採購1萬噸合成石墨。歐洲《關鍵材料法案》(將於2023年生效)要求在2030年實現40%的國內加工,為此,Mersen公司將其在美國的等向性石墨產能擴大至每年1.6萬噸。如今,西方電池製造商願意為可追溯的原料支付20%至30%的溢價,利潤也逐漸流向認證供應商。
原料薄片供應集中在中國會增加採購風險
2024年,中國佔全球天然石墨開採量的77%,陽極級精煉石墨的產量佔比超過90%。 2023年12月實施的出口許可限制暫時抑制了石墨的出貨,暴露了供應鏈的脆弱性。從莫三比克的巴拉馬到加拿大的拉克德伊勒,非中國地區的石墨計劃面臨著資金籌措挑戰和長達12-18個月的客戶認證週期,這導致西方市場石墨價格上漲15-20%,並加劇了庫存積壓。
細分市場分析
至2025年,等向性石墨將佔特種石墨市場47.90%的佔有率,年複合成長率(CAGR)為5.44%,主要受半導體坩堝、電火花加工電極和綠色氫氣板需求的推動。 Mersen公司正在將其在美國的晶圓廠用石墨產能擴大至1.6萬噸,而弗勞恩霍夫研究所的雙極板技術創新預計將使需求每年增加3萬噸。用於電極和連鑄模具的擠壓石墨面臨產能過剩的問題,此前東海碳素公司計劃在2025年7月將其在日本的電極產量削減50%,在歐洲削減30%。成型石墨的需求成長得益於中東地區鋁冶煉業的擴張,而軟性箔材產品則滿足了電動車溫度控管墊片的需求。雜質含量低於10ppm的供應商已獲得多年銷售契約,從而保障了其收入免受鋼鐵需求週期性波動的影響。
區域分析
亞太地區預計在2025年將佔總營收的45.70%,並在預測期(2026-2031年)內維持6.42%的年均成長率。中國在上游採礦和精煉領域處於領先地位,而日本由於國內電極需求下降,已將重點轉向精細碳組分。同時,韓國正透過浦項鋼鐵未來M公司(POSCO Future M)從莫三比克採購片狀碳。印度的光學模組生產關聯補貼(PLI)計畫正在刺激坩堝需求,並為國內加工商創造機會。
北美佔據特種石墨市場的大部分佔有率。維達利亞公司年產11,300噸球墨鑄鐵廠和比爾拉碳素公司在南卡羅來納州投資10億美元的計劃都反映了反通膨立法的益處。計劃於2026年對中國石墨徵收25%的關稅,以及大規模建設超級工廠的浪潮,都在推動著該地區的成長,但12至18個月的認證週期卻構成了一大障礙。
歐洲市場佔有率主要由半導體、汽車和可再生能源設備產業推動。 SGL Carbon半導體銷售額成長30%,與中國因成本壓力而減少陽極材料研發投入形成鮮明對比。 REACH粉塵法規推高了合規成本,而《關鍵材料法》則鼓勵國內加工。
南美洲和中東及非洲地區為鋁提煉提供鋁片和陰極鋁原料,但基礎設施不足限制了近期的發展。
其他福利:
- Excel格式的市場預測(ME)表
- 分析師支持(3個月)
目錄
第1章 引言
- 研究假設和市場定義
- 調查範圍
第2章調查方法
第3章執行摘要
第4章 市場情勢
- 市場概覽
- 市場促進因素
- 政府脫碳政策提振了對太陽能晶片的需求
- 歐盟和美國電動車電池供應鏈的本地化將推動對特殊石墨的需求。
- 向富矽大尺寸負極材料過渡,需要高純度石墨
- 複雜合金的鑄造正擴大用石墨模具取代金屬模具。
- 利用等靜壓石墨快速擴展綠色氫電解槽板
- 市場限制
- 由於原料薄片供應集中在中國,採購風險增加。
- 鈦酸鋰 (LTO) 和鈉離子化學領域的創新減少了石墨的使用量
- 歐盟的 REACH 法規將透過收緊對石墨粉塵排放的限制來增加資本支出 (CAPEX)。
- 價值鏈分析
- 波特五力模型
- 供應商的議價能力
- 買方的議價能力
- 新進入者的威脅
- 替代品的威脅
- 競爭程度
第5章 市場規模與成長預測
- 依產品類型
- 擠壓石墨
- 等向性石墨
- 模壓石墨
- 其他類型
- 按最終用戶行業分類
- 電子產業
- 太陽能產業
- 鑄造和冶金行業
- 其他最終用戶
- 按地區
- 亞太地區
- 中國
- 日本
- 韓國
- 印度
- 亞太其他地區
- 北美洲
- 美國
- 加拿大
- 墨西哥
- 歐洲
- 德國
- 英國
- 法國
- 義大利
- 俄羅斯
- 其他歐洲地區
- 南美洲
- 巴西
- 阿根廷
- 其他南美洲
- 中東和非洲
- 沙烏地阿拉伯
- 南非
- 阿拉伯聯合大公國
- 其他中東和非洲地區
- 亞太地區
第6章 競爭情勢
- 市場集中度
- 策略趨勢
- 市佔率(%)/排名分析
- 公司簡介
- Entegris, Inc.
- Fangda Carbon New Material Co. Ltd
- GrafTech International
- Graphite India Limited
- MERSEN PROPERTY
- Morgan Advanced Materials Plc
- Nippon Carbon Co. Ltd
- Pingdingshan City Kaiyuan Specialty Graphite Ltd
- Schunk Carbon Technology
- SEC CARBON, Limited
- SGL Carbon
- Tokai Carbon Co., Ltd.
- Toyo Tanso Co., Ltd.
- Yichang Xincheng Graphite Co., Ltd.
第7章 市場機會與未來展望
The Special Graphite Market was valued at USD 1.09 billion in 2025 and estimated to grow from USD 1.14 billion in 2026 to reach USD 1.46 billion by 2031, at a CAGR of 4.96% during the forecast period (2026-2031).
Decarbonization policies, solar-wafer build-outs, and Western battery-anode localization are expanding high-purity isotropic and molded grades beyond traditional steel electrodes. China's 2024 export-license regime for natural flake and the 25% United States tariff set for 2026 are accelerating the qualification of non-Chinese feedstocks and the restarts of dormant Western capacity. Foundry migration from metal to graphite molds in complex-alloy casting, semiconductor crucible demand, and photovoltaic hot-zone consumption underpin resilient end-market diversity, while substitution risks from sodium-ion chemistries temper longer-range volume expectations. Competitive dynamics favor suppliers who can certify sub-10-ppm impurity levels and offer ISO 9001 and ISO 14001 compliance, as buyers increasingly emphasize provenance over the lowest cost. Overall, the special graphite market remains moderately consolidated yet technically differentiated, giving Western and Japanese incumbents scope to defend high-margin niches.
Global Special Graphite Market Trends and Insights
Government Decarbonization Policies Boosting Solar Wafer Demand
Net-zero roadmaps are translating into gigawatt-scale photovoltaic expansions that consume high-purity graphite crucibles and hot-zone parts at 180-220 t per installed gigawatt. The European Union targets 750 GW by 2030, adding more than 30,000 t of graphite annually, while China's 14th Five-Year Plan mandates 1,200 GW of combined wind and solar capacity by the same year. India's 2024 production-linked incentive for solar modules further amplifies localized consumable demand. Policy-locked procurement cycles give suppliers multi-year volume visibility and justify capacity investments, insulating this driver from typical steel-cycle volatility.
EV Battery Localization in United States and European Union Sparking Specialty Graphite Offtake
Inflation Reduction Act rules phasing out Chinese battery materials from subsidies by 2027 have triggered non-Chinese graphite projects. Nouveau Monde Graphite secured USD 50 million from General Motors and Panasonic Energy to supply 36,000 t/yr of flake from Quebec, and Panasonic additionally contracted 10,000 t/yr of synthetic graphite from Novonix's Tennessee plant. Europe's Critical Raw Materials Act, effective 2023, compels 40% domestic processing by 2030, prompting Mersen to raise US isotropic capacity to 16,000 t/yr. Western cell makers now accept 20-30% price premiums for traceable feedstocks, shifting margin to certified suppliers.
Sino-Centric Raw-Flake Supply Concentration Raising Procurement Risk
China mined 77% of global natural graphite and refined over 90% of anode-grade output in 2024. December 2023 export license controls briefly curbed shipments, revealing supply chain fragility. Non-Chinese projects-from Mozambique's Balama to Canada's Lac des Iles-face financing challenges and 12-18-month customer-qualification cycles, which embed a 15-20% risk premium into Western pricing and incentivize inventory stockpiling.
Other drivers and restraints analyzed in the detailed report include:
- Shift to Large-Format Si-Rich Anodes Requiring Higher-Purity Graphite
- Foundry Migration from Metal Molds to Graphite Molds for Complex Alloys
- Breakthroughs in Lithium Titanium Oxide and Sodium-Ion Chemistries Reducing Graphite Intensity
For complete list of drivers and restraints, kindly check the Table Of Contents.
Segment Analysis
Isotropic graphite held 47.90% of the special graphite market share in 2025 and is growing at a 5.44% CAGR, fueled by semiconductor crucibles, EDM electrodes, and green-hydrogen plates. Mersen lifted US capacity to 16,000 t to serve wafer fabs, and Fraunhofer's bipolar-plate breakthrough could add 30,000 t annual demand. Extruded graphite, used in electrodes and continuous-casting molds, faces structural overcapacity after Tokai Carbon's 50% Japanese and 30% European electrode cuts by July 2025. Molded graphite grows alongside Middle East aluminum smelting, while flexible foils address thermal management gaskets in EVs. Suppliers achieving sub-10-ppm impurity win multiyear offtakes, insulating revenue from cyclical steel swings.
The Special Graphite Market Report is Segmented by Product Type (Extruded Graphite, Isotropic Graphite, Molded Graphite, and Other Types), End-User Industry (Electronics, Photovoltaic, Foundry and Metallurgy, and Other End-Users), and Geography (Asia-Pacific, North America, Europe, South America, and Middle East and Africa). The Market Forecasts are Provided in Terms of Value (USD).
Geography Analysis
The Asia-Pacific region dominated 45.70% of 2025 revenue and is expected to grow at a rate of 6.42% during the forecast period (2026-2031). China anchors upstream mining and refining, yet Japan shifts focus to fine-carbon parts after domestic electrode cuts, while South Korea secures Mozambican flake via Posco Future M. India's PLI scheme for solar modules stimulates crucible demand and domestic fabricator opportunities.
North America captures a substantial share of the special graphite market. Vidalia's 11,300 t spherical plant and Birla Carbon's USD 1 billion South Carolina project illustrate Inflation Reduction Act tailwinds. Tariffs rising to 25% on Chinese graphite in 2026 and a wave of gigafactory construction underpin regional growth, though 12-18-month qualification timelines remain a hurdle.
Europe's share, driven by semiconductor, automotive, and renewable installations. SGL Carbon's 30% jump in semiconductor sales contrasts with its exit from anode R&D due to Chinese cost pressure. REACH dust rules raise compliance costs, yet the Critical Raw Materials Act pushes domestic processing.
South America and the Middle East & Africa supply raw flake and aluminum-smelting cathodes but face infrastructure gaps that temper near-term expansion.
- Entegris, Inc.
- Fangda Carbon New Material Co. Ltd
- GrafTech International
- Graphite India Limited
- MERSEN PROPERTY
- Morgan Advanced Materials Plc
- Nippon Carbon Co. Ltd
- Pingdingshan City Kaiyuan Specialty Graphite Ltd
- Schunk Carbon Technology
- SEC CARBON, Limited
- SGL Carbon
- Tokai Carbon Co., Ltd.
- Toyo Tanso Co., Ltd.
- Yichang Xincheng Graphite Co., Ltd.
Additional Benefits:
- The market estimate (ME) sheet in Excel format
- 3 months of analyst support
TABLE OF CONTENTS
1 Introduction
- 1.1 Study Assumptions & Market Definition
- 1.2 Scope of the Study
2 Research Methodology
3 Executive Summary
4 Market Landscape
- 4.1 Market Overview
- 4.2 Market Drivers
- 4.2.1 Government decarbonisation policies boosting solar wafer demand
- 4.2.2 EV-battery supply-chain localisation in United States and European Union sparking specialty graphite offtake
- 4.2.3 Shift to large-format Si-rich anodes that require higher-purity graphite
- 4.2.4 Foundry migration from metal molds to graphite molds for complex alloys
- 4.2.5 Rapid expansion of green-hydrogen electrolyser plates using isostatic graphite
- 4.3 Market Restraints
- 4.3.1 Sino-centric raw-flake supply concentration raises procurement risk
- 4.3.2 Breakthroughs in Lithium Titanium Oxide (LTO ) and sodium-ion chemistries reducing graphite intensity
- 4.3.3 Stricter EU REACH limits on graphite dust emissions increase CAPEX
- 4.4 Value Chain Analysis
- 4.5 Porter's Five Forces
- 4.5.1 Bargaining Power of Suppliers
- 4.5.2 Bargaining Power of Buyers
- 4.5.3 Threat of New Entrants
- 4.5.4 Threat of Substitutes
- 4.5.5 Degree of Competition
5 Market Size & Growth Forecasts (Value)
- 5.1 By Product Type
- 5.1.1 Extruded Graphite
- 5.1.2 Isotropic Graphite
- 5.1.3 Molded Graphite
- 5.1.4 Other Types
- 5.2 By End-user Industry
- 5.2.1 Electronics Industry
- 5.2.2 Photovoltaic Industry
- 5.2.3 Foundry and Metallurgy Industry
- 5.2.4 Other End-Users
- 5.3 By Geography
- 5.3.1 Asia-Pacific
- 5.3.1.1 China
- 5.3.1.2 Japan
- 5.3.1.3 South Korea
- 5.3.1.4 India
- 5.3.1.5 Rest of Asia-Pacific
- 5.3.2 North America
- 5.3.2.1 United States
- 5.3.2.2 Canada
- 5.3.2.3 Mexico
- 5.3.3 Europe
- 5.3.3.1 Germany
- 5.3.3.2 United Kingdom
- 5.3.3.3 France
- 5.3.3.4 Italy
- 5.3.3.5 Russia
- 5.3.3.6 Rest of Europe
- 5.3.4 South America
- 5.3.4.1 Brazil
- 5.3.4.2 Argentina
- 5.3.4.3 Rest of South America
- 5.3.5 Middle East and Africa
- 5.3.5.1 Saudi Arabia
- 5.3.5.2 South Africa
- 5.3.5.3 United Arab Emirates
- 5.3.5.4 Rest of Middle-East and Africa
- 5.3.1 Asia-Pacific
6 Competitive Landscape
- 6.1 Market Concentration
- 6.2 Strategic Moves
- 6.3 Market Share(%)/Ranking Analysis
- 6.4 Company Profiles (includes Global level Overview, Market level overview, Core Segments, Financials as available, Strategic Information, Market Rank/Share, Products & Services, Recent Developments)
- 6.4.1 Entegris, Inc.
- 6.4.2 Fangda Carbon New Material Co. Ltd
- 6.4.3 GrafTech International
- 6.4.4 Graphite India Limited
- 6.4.5 MERSEN PROPERTY
- 6.4.6 Morgan Advanced Materials Plc
- 6.4.7 Nippon Carbon Co. Ltd
- 6.4.8 Pingdingshan City Kaiyuan Specialty Graphite Ltd
- 6.4.9 Schunk Carbon Technology
- 6.4.10 SEC CARBON, Limited
- 6.4.11 SGL Carbon
- 6.4.12 Tokai Carbon Co., Ltd.
- 6.4.13 Toyo Tanso Co., Ltd.
- 6.4.14 Yichang Xincheng Graphite Co., Ltd.
7 Market Opportunities and Future Outlook
- 7.1 White-space and Unmet-need Assessment
 全球等向性石墨市場規模、佔有率、趨勢和成長分析報告(2026-2034年)
 石墨市場:按類型、純度、形態、應用和最終用途產業分類-2026-2032年全球市場預測
 石墨市場:按產品類型、應用和地區分類綠色石墨市場:2026-2032年全球市場預測(依石墨類型、純度等級、形態、應用及最終用戶產業分類)
 《2026年版全球碳化矽塗層基座市場研究報告》碳化矽塗層石墨載體市場:全球預測(2026-2032 年),按晶圓尺寸、塗層厚度、應用和最終用戶分類高純度石墨市場按應用、類型、形態和純度等級分類,全球預測(2026-2032年)
 日本石墨市場規模、佔有率、趨勢和預測:按類型、應用、最終用途行業和地區分類,2026-2034年
 2026年全球石墨市場報告2026年全球熱解石墨市場報告