


 |
市場調查報告書
商品編碼
1934583
亞太地區汽車零件:市場佔有率分析、產業趨勢與統計、成長預測(2026-2031)Asia-Pacific Automotive Parts And Components - Market Share Analysis, Industry Trends & Statistics, Growth Forecasts (2026 - 2031) |
||||||
※ 本網頁內容可能與最新版本有所差異。詳細情況請與我們聯繫。
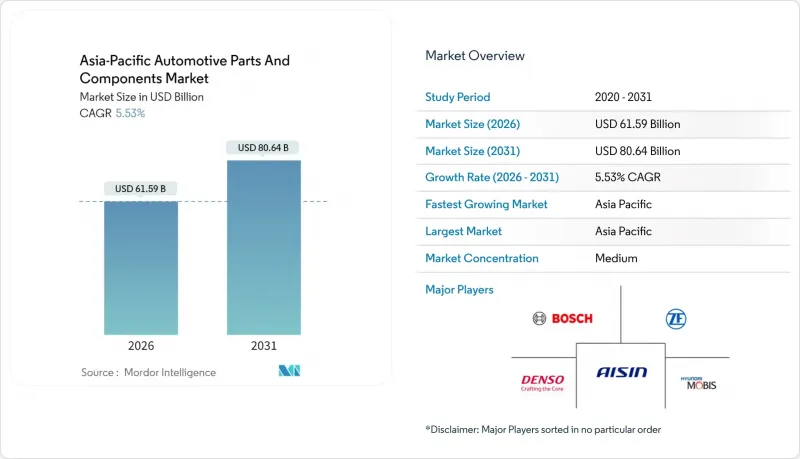
預計到2026年,亞太地區汽車零件市場規模將達615.9億美元。
這意味著從 2025 年的 583.6 億美元成長到 2031 年的 806.4 億美元,2026 年至 2031 年的複合年成長率為 5.53%。
強勁的電氣化政策、中國和印度新車生產線的擴張以及高級駕駛輔助系統(ADAS)的日益普及,正在塑造這一成長路徑。汽車製造商正在加速推出電池式電動車,從而推動對輕質合金和高附加價值電子元件的需求。同時,積層製造技術正在縮短產品開發週期並降低模具成本。東南亞國協的在地採購要求正在推動區域供應鏈重組,而成熟市場老舊車輛的增加則促進了替換零件業務的發展。然而,原料價格波動、半導體短缺以及法規結構的分散正在阻礙短期成長。在亞太地區汽車零件市場,擁有規模、軟體專業知識和靈活籌資策略的供應商仍具有優勢。
亞太地區汽車零件市場趨勢及洞察
擴大中國和印度的汽車產能
預計到2024年,中國汽車產量將達到3,128萬輛,其中新能源汽車將超過1,000萬輛,這將鞏固其作為精密動力傳動系統和電控系統主要需求來源的地位。印度正在建造數十億美元的待開發區工廠,用於全球出口,並鼓勵一級供應商實現先進鑄造、鍛造和半導體封裝生產線的本地化生產。這兩個市場都在努力提高出口比例,這促使零件製造商在保持成本優勢的同時,滿足國際認證標準。亞太地區的汽車零件市場正受益於此快速成長的產量,但供應商必須實現貨源多元化,以規避單一國家經濟放緩的風險,並遵守各地不同的在地採購法規。
先進汽車電子/ADAS技術的廣泛應用
中國供應商控制全球一半的雷射雷達產量,而新的法規要求到2025年,新車必須達到L3級自動駕駛水準。純電動車(BEV)平均包含的半導體數量是內燃機車型的兩倍,這推動了從晶片到軟體的垂直整合。供應商必須將功能安全韌體與空中下載(OTA)更新架構結合,並投資於網路安全彈性測試。亞太地區的汽車零件市場正向電子技術專家傾斜,這提高了純機械零件供應商的進入門檻。
原物料價格波動
能源轉型需求和採礦許可證核准延遲將推動鋁、銅和鎳的價格在2026年之前持續上漲。中國供應約85%的稀土元素氧化物,使得磁力牽引馬達面臨供應集中風險。零件製造商正尋求透過避險協議和閉合迴路回收來緩衝成本衝擊。射出成型複合材料零件和高強度鋼材因其單位重量成本優勢而日益受到歡迎。然而,大宗商品價格的突然上漲正在擠壓利潤空間,並阻礙亞太地區汽車零件市場的產能擴張。
細分市場分析
到2025年,傳動系統和動力傳動系統仍將保持其在亞太汽車零件市場的領先地位,市場佔有率將達到34.72%,這主要得益於其在內燃機(ICE)、混合動力和純電動車(BEV)平台上的通用相容性。同時,電子元件將以7.29%的複合年成長率成長,主要由嵌入式駕駛輔助系統(ADAS)感測器、區域控制器和高壓轉換單元推動。乘用車製造商正在加速採用集中式域架構,將多種功能整合到整合晶片上,從而擴大了電子元件的材料清單(BOM)。此外,零件製造商還必須遵守不斷發展的網路安全法規,例如UNECE R155,這增加了軟體開銷,同時也有利於擁有內部加密技術的成熟一級供應商。
在內飾和外觀領域,擴增實境抬頭顯示器和永續裝飾基材等車廂豪華化趨勢正在推動市場發展。車身和底盤供應商正在轉向採用相容千兆鑄造工藝的鋁材,以減少焊接並提高結構剛性。輪轂和輪胎供應商正在推出低滾動阻力配方,以應對電動車重量增加的問題。過濾業務正在拓展至車內高效能空氣微粒過濾器(HEPA)系統和電池動力傳動系統總成用介電液體過濾器。因此,亞太汽車零件市場正在向電氣化設計轉型,其中電子元件佔據了很大一部分附加價值。
到2025年,乘用車仍將佔零件需求的63.05%,而摩托車將以8.12%的複合年成長率成為成長最快的領域,這主要得益於稅收優惠、低成本的電池更換網路以及緩解都市區堵塞的政策。預計到2030年,電動Scooter的銷量將有所成長,從而帶動對小型牽引馬達和固態控制器的需求。商用車正採用純電動動力系統進行最後一公里物流運輸,日本計畫於2028年強制設立零排放貨運區。非公路車輛製造商正在測試用於採礦和建築行業的自動駕駛和混合動力裝載機,這些裝載機整合了環境感測器和遠端資訊處理技術。
零件供應商需要滿足截然不同的材料清單(BOM) 需求:乘用車需要先進的駕駛輔助電子設備,而低壓二輪車則更注重成本效益高的電源模組和堅固耐用的充電連接器。擁有模組化產品系列的公司能夠同時滿足這兩種極端需求,既能維持大規模生產,又能從高階乘用車產品線中獲得高利潤。因此,亞太地區的汽車零件市場非常重視靈活的製造地和敏捷的工程團隊。
其他福利:
- Excel格式的市場預測(ME)表
- 3個月的分析師支持
目錄
第1章 引言
- 研究假設和市場定義
- 調查範圍
第2章調查方法
第3章執行摘要
第4章 市場情勢
- 市場概覽
- 市場促進因素
- 擴大中國和印度的汽車產能
- 加速全部區域電動車扶持獎勵
- 先進汽車電子/ADAS技術的廣泛應用
- 老舊車輛推動了高價值售後市場需求。
- 千兆廣播的快速擴張推動了對輕質合金的需求
- 東協電動車供應鏈供應商本地化要求
- 市場限制
- 原物料價格波動(鋼鐵、鋁、稀土)
- 半導體和物流瓶頸依然存在
- 原始設備製造商轉向內部軟體定義平台
- 亞太地區跨境合規成本分散
- 價值/供應鏈分析
- 監管環境
- 技術展望
- 波特五力模型
- 供應商的議價能力
- 買方的議價能力
- 新進入者的威脅
- 替代品的威脅
- 競爭對手之間的競爭
- 繪製各區域主要供應商地圖
第5章 市場規模與成長預測
- 按類型
- 傳動系統/動力傳動系統
- 內部和外部
- 電子設備
- 車身和底盤
- 車輪和輪胎
- 其他部件(過濾器、流體相關部件等)
- 按車輛類型
- 搭乘用車
- 商用車輛
- 摩托車
- 非公路用車輛
- 透過推廣
- 內燃機(ICE)
- 電池式電動車(BEV)
- 混合動力電動車(HEV)
- 插電式混合動力車(PHEV)
- 燃料電池電動車(FCEV)
- 替代燃料(壓縮天然氣、液化石油氣、生質燃料)
- 按銷售管道
- OEM
- 售後市場
- 原廠零件服務 (OES)
- 獨立電子商務售後市場
- 材料
- 鋼材
- 鋁
- 複合材料
- 塑膠和聚合物
- 其他(鎂、碳纖維)
- 透過製造程序
- 沖壓加工和鍛造
- 鑄造(模鑄、砂型鑄造、失蠟鑄造)
- 加工
- 積層製造
- 按國家/地區
- 中國
- 印度
- 日本
- 韓國
- 泰國
- 印尼
- 越南
- 澳洲和紐西蘭
- 亞太其他地區
第6章 競爭情勢
- 市場集中度
- 策略趨勢
- 市佔率分析
- 公司簡介
- DENSO Corporation
- Robert Bosch GmbH
- Aisin Corporation
- ZF Friedrichshafen AG
- Continental AG
- Hyundai Mobis Co., Ltd.
- Magna International Inc.
- Mitsubishi Electric Corporation
- Hitachi Astemo, Ltd.
- Panasonic Automotive Systems Co., Ltd.
- Magneti Marelli SpA
- HELLA GmbH & Co. KGaA
- Lear Corporation
- Valeo SA
- Faurecia SE(FORVIA)
- Nidec Corporation
- Cummins Inc.
- Motherson Sumi Systems Ltd.
- Yazaki Corporation
- Toyota Boshoku Corporation
- GKN Automotive
- NSK Ltd.
- NTN Corporation
第7章 市場機會與未來展望
The Asia-Pacific automotive components market size in 2026 is estimated at USD 61.59 billion, growing from 2025 value of USD 58.36 billion with 2031 projections showing USD 80.64 billion, growing at 5.53% CAGR over 2026-2031.
Robust electrification policies, new vehicle-production lines in China and India, and broader deployment of advanced driver-assistance systems shape this growth path. Automakers accelerate battery-electric rollouts, driving demand for lightweight alloys and high-value electronics, while additive manufacturing shortens product-development cycles and trims tooling costs. Localization mandates across ASEAN economies spur regional supply-chain realignment, and aging fleets in mature markets bolster the replacement-parts business. Nevertheless, raw-material cost swings, semiconductor shortages, and fragmented regulatory frameworks restrain near-term momentum. The Asia-Pacific automotive components market continues to reward suppliers that pair scale with software expertise and resilient sourcing strategies.
Asia-Pacific Automotive Parts And Components Market Trends and Insights
Expansion of Vehicle-Production Capacity in China and India
China produced 31.28 million vehicles in 2024, including more than 10 million new-energy models, reinforcing its position as the primary demand engine for precision powertrain and electronic-control units . India follows with multi-billion-dollar green-field plants geared toward global exports, prompting tier-one suppliers to localize advanced casting, forging, and semiconductor packaging lines. Both markets target higher export ratios, compelling component makers to align with international homologation standards while safeguarding cost advantages. The Asia-Pacific automotive components market benefits from this volume surge, yet suppliers must diversify sourcing to hedge against single-country slowdowns and comply with divergent local-content rules.
Rising Adoption of Advanced Automotive Electronics / ADAS
Chinese suppliers control half of global LiDAR output, and new regulations mandate Level 3 autonomy readiness of new cars by 2025 . Semiconductor content per battery electric vehicle averages twice that of internal combustion models, encouraging vertically integrated chip-to-software stacks. Suppliers must pair functional safety firmware with over-the-air update architectures and invest in cyber-resilience testing. The Asia-Pacific automotive components market tilts toward electronics specialists, raising the entry barrier for purely mechanical vendors.
Raw-Material Price Volatility
Aluminum, copper, and nickel prices trend upward through 2026 as energy-transition demand collides with mining-permit delay . China supplies roughly 85% of rare-earth oxides, underscoring concentration risk for magnet-driven traction motors. Component manufacturers engage in hedging contracts and closed-loop scrap recycling to buffer cost shocks. Insert-molded composite parts and high-strength steel grades also gain favor for cost-to-weight advantages. Still, sudden commodity price spikes squeeze margins and slow capacity expansion in the Asia-Pacific automotive components market.
Other drivers and restraints analyzed in the detailed report include:
- Accelerated EV-Friendly Incentives Across Asia-Pacific
- ASEAN Localization Mandates for EV Supply-Chain Vendors
- OEM Shift to Captive Software-Defined Platforms
For complete list of drivers and restraints, kindly check the Table Of Contents.
Segment Analysis
Driveline & Powertrain retained the leading 34.72% slice of the Asia-Pacific automotive components market share in 2025, anchored by universal fitment across ICE, hybrid, and battery-electric platforms. Electronics, however, is growing at a 7.29% CAGR, propelled by embedded ADAS sensors, zonal controllers, and high-voltage conversion units. Passenger-car OEMs increasingly adopt centralized domain architectures that funnel multiple functions through consolidated chips, intensifying the electronics bill of materials. Component makers must also comply with evolving cybersecurity regulations, such as UNECE R155, which add software overhead but favor established tier-ones equipped with in-house encryption expertise.
Interiors and exteriors benefit from cabin premiumization trends, including augmented-reality head-up displays and sustainable trim substrates. Body and chassis suppliers pivot toward giga-casting-friendly aluminum grades that curtail weld points and improve structural rigidity. Wheel and tire vendors roll out low rolling-resistance compounds optimized for heavier EV curb weights. Filtration businesses expand into cabin HEPA systems and dielectric-fluid filters tailored for battery-electric powertrains. The net result is a portfolio shift toward electrification-ready designs, with electronics shouldering the lion's share of incremental value capture within the Asia-Pacific automotive components market.
Passenger cars continued to generate 63.05% of component demand in 2025, yet two-wheelers chart the fastest 8.12% CAGR on the back of favorable tax breaks, low-cost battery-swap networks, and urban congestion policies. Electric scooter sales are expected to climb by 2030, raising requirements for compact traction motors and solid-state controllers. Commercial vehicles adopt battery-electric drivelines for last-mile logistics, with Japan's mandatory zero-emission freight zones slated for 2028. Off-highway OEMs test autonomous and hybrid loaders for mining and construction, embedding ruggedized sensors and telematics.
Component suppliers navigate contrasting bill-of-material profiles: passenger cars demand sophisticated driver-assistance electronics, whereas low-voltage two-wheelers prioritize cost-optimized power modules and robust charging connectors. Firms with modular product families can cater to both ends of the spectrum, sustaining volume scale while capturing higher margins on premium passenger-car lines. Consequently, the Asia-Pacific automotive components market rewards flexible manufacturing footprints and agile engineering teams.
The Asia-Pacific Automotive Components Market Report is Segmented by Type (Driveline and Powertrain, and More), Vehicle Type (Passenger Cars, and More), Propulsion (Internal Combustion Engine, and More), Sales Channel (Original Equipment Manufacturers, and More), Material (Steel, and More), Manufacturing Process (Stamping and Forging, Casting, and More), and by Country. The Market Forecasts are Provided in Terms of Value (USD).
List of Companies Covered in this Report:
- DENSO Corporation
- Robert Bosch GmbH
- Aisin Corporation
- ZF Friedrichshafen AG
- Continental AG
- Hyundai Mobis Co., Ltd.
- Magna International Inc.
- Mitsubishi Electric Corporation
- Hitachi Astemo, Ltd.
- Panasonic Automotive Systems Co., Ltd.
- Magneti Marelli S.p.A.
- HELLA GmbH & Co. KGaA
- Lear Corporation
- Valeo SA
- Faurecia SE (FORVIA)
- Nidec Corporation
- Cummins Inc.
- Motherson Sumi Systems Ltd.
- Yazaki Corporation
- Toyota Boshoku Corporation
- GKN Automotive
- NSK Ltd.
- NTN Corporation
Additional Benefits:
- The market estimate (ME) sheet in Excel format
- 3 months of analyst support
TABLE OF CONTENTS
1 Introduction
- 1.1 Study Assumptions & Market Definition
- 1.2 Scope of the Study
2 Research Methodology
3 Executive Summary
4 Market Landscape
- 4.1 Market Overview
- 4.2 Market Drivers
- 4.2.1 Expansion of Vehicle-Production Capacity in China and India
- 4.2.2 Accelerated EV-Friendly Incentives Across APAC
- 4.2.3 Rising Adoption of Advanced Automotive Electronics / ADAS
- 4.2.4 Ageing Fleet Spurring High-Value Aftermarket Demand.
- 4.2.5 Rapid Giga casting Deployment Driving Lightweight-Alloy Demand
- 4.2.6 ASEAN Localization Mandates for EV Supply-Chain Vendors
- 4.3 Market Restraints
- 4.3.1 Raw-Material Price Volatility (Steel, Aluminum, Rare Earths)
- 4.3.2 Persistent Semiconductor and Logistics Bottlenecks
- 4.3.3 OEM Shift to Captive Software-Defined Platforms
- 4.3.4 Fragmented Cross-Border Compliance Costs Inside APAC
- 4.4 Value / Supply-Chain Analysis
- 4.5 Regulatory Landscape
- 4.6 Technological Outlook
- 4.7 Porter's Five Forces
- 4.7.1 Bargaining Power of Suppliers
- 4.7.2 Bargaining Power of Buyers
- 4.7.3 Threat of New Entrants
- 4.7.4 Threat of Substitute Products
- 4.7.5 Intensity of Competitive Rivalry
- 4.8 Key Suppliers Mapping Across the Region
5 Market Size & Growth Forecasts (Value, USD)
- 5.1 By Type
- 5.1.1 Driveline & Powertrain
- 5.1.2 Interiors & Exteriors
- 5.1.3 Electronics
- 5.1.4 Bodies & Chassis
- 5.1.5 Wheels & Tires
- 5.1.6 Other Components (Filtration, Fluids, etc.)
- 5.2 By Vehicle Type
- 5.2.1 Passenger Cars
- 5.2.2 Commercial Vehicles
- 5.2.3 Two-Wheelers
- 5.2.4 Off-Highway Vehicles
- 5.3 By Propulsion
- 5.3.1 Internal Combustion Engine (ICE)
- 5.3.2 Battery Electric Vehicles (BEV)
- 5.3.3 Hybrid Electric Vehicles (HEV)
- 5.3.4 Plug-in Hybrid Electric Vehicles (PHEV)
- 5.3.5 Fuel Cell Electric Vehicles (FCEV)
- 5.3.6 Alternative Fuels (CNG, LPG, Biofuels)
- 5.4 By Sales Channel
- 5.4.1 Original Equipment Manufacturers (OEM)
- 5.4.2 Aftermarket
- 5.4.2.1 Original Equipment Service (OES)
- 5.4.2.2 Independent Aftermarket and E-Commerce Aftermarket
- 5.5 By Material
- 5.5.1 Steel
- 5.5.2 Aluminium
- 5.5.3 Composites
- 5.5.4 Plastics & Polymers
- 5.5.5 Others (Magnesium, Carbon Fibre)
- 5.6 By Manufacturing Process
- 5.6.1 Stamping & Forging
- 5.6.2 Casting (Die, Sand, Investment)
- 5.6.3 Machining
- 5.6.4 Additive Manufacturing
- 5.7 By Country
- 5.7.1 China
- 5.7.2 India
- 5.7.3 Japan
- 5.7.4 South Korea
- 5.7.5 Thailand
- 5.7.6 Indonesia
- 5.7.7 Vietnam
- 5.7.8 Australia & New Zealand
- 5.7.9 Rest of Asia-Pacific
6 Competitive Landscape
- 6.1 Market Concentration
- 6.2 Strategic Moves
- 6.3 Market Share Analysis
- 6.4 Company Profiles (Includes Global-level Overview, Market-level Overview, Core Segments, Financials as available, Strategic Information, Market Rank/Share, Products & Services, Recent Developments)
- 6.4.1 DENSO Corporation
- 6.4.2 Robert Bosch GmbH
- 6.4.3 Aisin Corporation
- 6.4.4 ZF Friedrichshafen AG
- 6.4.5 Continental AG
- 6.4.6 Hyundai Mobis Co., Ltd.
- 6.4.7 Magna International Inc.
- 6.4.8 Mitsubishi Electric Corporation
- 6.4.9 Hitachi Astemo, Ltd.
- 6.4.10 Panasonic Automotive Systems Co., Ltd.
- 6.4.11 Magneti Marelli S.p.A.
- 6.4.12 HELLA GmbH & Co. KGaA
- 6.4.13 Lear Corporation
- 6.4.14 Valeo SA
- 6.4.15 Faurecia SE (FORVIA)
- 6.4.16 Nidec Corporation
- 6.4.17 Cummins Inc.
- 6.4.18 Motherson Sumi Systems Ltd.
- 6.4.19 Yazaki Corporation
- 6.4.20 Toyota Boshoku Corporation
- 6.4.21 GKN Automotive
- 6.4.22 NSK Ltd.
- 6.4.23 NTN Corporation
7 Market Opportunities & Future Outlook
 2026年全球汽車零件循環包裝市場報告
 汽車零件製造市場:2026-2032年全球市場預測(按產品類型、燃料類型、車輛類型、應用和分銷管道分類)汽車零件及配件市場:依產品類型、車輛類型、替換類型、通路分類,全球預測(2026-2032年)汽車座椅核心零件市場:依產品類型、車輛類型、動力系統、座椅類型、材質和銷售管道,全球預測,2026-2032年汽車組裝市場:依動力傳動系統、組裝工藝、車輛類型和最終用戶分類,全球預測,2026-2032年2026年全球汽車及零件銷售市場報告2026年全球汽車零件電子採購市場報告汽車胎壓監測系統(TPMS)輪胎氣門嘴市場按車輛類型、感測器類型、通路、技術和頻率分類,全球預測(2026-2032年)汽車金屬輪胎氣門嘴市場按氣門嘴類型、材料、車輛類型、分銷管道和應用分類-全球預測,2026-2032年
 美國的未來(第四部分):美國的工業