


 |
市場調查報告書
商品編碼
1911763
硬體防火牆:市場佔有率分析、產業趨勢與統計、成長預測(2026-2031)Hardware Firewall - Market Share Analysis, Industry Trends & Statistics, Growth Forecasts (2026 - 2031) |
||||||
※ 本網頁內容可能與最新版本有所差異。詳細情況請與我們聯繫。
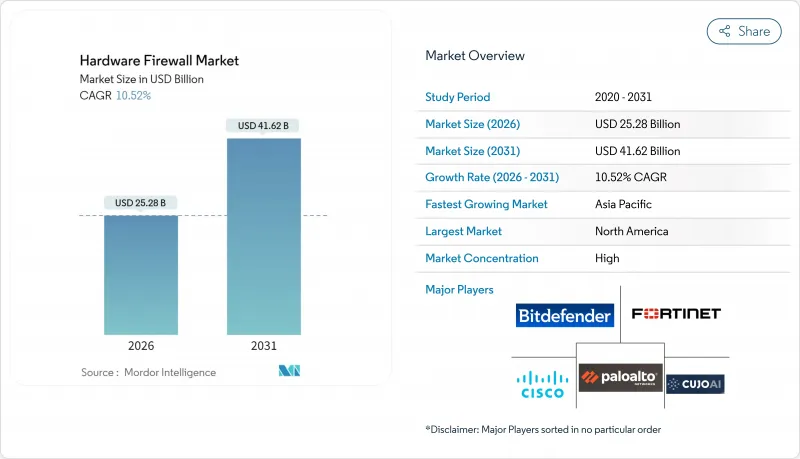
預計到 2025 年,硬體防火牆市場規模將達到 228.7 億美元,到 2026 年將達到 252.8 億美元,到 2031 年將達到 416.2 億美元,預測期(2026-2031 年)的複合年成長率為 10.52%。
聯邦政府和關鍵基礎設施網路採用零信任要求、邊緣運算的廣泛應用、5G網路的進步以及加密流量佔比超過90%等因素共同推動了市場需求。儘管設備/系統硬體仍然佔據大部分收入,但隨著企業從資本採購轉向基於績效的契約,託管服務的成長正在加速。大型企業正在推動Terabit特級設備的更新換代,而中小企業則透過採用簡化的統一威脅平台來實現增量成長。從區域來看,北美保持領先地位,而亞太地區則呈現最快成長,這主要得益於中國、印度和東協成員國正在將其法規結構與全球網路安全標準接軌。
全球硬體防火牆市場趨勢與洞察
隨著多面向網路攻擊變得日益複雜,對ASIC加速測試的需求也日益成長。
如今,威脅行為者正將勒索軟體、供應鏈攻擊和國家支持的行動結合起來,以突破以CPU為中心的偵測引擎。 CISA記錄顯示,2024年已知的被利用漏洞數量為1,132個,比2023年增加了23%。嵌入硬體設備的專用ASIC晶片能夠以線速處理加密流量,從而實現無延遲的即時威脅緩解。 Fortinet的SP5 ASIC平台可提供3.2 Tbps的吞吐量和亞微秒級的偵測延遲,展現了晶片級安全性能的突破。這些晶片整合的機器學習推理功能支援對基於特徵碼的引擎無法偵測到的零時差攻擊進行行為偵測。 NIST的網路安全框架2.0明確提及了用於關鍵基礎設施保護的硬體加速控制措施。
政府對聯邦和關鍵基礎設施網路的零信任強制要求
14028號行政命令,輔以98億美元的現代化資金,強制要求美國聯邦機構在2024會計年度之前採用零信任架構。這項強制令正在推動對能夠進行持續檢驗、微隔離和加密流量分析的高吞吐量設備的大量採購。國防承包領域也出現了類似的強制令,CMMC 2.0要求22萬家供應商提供硬體防火牆以達到3級合規性。歐洲的NIS2指令也對關鍵服務施加了類似的保護措施,從而推動了大西洋彼岸的需求。硬體設備正在從可選的邊界防禦設備演變為政府監管網路中必不可少的執行節點。
快速轉向防火牆即服務將削弱對本地部署硬體的需求。
對於那些尋求無縫擴展的企業而言,雲端交付的安全模式正在削弱其對本地部署設備的需求。 Zscaler 的 2024 會計年度預測顯示,其年收入將成長 35%,這證實了市場對無需擁有硬體的基於服務的解決方案的需求日益成長。雖然 IT 人員有限的中型企業傾向於使用託管防火牆,但由於效能和資料主權方面的要求,許多企業仍然依賴本地硬體。因此,硬體防火牆市場未來將呈現分化趨勢:服務模式將佔據中低階價位市場,而高效能需求仍將以硬體設備為主。
細分市場分析
截至2025年,設備/系統硬體將佔硬體防火牆市場的63.12%,主要得益於企業對基於ASIC晶片的加密流量檢測吞吐量的偏好。然而,隨著企業將配置、監控和事件回應外包給供應商營運的中心,服務業務正以12.72%的複合年成長率成長。預計到2031年,隨著基於結果的合約取代資本支出,硬體防火牆服務市場的規模將翻倍。大型企業仍在不斷更新其基於底盤的設備,而中小企業則擴大選擇供應商管理的解決方案,以避免勞動力短缺問題。
採用零信任架構的企業會將硬體設備部署為安全執行節點,並疊加託管式偵測和回應訂閱服務。 Fortinet 的支援業務收益年增 23%,顯示託管服務的普及率穩定上升。圍繞 AI 加速設備的整合複雜性將進一步推動對專業服務的需求。隨著 5G 微站點的日益普及,安裝和生命週期合約仍將是服務供應商的重要收入來源。
到2025年,大型企業將佔據硬體防火牆市場68.12%的佔有率,這反映了銀行、通訊業者和超大規模雲端服務供應商的全球更新換代週期。雖然中小企業的絕對支出較低,但它們正以12.94%的複合年成長率迅速縮小差距。中小企業硬體防火牆市場規模的成長得益於雲端管理主機,這些控制台減輕了管理負擔,以及供應商提供的融資方案,該方案將前期成本轉化為訂閱支出。
政府補貼和強制性網路保險進一步鼓勵中小企業遵守網路安全法規。根據《英國網路安全漏洞調查》,75%的中小企業已部署至少一台防火牆,超越了早期採用者。供應商正在提供簡化的策略範本和自動更新功能,以彌補企業內部專業知識的不足;通路合作夥伴則將防火牆與寬頻服務打包銷售,提供承包安全防護。
區域分析
到2025年,北美將佔據硬體防火牆市場38.20%的收入佔有率,這主要得益於聯邦政府650億美元的網路安全支出以及集中的科技業需求。美國關鍵基礎設施營運商正在加快更新換代,以符合美國網路安全和基礎設施安全局(CISA)的績效目標;加拿大則透過其《數位憲章》擴大公共部門投資。隨著美墨加協定(USMCA)促進跨國硬體分銷,墨西哥工廠正在將防火牆整合到工業4.0生產線中。
亞太地區到2031年將以12.44%的複合年成長率成為全球成長最快的區域。中國已實施資料安全法,要求國內外企業採用經認證的網路設備。印度的目標是到2025年成為兆美元的數位經濟體,並正在推出獎勵,以促進安全寬頻和資料中心的發展。日本的「社會5.0」計畫推廣5G和邊緣運算,並要求在互聯工廠和智慧城市網路中部署微型防火牆。韓國的「K-Digital新政」將為網實整合基礎設施建設提供資金,優先考慮本地部署的安全防護而非雲端部署。
歐洲正經歷穩定成長,主要得益於GDPR和NIS2合規要求,這些要求強調資料主權和硬體安全保障。德國的工業4.0計畫和法國的雲端主權計畫正在推動企業加大對本地安全偵測點的投入。英國的國家網路安全戰略將在脫歐後繼續實施,這將為英國本土安全廠商贏得政府合約鋪平道路。中東和非洲地區雖然發展落後,但隨著沙烏地阿拉伯的「2030願景」和阿拉伯聯合大公國的「數位國家藍圖」優先考慮通訊業者級安全防護,該地區正在加速發展。非洲金融科技的普及推動了行動支付平台的採購,而資料包遺失會直接導致收入損失。
其他福利:
- Excel格式的市場預測(ME)表
- 3個月的分析師支持
目錄
第1章 引言
- 研究假設和市場定義
- 調查範圍
第2章調查方法
第3章執行摘要
第4章 市場情勢
- 市場概覽
- 市場促進因素
- 隨著多面向網路攻擊變得日益複雜,對ASIC加速測試的需求也隨之增加。
- 政府對聯邦和關鍵基礎設施網路的零信任強制要求
- 邊緣運算和5G密集化需要分散式微防火牆節點
- 為促進國內家電生產而採取的回流獎勵措施和關稅政策
- SD-WAN替代MPLS可加快硬體新一代防火牆的更新週期
- 人工智慧協處理器成本的下降使得中端市場能夠推出Terabit特級設備。
- 市場限制
- 快速轉向防火牆即服務模式削弱了對本地部署硬體的需求。
- 網路處理晶片供應鏈波動性
- 加密通訊檢查的隱私保護限制
- 高通量設備的能源成本不斷上漲
- 產業價值鏈分析
- 監管環境
- 技術展望
- 波特五力分析
- 供應商的議價能力
- 買方的議價能力
- 新進入者的威脅
- 替代品的威脅
- 競爭對手之間的競爭
第5章 市場規模與成長預測
- 按組件
- 設備/系統
- 服務(安裝、支援、管理)
- 按組織規模
- 中小企業
- 主要企業
- 按最終用戶行業分類
- BFSI
- 衛生保健
- 製造業
- 政府和國防部
- 資訊科技和電信
- 零售與電子商務
- 教育
- 按防火牆類型
- 封包過濾防火牆
- 電路級閘道器
- 應用層級/代理防火牆
- 統一威脅管理 (UTM)
- 新一代防火牆(NGFW)
- AI加速/Terabit特級防火牆
- 按地區
- 北美洲
- 美國
- 加拿大
- 墨西哥
- 南美洲
- 巴西
- 阿根廷
- 南美洲其他地區
- 歐洲
- 英國
- 德國
- 法國
- 義大利
- 西班牙
- 荷蘭
- 其他歐洲地區
- 亞太地區
- 中國
- 日本
- 韓國
- 印度
- ASEAN
- 亞太其他地區
- 中東和非洲
- 中東
- 沙烏地阿拉伯
- 阿拉伯聯合大公國
- 土耳其
- 其他中東地區
- 非洲
- 南非
- 奈及利亞
- 肯亞
- 其他非洲地區
- 中東
- 北美洲
第6章 競爭情勢
- 市場集中度
- 策略趨勢
- 市佔率分析
- 公司簡介
- Fortinet Inc.
- Palo Alto Networks Inc.
- Cisco Systems Inc.
- Check Point Software Technologies Ltd.
- Juniper Networks Inc.
- Huawei Technologies Co. Ltd.
- Barracuda Networks Inc.
- SonicWall Inc.
- WatchGuard Technologies Inc.
- Sophos Ltd.
- F5 Inc.
- Forcepoint LLC
- Hillstone Networks Co. Ltd.
- TopSec Technology Group Inc.
- AhnLab Inc.
- Ubiquiti Inc.
- Netgate(Electric Sheep Fencing LLC)
- CUJO LLC
- Bitdefender SRL
- Zscaler Inc.
- Array Networks Inc.
- Sangfor Technologies Inc.
- Stormshield(Airbus CyberSecurity)
第7章 市場機會與未來展望
The hardware firewall market was valued at USD 22.87 billion in 2025 and estimated to grow from USD 25.28 billion in 2026 to reach USD 41.62 billion by 2031, at a CAGR of 10.52% during the forecast period (2026-2031).
Accelerated demand arises from zero-trust mandates in federal and critical-infrastructure networks, edge-computing adoption, 5G densification, and the growing volume of encrypted traffic that now exceeds 90% of total data flows. Device/System hardware continues to dominate revenues, yet managed services expand faster as enterprises substitute capital purchases with outcome-based contracts. Large enterprises drive refresh cycles for terabit-class appliances, while SMEs fuel incremental growth by adopting simplified unified-threat platforms. Regionally, North America retains the lead, but Asia-Pacific registers the quickest expansion as China, India, and ASEAN members align regulatory frameworks with global cybersecurity norms.
Global Hardware Firewall Market Trends and Insights
Increasing Sophistication of Multi-Vector Cyber-Attacks Necessitating ASIC-Accelerated Inspection
Threat actors now combine ransomware, supply-chain exploits, and state-sponsored operations, overwhelming CPU-centric inspection engines. CISA documented 1,132 known exploited vulnerabilities in 2024, a 23% rise over 2023. Dedicated ASICs embedded in hardware appliances process encrypted traffic at line rate, enabling real-time threat mitigation without introducing latency. Fortinet's SP5 ASIC platform reaches 3.2 Tbps throughput with sub-microsecond inspection delays, exemplifying the leap in silicon-level security performance. Machine-learning inference integrated inside these chips supports behavioral detection of zero-day attacks that signature-based engines miss. NIST's Cybersecurity Framework 2.0 explicitly references hardware-accelerated controls for critical-infrastructure protection.
Government Zero-Trust Mandates for Federal and Critical-Infrastructure Networks
Executive Order 14028 obliges U.S. federal agencies to adopt zero-trust architectures by fiscal 2024, backed by USD 9.8 billion in modernization funding. The directive drives bulk procurement of high-throughput appliances capable of continuous verification, micro-segmentation, and encrypted-traffic analytics. Parallel mandates arise in defense contracting, where CMMC 2.0 requires hardware firewalls for Level 3 compliance across 220,000 suppliers. Europe's NIS2 Directive imposes comparable safeguards on essential services, broadening demand across the Atlantic. Hardware appliances have shifted from optional perimeter guards to indispensable enforcement nodes within government-regulated networks.
Rapid Shift to Firewall-as-a-Service Cannibalizing On-Premises Hardware Demand
Cloud-delivered security models erode demand for on-premise boxes among organizations seeking frictionless scalability. Zscaler's 2024 results showed 35% annual revenue growth, underscoring appetite for service-based offerings that eliminate hardware ownership. Mid-market firms with lean IT staff gravitate toward managed firewalls, although performance and data-sovereignty requirements still anchor many enterprises to on-prem hardware. The hardware firewall market therefore faces a bifurcated future where service models absorb low-to-mid range demand while high-performance needs remain appliance-centric.
Other drivers and restraints analyzed in the detailed report include:
- Edge-Computing and 5G Densification Requiring Distributed Micro-Firewall Nodes
- SD-WAN Replacement of MPLS Driving Hardware NGFW Refresh Cycles
- Supply-Chain Volatility for Network-Processing Chips
For complete list of drivers and restraints, kindly check the Table Of Contents.
Segment Analysis
Device/System hardware commanded 63.12% of the hardware firewall market in 2025 as enterprises prioritized ASIC-based throughput for encrypted-traffic inspection. Services, however, race ahead at a 12.72% CAGR as organizations outsource configuration, monitoring, and incident response to vendor-run centers. The hardware firewall market size for Services is on track to double by 2031 as outcome-based contracts displace capital expenditures. Large enterprises continue to refresh chassis-based boxes, but SMEs increasingly prefer vendor-hosted management that sidesteps staffing shortages.
Enterprises embracing zero-trust architectures deploy hardware appliances as enforcement nodes, then overlay managed detection and response subscriptions. Fortinet grew support-services revenue 23% year over year, signaling steady managed-services uptake. Integration complexity around AI-accelerated appliances further elevates demand for professional services. As 5G micro-sites proliferate, installation and lifecycle contracts will remain critical revenue anchors for service providers.
Large enterprises held 68.12% of the hardware firewall market share in 2025, reflecting global refresh cycles among banks, telcos, and hyperscale cloud providers. SMEs, though smaller in absolute spend, post a 12.94% CAGR that narrows the gap each year. The hardware firewall market size attributable to SMEs benefits from cloud-managed consoles that reduce administrative overhead and from vendor financing that converts upfront costs into subscription outlays.
Government grants and cyber-insurance mandates further pull SMEs into compliance regimes. The U.K. Cyber Security Breaches Survey 2024 found that 75% of SMEs now deploy at least one firewall, demonstrating penetration beyond early adopters. Vendors bundle simplified policy templates and automated updates to meet limited in-house expertise, while channel partners package firewalls with broadband circuits for turnkey protection.
The Hardware Firewall Market Report is Segmented by Component (Device/System and Services), Organization Size (SMEs and Large Enterprises), End-User Industry (BFSI, Healthcare, Manufacturing, Government and Defense, and More), Firewall Type (Packet-Filtering, Circuit-Level Gateways, Application-Level/Proxy, UTM, NGFW, and AI-Accelerated), and Geography. The Market Forecasts are Provided in Terms of Value (USD).
Geography Analysis
North America held 38.20% of hardware firewall market revenue in 2025, buoyed by USD 65 billion in federal cybersecurity spending and concentrated technology-sector demand. U.S. critical-infrastructure operators accelerate refresh cycles to align with CISA performance goals, while Canada expands public-sector investment through its Digital Charter. Mexican factories integrate firewalls into Industry 4.0 lines as the USMCA eases cross-border hardware flows.
Asia-Pacific records the fastest regional CAGR at 12.44% through 2031. China enforces its Data Security Law, obliging foreign and domestic firms to adopt certified network gear. India targets a USD 1 trillion digital economy by 2025, channeling incentives toward secure broadband and data-center build-outs. Japan's Society 5.0 pushes 5G and edge-computing, necessitating micro-firewall deployments across connected factories and smart-city grids. South Korea's K-Digital New Deal funds cyber-physical infrastructure that prefers on-premise protection over cloud.
Europe grows steadily on GDPR and NIS2 compliance requirements that emphasize data-sovereignty and hardware enforcement. Germany's Industry 4.0 and France's cloud-sovereignty programs propel enterprise spending on local inspection points. The U.K. National Cyber Strategy extends after Brexit, positioning domestic security vendors for government contracts. Middle East and Africa trails but accelerates as Saudi Arabia's Vision 2030 and the UAE's digital-nation roadmaps prioritize telecom-grade protection. African fintech adoption fuels purchases for mobile money platforms where packet loss equates to revenue loss.
- Fortinet Inc.
- Palo Alto Networks Inc.
- Cisco Systems Inc.
- Check Point Software Technologies Ltd.
- Juniper Networks Inc.
- Huawei Technologies Co. Ltd.
- Barracuda Networks Inc.
- SonicWall Inc.
- WatchGuard Technologies Inc.
- Sophos Ltd.
- F5 Inc.
- Forcepoint LLC
- Hillstone Networks Co. Ltd.
- TopSec Technology Group Inc.
- AhnLab Inc.
- Ubiquiti Inc.
- Netgate (Electric Sheep Fencing LLC)
- CUJO LLC
- Bitdefender SRL
- Zscaler Inc.
- Array Networks Inc.
- Sangfor Technologies Inc.
- Stormshield (Airbus CyberSecurity)
Additional Benefits:
- The market estimate (ME) sheet in Excel format
- 3 months of analyst support
TABLE OF CONTENTS
1 INTRODUCTION
- 1.1 Study Assumptions and Market Definition
- 1.2 Scope of the Study
2 RESEARCH METHODOLOGY
3 EXECUTIVE SUMMARY
4 MARKET LANDSCAPE
- 4.1 Market Overview
- 4.2 Market Drivers
- 4.2.1 Increasing sophistication of multi-vector cyber-attacks necessitating ASIC-accelerated inspection
- 4.2.2 Government zero-trust mandates for federal and critical-infrastructure networks
- 4.2.3 Edge-computing and 5G densification requiring distributed micro-firewall nodes
- 4.2.4 Reshoring incentives and tariffs spurring domestic appliance production
- 4.2.5 SD-WAN replacement of MPLS driving hardware NGFW refresh cycles
- 4.2.6 Falling AI-coprocessor costs enabling mid-market terabit-class appliances
- 4.3 Market Restraints
- 4.3.1 Rapid shift to Firewall-as-a-Service cannibalising on-prem hardware demand
- 4.3.2 Supply-chain volatility for network-processing chips
- 4.3.3 Privacy-driven limits on encrypted-traffic inspection
- 4.3.4 Rising energy costs of high-throughput appliances
- 4.4 Industry Value Chain Analysis
- 4.5 Regulatory Landscape
- 4.6 Technological Outlook
- 4.7 Porter's Five Forces Analysis
- 4.7.1 Bargaining Power of Suppliers
- 4.7.2 Bargaining Power of Buyers
- 4.7.3 Threat of New Entrants
- 4.7.4 Threat of Substitute Products
- 4.7.5 Intensity of Competitive Rivalry
5 MARKET SIZE AND GROWTH FORECASTS (VALUE)
- 5.1 By Component
- 5.1.1 Device / System
- 5.1.2 Services (Installation, Support, Managed)
- 5.2 By Organization Size
- 5.2.1 Small and Medium-sized Enterprises (SMEs)
- 5.2.2 Large Enterprises
- 5.3 By End-user Industry
- 5.3.1 BFSI
- 5.3.2 Healthcare
- 5.3.3 Manufacturing
- 5.3.4 Government and Defense
- 5.3.5 IT and Telecom
- 5.3.6 Retail and E-commerce
- 5.3.7 Education
- 5.4 By Firewall Type
- 5.4.1 Packet-Filtering Firewalls
- 5.4.2 Circuit-Level Gateways
- 5.4.3 Application-Level / Proxy Firewalls
- 5.4.4 Unified Threat Management (UTM)
- 5.4.5 Next-Generation Firewalls (NGFW)
- 5.4.6 AI-Accelerated / Terabit-class Firewalls
- 5.5 By Geography
- 5.5.1 North America
- 5.5.1.1 United States
- 5.5.1.2 Canada
- 5.5.1.3 Mexico
- 5.5.2 South America
- 5.5.2.1 Brazil
- 5.5.2.2 Argentina
- 5.5.2.3 Rest of South America
- 5.5.3 Europe
- 5.5.3.1 United Kingdom
- 5.5.3.2 Germany
- 5.5.3.3 France
- 5.5.3.4 Italy
- 5.5.3.5 Spain
- 5.5.3.6 Netherlands
- 5.5.3.7 Rest of Europe
- 5.5.4 Asia-Pacific
- 5.5.4.1 China
- 5.5.4.2 Japan
- 5.5.4.3 South Korea
- 5.5.4.4 India
- 5.5.4.5 ASEAN
- 5.5.4.6 Rest of Asia-Pacific
- 5.5.5 Middle East and Africa
- 5.5.5.1 Middle East
- 5.5.5.1.1 Saudi Arabia
- 5.5.5.1.2 United Arab Emirates
- 5.5.5.1.3 Turkey
- 5.5.5.1.4 Rest of Middle East
- 5.5.5.2 Africa
- 5.5.5.2.1 South Africa
- 5.5.5.2.2 Nigeria
- 5.5.5.2.3 Kenya
- 5.5.5.2.4 Rest of Africa
- 5.5.5.1 Middle East
- 5.5.1 North America
6 COMPETITIVE LANDSCAPE
- 6.1 Market Concentration
- 6.2 Strategic Moves
- 6.3 Market Share Analysis
- 6.4 Company Profiles (includes Global level Overview, Market level overview, Core Segments, Financials as available, Strategic Information, Market Rank/Share for key companies, Products and Services, and Recent Developments)
- 6.4.1 Fortinet Inc.
- 6.4.2 Palo Alto Networks Inc.
- 6.4.3 Cisco Systems Inc.
- 6.4.4 Check Point Software Technologies Ltd.
- 6.4.5 Juniper Networks Inc.
- 6.4.6 Huawei Technologies Co. Ltd.
- 6.4.7 Barracuda Networks Inc.
- 6.4.8 SonicWall Inc.
- 6.4.9 WatchGuard Technologies Inc.
- 6.4.10 Sophos Ltd.
- 6.4.11 F5 Inc.
- 6.4.12 Forcepoint LLC
- 6.4.13 Hillstone Networks Co. Ltd.
- 6.4.14 TopSec Technology Group Inc.
- 6.4.15 AhnLab Inc.
- 6.4.16 Ubiquiti Inc.
- 6.4.17 Netgate (Electric Sheep Fencing LLC)
- 6.4.18 CUJO LLC
- 6.4.19 Bitdefender SRL
- 6.4.20 Zscaler Inc.
- 6.4.21 Array Networks Inc.
- 6.4.22 Sangfor Technologies Inc.
- 6.4.23 Stormshield (Airbus CyberSecurity)
7 MARKET OPPORTUNITIES AND FUTURE OUTLOOK
- 7.1 White-space and Unmet-need Assessment
 企業網路防火牆市場:依組件、部署類型、企業規模及產業分類-2026年至2032年全球市場預測
 2026年全球網站開發市場報告新一代防火牆市場:按組件、部署模式、功能、組織規模、產業和銷售管道分類-2026-2032年全球市場預測2026年全球新一代防火牆市場報告
 新一代防火牆 (NGFW) 市場分析及至 2035 年預測:按類型、產品類型、服務、技術、組件、應用、部署模式、最終用戶和功能分類網路應用程式防火牆(WAF)市場分析及預測(至2035年):按類型、產品類型、服務、技術、組件、應用、部署模式、最終用戶、功能和解決方案分類下一代防火牆市場分析及至2035年預測:按類型、產品類型、服務、技術、組件、應用、部署類型和最終用戶分類
 全球DNS防火牆市場規模、佔有率、趨勢和成長分析報告(2026-2034年)
 新一代防火牆市場-全球產業規模、佔有率、趨勢、機會及預測(按組件、公司規模、最終用途產業、地區及競爭格局分類,2021-2031年)新一代工業防火牆市場:按組件、組織規模、安全類型、部署模式和最終用戶產業分類-2026-2032年全球預測