


 |
市場調查報告書
商品編碼
1911754
有機肥料:市場佔有率分析、產業趨勢與統計、成長預測(2026-2031)Organic Fertilizer - Market Share Analysis, Industry Trends & Statistics, Growth Forecasts (2026 - 2031) |
||||||
※ 本網頁內容可能與最新版本有所差異。詳細情況請與我們聯繫。
2025年有機肥料市場價值110億美元,預計2031年將達到184.6億美元,高於2026年的119.9億美元。
預計在預測期(2026-2031 年)內,複合年成長率將達到 9.03%。
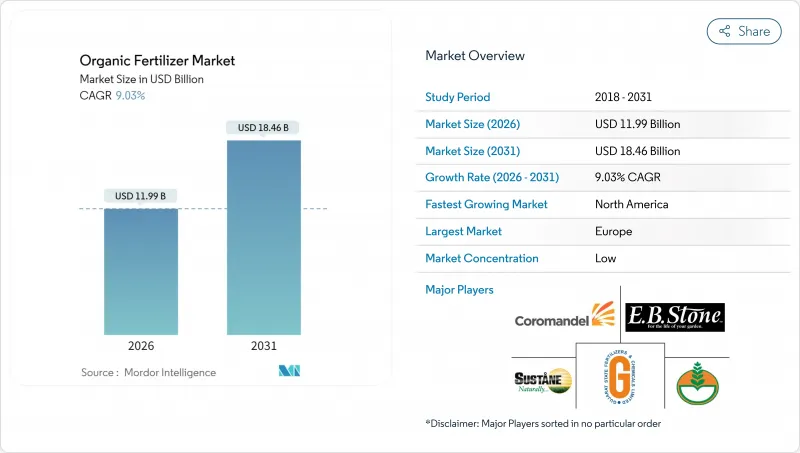
日益成長的永續性需求、消費者對潔淨標示食品的需求以及對高碳投入品的監管處罰,正在推動各大作物系統採用清潔標籤產品。儘管歐洲目前主導市場,但北美產能的快速擴張和政府補貼計畫的不斷擴大,正使成長重心向西半球轉移。將牲畜糞便、食物廢棄物和作物殘渣轉化為標準化、無病原體顆粒的技術創新,不僅延長了保存期限,提高了營養成分的可預測性,還縮小了與傳統合成肥料的成本差距。同時,企業為實現淨零排放目標所做的努力,正在推動與認證生產商簽訂長期供應協議,從而穩定收入預測並降低投資風險。
全球有機肥料市場趨勢與洞察
政府激勵措施和補貼
公共支出正在重塑有機肥料市場的成本經濟模式。美國農業部(USDA)的肥料生產擴張計畫將在2025年前向國內產能注入1.163億美元,其中包括2,500萬美元用於利用黑蠅進行廢棄物增值回收,以及1,280萬美元用於農場堆肥。歐盟的類似資金籌措管道,例如愛爾蘭的有機轉化津貼德國的三年風險緩解方案,正在縮小有機肥料與合成肥料的價格差距。這些獎勵,加上日益嚴格的環境法規,正在有效地引導生產商轉向低碳替代方案。隨著補貼降低資本門檻,小規模設施數量激增,本地供應的韌性增強,運輸距離也縮短。政府津貼與自願性碳市場結合,創造了雙重收入來源,進一步增強了計劃的經濟效益。
消費者對有機食品的需求日益成長
有機食品的消費仍然強勁,有機貿易協會 (OTA) 預測,到 2024 年,有機食品的銷售額將保持兩位數成長。注重健康的年輕一代以及疫情期間的消費習慣,都促使消費者優先選擇無化學添加的農產品。為了達到其範圍 3 的排放目標,各大品牌正在轉向認證供應鏈,例如百事可樂歐洲公司承諾在 2030 年每年採購低碳肥料。高階食品價格的上漲提高了農場利潤率,使農民能夠在維持產量的同時應對不斷上漲的投入成本。這種需求驅動力正促使大型經銷商將認證有機農產品作為標準庫存,使有機肥料市場從利基市場轉變為供應鏈的基礎市場。
生產成本高於合成肥料
有機肥料的單位養分成本仍比尿素或磷酸一銨高出30-50%。這主要是由於批次堆肥、較長的成熟週期和較高的勞動密集度所造成的。較低的養分密度也導致更高的施用量,從而推高了旺季的燃料和資本成本。雖然補貼正在縮小差距,但許多商業作物種植者的利潤率仍然很低,因此在監管允許的情況下,合成肥料在經濟上是可行的。短途霧化裝置透過降低運輸成本緩解了部分問題,但在當地原料價格高企和勞動力市場緊張的時期,這種虛假的經濟效益仍然存在。
細分市場分析
截至2025年,畜禽糞便衍生產品佔有機肥料市場佔有率的42.58%,預計到2031年將保持領先地位,年複合成長率達9.62%,這既反映了市場的成熟度,也體現了其成長空間。畜禽存欄量的成長以及農場自用沼氣池的廣泛應用(可將糞便加工成無病原體顆粒)推動了該細分市場的發展。有機農作物種植者的強勁需求支撐了市場銷售量,而特種水果和堅果行業正在試用由高溫高溫堆肥畜禽糞便製成的葉面噴布配方。
循環經濟的經濟學原理支撐著該產業的韌性。加州酪農合作社將分離的固態投入蚯蚓過濾床,生產富含營養的堆肥,從而將原本的廢棄物處理負擔轉化為經濟效益。除臭接種劑的專利申請數量激增,有效解決了社區長期以來對附近堆肥的反對意見。與生物固形物相比,該領域原料可追溯性強,因此能夠更快地獲得有機肥料認證機構 (OMRI) 的註冊,有助於在認證計畫中儘早獲得種植面積。加工能力的提升縮短了平均運輸距離,降低了物流成本,進一步增強了有機肥料市場的競爭力。
有機肥料市場報告按類型(動物糞便、粉狀肥料等)、作物類型(經濟作物、園藝作物、田間作物等)和地區(非洲、亞太地區、歐洲等)細分。市場預測以價值(美元)和數量(公噸)為單位。
區域分析
到2025年,歐洲將佔全球有機食品收入的40.35%,這一地位源於歐盟的「從農場到餐桌」戰略,該戰略旨在到2030年將25%的農業用地轉化為有機耕地。德國的補貼計畫在轉換的第一年報銷高達70%的認證費用,顯著降低了生產商的財務風險。該地區成熟的有機食品零售業支撐著穩定的下游溢價,即使在家庭支出低迷的情況下,也能實現年度複合消費成長。 COMPO集團位於明斯特的先進緩釋技術工廠將於2024年運作,這將提高營養輸送的精準度,鞏固歐洲作為引領未來全球品質標準技術潮流的先鋒地位。
北美是成長最快的地區,預計到2031年將以11.55%的複合年成長率成長。這主要得益於美國農業部(USDA)肥料生產擴張計畫為76家工廠提供的資金支持。加州擁有多項重大創新技術,包括先進的昆蟲廢棄物處理技術。應對氣候變遷的承諾,尤其是來自大型加工食品公司的承諾,正在推動向有機採購的轉變,從而對原料供應商提出了更高的要求。在加拿大草原地區,一家豆類加工廠和一家堆肥廠正在整合,以將高蛋白粉用作土壤改良劑,進一步促進該地區的循環經濟發展。
亞太地區被視為最大的未開發市場。公私合營,例如KRIBHCO與Novonesis合作,以每英畝500-600盧比(6.3-7.5美元)的價格銷售「Rizosuper」肥料,展現了彌合價格和技術知識差距的策略。中國環境的改善促進了多鹵石的進口,這種互補的礦產資源與有機基材相容。泰國的一體化肥料產業園區自2024年底運作中以來,已開始向國內外用戶供應肥料,徵兆該地區將在預測期內從進口地區轉型為具有競爭力的出口地區。
其他福利:
- Excel格式的市場預測(ME)表
- 3個月的分析師支持
目錄
第1章 引言
- 研究假設和市場定義
- 調查範圍
- 調查方法
第2章 報告
第3章執行摘要和主要發現
第4章:主要產業趨勢
- 有機耕作面積
- 人均有機產品支出
- 法律規範
- 澳洲
- 巴西
- 加拿大
- 中國
- 法國
- 德國
- 印度
- 印尼
- 義大利
- 日本
- 墨西哥
- 荷蘭
- 菲律賓
- 俄羅斯
- 西班牙
- 泰國
- 土耳其
- 英國
- 美國
- 越南
- 價值鍊和通路分析
- 市場促進因素
- 政府激勵措施和補貼
- 消費者對有機食品的需求日益成長
- 限制化肥的環境法規
- 擴大經認證的有機農田
- 循環經濟中的廢棄物化肥料夥伴關係
- 利用感測器進行堆肥品質分析
- 市場限制
- 生產成本高於合成肥料
- 營養成分和品質標準不一致
- 來自生質能源和飼料產業的原料競爭
- 物流排放法規對大宗堆肥運輸處以罰款
第5章 市場規模及成長預測(價值及數量)
- 形式
- 堆肥
- 以膳食為基礎的肥料
- 油餅
- 其他有機肥料
- 作物類型
- 經濟作物
- 園藝作物
- 田間作物
- 地區
- 非洲
- 按國家/地區
- 埃及
- 奈及利亞
- 南非
- 其他非洲地區
- 按國家/地區
- 亞太地區
- 按國家/地區
- 澳洲
- 中國
- 印度
- 印尼
- 日本
- 菲律賓
- 泰國
- 越南
- 亞太其他地區
- 按國家/地區
- 歐洲
- 按國家/地區
- 法國
- 德國
- 義大利
- 荷蘭
- 俄羅斯
- 西班牙
- 土耳其
- 英國
- 其他歐洲地區
- 按國家/地區
- 中東
- 按國家/地區
- 伊朗
- 沙烏地阿拉伯
- 其他中東地區
- 按國家/地區
- 北美洲
- 按國家/地區
- 加拿大
- 墨西哥
- 美國
- 北美其他地區
- 按國家/地區
- 南美洲
- 按國家/地區
- 阿根廷
- 巴西
- 南美洲其他地區
- 按國家/地區
- 非洲
第6章 競爭情勢
- 關鍵策略舉措
- 市佔率分析
- 公司概況
- 公司簡介
- Coromandel International Ltd
- Italpollina SPA
- Gujarat State Fertilizers and Chemicals Ltd
- Deepak Fertilisers and Petrochemicals Corp. Ltd
- EBStone and Sons Inc
- Biolchim SPA(JM Huber Corporation)
- Sustane Natural Fertilizer Inc.
- Fertikal NV
- Nature Safe(Darling Ingredients Inc.)
- California Organic Fertilizers Inc.(Wilbur-Ellis Agribusiness)
- BioFert Manufacturing Inc.(Excel Industries Ltd)
- Indogulf BioAg LLC
- Midwestern BioAg
- True Organic Products Inc.
- The Espoma Company
第7章:CEO們需要思考的關鍵策略問題
The organic fertilizer market was valued at USD 11 billion in 2025 and estimated to grow from USD 11.99 billion in 2026 to reach USD 18.46 billion by 2031, at a CAGR of 9.03% during the forecast period (2026-2031).
Rising sustainability mandates, consumer demand for clean-label food, and regulatory penalties on high-carbon inputs are propelling adoption across all major crop systems. Europe currently anchors market leadership, while rapid capacity expansions in North America and widening government subsidy programs tip the growth balance toward the Western Hemisphere. Technology upgrades that convert manure, food waste, and crop residues into standardized, pathogen-free granules are improving shelf life and nutrient predictability, narrowing the historical cost gap with synthetics. Simultaneously, corporate net-zero commitments are funneling long-term offtake agreements to certified producers, locking in revenue visibility and lowering investment risk.
Global Organic Fertilizer Market Trends and Insights
Government Incentives and Subsidies
Public spending is redefining the cost economics of the organic fertilizer market. The United States Department of Agriculture (USDA) Fertilizer Production Expansion Program injected USD 116.3 million in 2025 into domestic capacity, including USD 25 million for black soldier fly waste-upcycling and USD 12.8 million for on-farm manure processing. Comparable European Union funding channels, such as Ireland's organic transition grants and Germany's three-year risk-reduction packages, compress price differentials with synthetic fertilizers. These incentives align with tightening environmental rules, effectively boxing growers into lower-carbon alternatives. As subsidies reduce capital barriers, smaller facilities proliferate, increasing regional supply resilience and shortening transportation distances. When combined with voluntary carbon markets, government grants create dual revenue streams that further strengthen project economics.
Rising Consumer Demand for Organic Food
Organic food spending has remained robust, with the Organic Trade Association reporting double-digit sales growth through 2024. Health-focused younger demographics and pandemic-era purchasing habits continue to prioritize chemical-free produce. Brands are shifting procurement toward certified supply chains to hit Scope 3 emissions targets, evidenced by PepsiCo Europe's agreement to source low-carbon fertilizers annually by 2030. Premium grocery price points widen farm gate margins, allowing growers to absorb higher input costs while sustaining yields. This demand pull has convinced mainstream distributors to list organic-labeled produce as standard inventory, moving the organic fertilizer market from niche to baseline supply chain status.
Higher Production Cost Than Synthetic Fertilizers
Organic formulations remain 30-50% more expensive per nutrient unit than urea or monoammonium phosphate, mainly due to batch-based composting, longer curing cycles, and higher labor intensity. Lower nutrient density also translates to heavier application rates, raising fuel and equipment expenses during peak planting windows. While subsidies narrow the gap, many commodity growers still face thin margins that make synthetics economically compelling when stewardship rules allow. Short-haul micro-granulation plants mitigate part of the problem by cutting transport costs, yet false economies persist if regional feedstock prices spike or labor markets tighten.
Other drivers and restraints analyzed in the detailed report include:
- Environmental Regulations Limiting Chemical Fertilizers
- Expansion of Certified Organic Farmland
- Inconsistent Nutrient Content and Quality Standards
For complete list of drivers and restraints, kindly check the Table Of Contents.
Segment Analysis
Manure-based products commanded 42.58% of the organic fertilizer market share in 2025 and are projected to maintain the top slot with a 9.62% CAGR through 2031, reflecting simultaneous maturity and room for growth. The segment benefits from rising livestock populations and on-farm digesters that sanitize manure into pathogen-free pellets. Robust demand from organic row-crop growers anchors baseline volumes, while specialty fruit and nut operations are piloting foliar formulations derived from manures treated with high-temperature thermophilic composting.
Circular-economy economics underpin the manure segment's resilience. Dairy cooperatives in California feed separated solids into vermifiltration beds that yield nutrient-rich castings, monetizing what was historically a disposal liability. Patent filings on odor-control inoculants have surged, tackling a longstanding community opposition barrier to nearby manure processing. The segment also enjoys faster OMRI listing times than biosolids, owing to well-documented feedstock traceability, positioning it to capture early-adopter acreage in certification programs. As capacity expands, average haul distances shorten, trimming logistics bills and further polishing its competitive profile within the organic fertilizer market.
The Organic Fertilizer Market Report is Segmented by Form (Manure, Meal-Based Fertilizers, and More), Crop Type (Cash Crops, Horticultural Crops and Row Crops), and Geography (Africa, Asia-Pacific, Europe, and More). The Market Forecasts are Provided in Terms of Value (USD) and Volume (Metric Tons).
Geography Analysis
Europe held 40.35% of global revenues in 2025, a position rooted in the European Union Farm to Fork Strategy, which targets 25% organic farmland by 2030. Germany's subsidy program reimburses up to 70% of certification costs in the first conversion year, slashing financial risk for growers. The region's mature organic grocery sector supports stable downstream premiums, enabling compound annual consumption growth even as household spending moderates. COMPO Group's 2024 commissioning of an advanced release technology plant in Munster elevates nutrient-delivery precision, solidifying Europe as a technology trendsetter that shapes forthcoming global quality standards.
North America is the fastest-growing geography, tracking an 11.55% CAGR through 2031, lifted by the USDA Fertilizer Production Expansion Program's funding across seventy-six facilities. California concentrates a critical mass of innovation, including insect-based waste upgrade. Corporate climate declarations, especially among packaged-food giants, shift procurement into organic channels, creating pull for input suppliers. Canada's Prairie provinces now explore co-locating composting units with pulse-processing plants to recycle high-protein fines into field-applied soil amendments, boosting regional circular-economy credentials.
Asia-Pacific ranks as the largest untapped frontier. Government alliances, such as KRIBHCO partnering with Novonesis to market Rhizosuper at INR 500-600 (USD 6.3-7.5) per acre, reveal public-private strategies to bridge affordability and technical knowledge gaps. China's environmental amendments encourage polyhalite imports, providing a complementary mineral source that blends well with organic matrices. Thailand's fully integrated fertilizer park, operational since late 2024, supplies both domestic and export users, signaling the region's shift from importer to competitive exporter over the outlook period.
- Coromandel International Ltd
- Italpollina SPA
- Gujarat State Fertilizers and Chemicals Ltd
- Deepak Fertilisers and Petrochemicals Corp. Ltd
- E.B.Stone and Sons Inc
- Biolchim SPA (J.M. Huber Corporation)
- Sustane Natural Fertilizer Inc.
- Fertikal NV
- Nature Safe (Darling Ingredients Inc.)
- California Organic Fertilizers Inc. (Wilbur-Ellis Agribusiness)
- BioFert Manufacturing Inc. (Excel Industries Ltd)
- Indogulf BioAg LLC
- Midwestern BioAg
- True Organic Products Inc.
- The Espoma Company
Additional Benefits:
- The market estimate (ME) sheet in Excel format
- 3 months of analyst support
TABLE OF CONTENTS
1 INTRODUCTION
- 1.1 Study Assumptions and Market Definition
- 1.2 Scope of the Study
- 1.3 Research Methodology
2 REPORT OFFERS
3 EXECUTIVE SUMMARY AND KEY FINDINGS
4 KEY INDUSTRY TRENDS
- 4.1 Area Under Organic Cultivation
- 4.2 Per Capita Spending on Organic Products
- 4.3 Regulatory Framework
- 4.3.1 Australia
- 4.3.2 Brazil
- 4.3.3 Canada
- 4.3.4 China
- 4.3.5 France
- 4.3.6 Germany
- 4.3.7 India
- 4.3.8 Indonesia
- 4.3.9 Italy
- 4.3.10 Japan
- 4.3.11 Mexico
- 4.3.12 Netherlands
- 4.3.13 Philippines
- 4.3.14 Russia
- 4.3.15 Spain
- 4.3.16 Thailand
- 4.3.17 Turkey
- 4.3.18 United Kingdom
- 4.3.19 United States
- 4.3.20 Vietnam
- 4.4 Value Chain and Distribution Channel Analysis
- 4.5 Market Drivers
- 4.5.1 Government incentives and subsidies
- 4.5.2 Rising consumer demand for organic food
- 4.5.3 Environmental regulations limiting chemical fertilizers
- 4.5.4 Expansion of certified organic farmland
- 4.5.5 Circular-economy waste-to-fertilizer partnerships
- 4.5.6 Sensor-guided compost quality analytics
- 4.6 Market Restraints
- 4.6.1 Higher production cost than synthetic fertilizers
- 4.6.2 Inconsistent nutrient content and quality standards
- 4.6.3 Feedstock competition from bioenergy and feed industries
- 4.6.4 Logistics-emission policies penalizing bulky manure transport
5 MARKET SIZE AND GROWTH FORECASTS (VALUE AND VOLUME)
- 5.1 Form
- 5.1.1 Manure
- 5.1.2 Meal Based Fertilizers
- 5.1.3 Oilcakes
- 5.1.4 Other Organic Fertilizers
- 5.2 Crop Type
- 5.2.1 Cash Crops
- 5.2.2 Horticultural Crops
- 5.2.3 Row Crops
- 5.3 Geography
- 5.3.1 Africa
- 5.3.1.1 By Country
- 5.3.1.1.1 Egypt
- 5.3.1.1.2 Nigeria
- 5.3.1.1.3 South Africa
- 5.3.1.1.4 Rest of Africa
- 5.3.1.1 By Country
- 5.3.2 Asia-Pacific
- 5.3.2.1 By Country
- 5.3.2.1.1 Australia
- 5.3.2.1.2 China
- 5.3.2.1.3 India
- 5.3.2.1.4 Indonesia
- 5.3.2.1.5 Japan
- 5.3.2.1.6 Philippines
- 5.3.2.1.7 Thailand
- 5.3.2.1.8 Vietnam
- 5.3.2.1.9 Rest of Asia-Pacific
- 5.3.2.1 By Country
- 5.3.3 Europe
- 5.3.3.1 By Country
- 5.3.3.1.1 France
- 5.3.3.1.2 Germany
- 5.3.3.1.3 Italy
- 5.3.3.1.4 Netherlands
- 5.3.3.1.5 Russia
- 5.3.3.1.6 Spain
- 5.3.3.1.7 Turkey
- 5.3.3.1.8 United Kingdom
- 5.3.3.1.9 Rest of Europe
- 5.3.3.1 By Country
- 5.3.4 Middle East
- 5.3.4.1 By Country
- 5.3.4.1.1 Iran
- 5.3.4.1.2 Saudi Arabia
- 5.3.4.1.3 Rest of Middle East
- 5.3.4.1 By Country
- 5.3.5 North America
- 5.3.5.1 By Country
- 5.3.5.1.1 Canada
- 5.3.5.1.2 Mexico
- 5.3.5.1.3 United States
- 5.3.5.1.4 Rest of North America
- 5.3.5.1 By Country
- 5.3.6 South America
- 5.3.6.1 By Country
- 5.3.6.1.1 Argentina
- 5.3.6.1.2 Brazil
- 5.3.6.1.3 Rest of South America
- 5.3.6.1 By Country
- 5.3.1 Africa
6 COMPETITIVE LANDSCAPE
- 6.1 Key Strategic Moves
- 6.2 Market Share Analysis
- 6.3 Company Landscape
- 6.4 Company Profiles (Includes Global Level Overview, Market Level Overview, Core Segments, Financials as available, Strategic Information, Market Rank/Share, Products and Services, and Recent Developments)
- 6.4.1 Coromandel International Ltd
- 6.4.2 Italpollina SPA
- 6.4.3 Gujarat State Fertilizers and Chemicals Ltd
- 6.4.4 Deepak Fertilisers and Petrochemicals Corp. Ltd
- 6.4.5 E.B.Stone and Sons Inc
- 6.4.6 Biolchim SPA (J.M. Huber Corporation)
- 6.4.7 Sustane Natural Fertilizer Inc.
- 6.4.8 Fertikal NV
- 6.4.9 Nature Safe (Darling Ingredients Inc.)
- 6.4.10 California Organic Fertilizers Inc. (Wilbur-Ellis Agribusiness)
- 6.4.11 BioFert Manufacturing Inc. (Excel Industries Ltd)
- 6.4.12 Indogulf BioAg LLC
- 6.4.13 Midwestern BioAg
- 6.4.14 True Organic Products Inc.
- 6.4.15 The Espoma Company
7 KEY STRATEGIC QUESTIONS FOR AGRICULTURAL BIOLOGICALS CEOS
 有機肥料市場:2026-2032年全球市場預測(依配方、產品形式、原料、應用、最終用戶及銷售管道分類)有機農藥市場:2026-2032年全球市場預測(依產品類型、作物類型、配方、應用及通路分類)
 2026年全球有機肥料市場報告2026年全球綠肥市場報告
 全球有機肥料市場規模、佔有率、趨勢和成長分析報告(2026-2034年)富磷有機肥市場:依作物類型、形態、應用通路-2026-2032年全球預測
 全球有機肥料市場:市場規模、佔有率和趨勢分析(按產品、形態、應用和地區分類),細分市場預測(2026-2033 年)全球有機農藥市場規模、佔有率、趨勢和成長分析報告(2026-2034年)
 全球有機農藥市場,2025-2029年
 全球有機肥料市場,2026-2030年