


 |
市場調查報告書
商品編碼
1911712
葉面噴布:市場佔有率分析、產業趨勢與統計、成長預測(2026-2031)Foliar Fertilizer - Market Share Analysis, Industry Trends & Statistics, Growth Forecasts (2026 - 2031) |
||||||
※ 本網頁內容可能與最新版本有所差異。詳細情況請與我們聯繫。
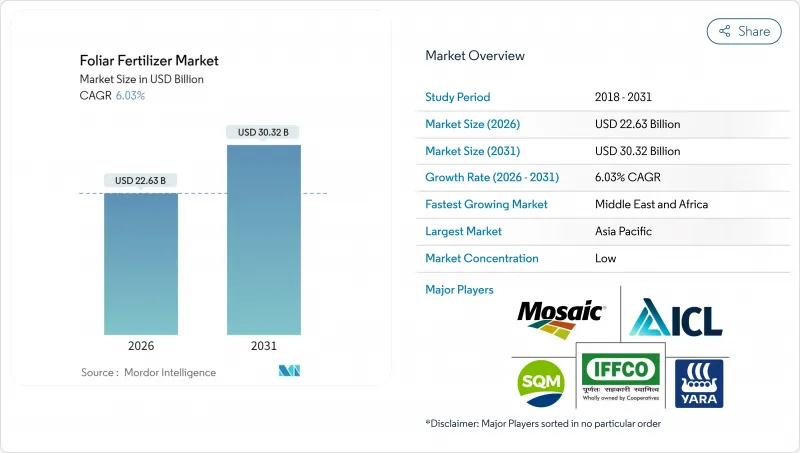
預計葉面噴布市場規模將從 2025 年的 213.4 億美元成長到 2026 年的 226.3 億美元,到 2031 年將達到 303.2 億美元,2026 年至 2031 年的複合年成長率為 6.03%。
這一成長得益於作物養分管理技術的快速現代化、精密農業平台的整合以及政府鼓勵均衡施肥的獎勵。亞太地區主導潮流,中國和印度的補貼計畫加速了科技的普及。同時,中東和非洲地區正經歷最快的成長,沙漠農業正轉向節水型養分供應。複合型多營養素肥料配方正受到尋求一步式解決方案的種植者的青睞,而激勵葉面噴布通訊協定的排碳權計劃則為早期採用者創造了新的收入來源。市場競爭依然適中,前五名供應商僅佔三分之一的銷售額,因此產品創新和區域夥伴關係仍然至關重要。
全球葉面噴布市場趨勢與洞察
平衡施肥計劃的動力日益增強
農業推廣機構建議採用葉面施肥作為一種有針對性的方法,在不影響大量營養元素供應的情況下解決微量元素缺乏問題。玉米和大豆的產量試驗表明,在土壤施用氮磷肥的基礎上,補充葉面噴施鋅錳肥,可使產量提高10%至15%。遵循4R原則(適當的肥料來源、適當的用量、適當的時間、適當的地點)可以減少養分流失,並有助於符合相關法規。美國的公共成本分擔計畫可補貼高達30%的葉面噴布成本,加速了該技術的推廣應用。供應商正在將教育服務納入其銷售方案中,以培養品牌忠誠度並提高複購率。
精密農業應用的快速普及
變數噴灑器、無人機田間調查和物聯網 (IoT) 遙測技術正透過根據田間差異調整施肥量,提升葉面肥料市場的績效。數據驅動的施肥時間最佳化可減少 25% 的過度施肥,並提高養分利用效率。用戶正在整合衛星植被指數和天氣預報,以確定肥料滲透性最佳的葉片生長階段,從而提高吸收率。目前,設備投資回收期平均為三年,這項閾值正推動中型農場的投資。硬體供應商正與肥料生產商合作,透過將軟體授權與營養液捆綁銷售,建立更牢固的通路夥伴關係。
硝酸鹽和磷酸鹽原料價格波動
2024年,能源市場動盪導致硝酸銨價格上漲45%,嚴重擠壓了依賴高純度原料的液體葉面噴布生產商的利潤空間。儘管期貨合約可以緩解部分風險,但小規模生產商缺乏對沖所需的信貸額度。由於被迫進行現貨採購,許多公司不得不在高峰期限制產量,導致供應中斷。隨著大型公司尋求規模經濟效益,產業整合可能會加速。中國磷酸鹽出口監管政策的改變也為長期規劃帶來了更多不確定性。
細分市場分析
到2025年,單一成分產品將佔據葉面肥料市場50.18%的佔有率。這主要歸功於單一營養素產品成本低且用量靈活。然而,複合配方產品的複合年成長率將達到6.19%,顯示種植者對多種營養素的便利性有著強勁的需求。與非螯合鹽相比,複合奈米螯合配方可延長營養素在植物體內的停留時間,並將吸收率提高20%。與生物促效劑的混合相容性使得單次施用即可實現營養補充和抗逆性緩解,從而減少人工投入。同時,簡單的鐵鋅噴霧對於柑橘黃化病等急性病害的防治至關重要,這表明簡單產品和複合產品是互補的,而非相互排斥的。複合產品的監管申報需要更多的殘留數據,這給了資金有限的新參與企業一個障礙。
為了因應這一趨勢,歐洲和以色列正在升級其螯合處理廠。市場策略著重於為作物提供全方位的營養,固定期限的供應合約在主要溫室種植區日益普遍。在只需糾正單一營養缺乏的大型糧食田中,單一成分產品仍有市場需求,尤其是在阿根廷和哈薩克。同時,由於原物料成本上漲導致定價權不足,商品化鹽產品正面臨越來越大的折扣壓力。
葉面肥料市場報告按類型(複合肥和單質肥)、作物類型(田間作物、園藝作物、草坪和觀賞植物)以及地區(北美、南美、歐洲、亞太、中東和非洲)進行細分。市場預測以價值(美元)和數量(公噸)為單位。
區域分析
到2025年,亞太地區將佔全球收入的43.78%。這主要得益於中國政府的補貼計劃,該計劃涵蓋了葉面噴布採購成本的20%。印度農民肥料合作社(IFFCO)等印度合作社在2025年將奈米脲噴施量擴大到300萬公升,提高了農民的認知度。熱帶氣候多變,也有利於分次施肥,因此葉面施肥可以在季風淋失期間補充土壤養分。分銷管道的進步,例如越南的太陽能冷藏倉庫,正在減少對溫度敏感的溶液的變質。與州立大學的研究合作正在提高產品在地化程度,電子商務通路正在觸及小規模農戶叢集。北美是一個成熟但創新主導的產業。精密農業的互聯互通和碳抵消支付創造了多層次的獎勵。在愛荷華州的先導計畫中,葉面硫肥和可變速率氮肥相結合,減少了 12% 的合成肥料用量,幫助玉米種植者達到永續性指標。
加拿大的無污染燃料法規為實施排放措施的種植者提供積分,葉面噴布方法現在也計入合規要求。諮詢服務是爭奪市場佔有率的關鍵,將遙感探測分析與產品供應相結合的公司,其續約率是僅供應投入品的供應商的兩倍。歐洲正在努力平衡成長與監管限制。歐盟的「從農場到餐桌」戰略要求到2030年減少20%的化肥使用量,並將資金用於能夠顯著減少土壤侵蝕的高效葉面噴施技術。荷蘭園藝業率先使用硝酸鎂葉面噴布滴灌系統,在維持低徑流的同時,使溫室黃瓜產量提高了15%。東歐正成為生產擴張的驅動力,而波蘭和羅馬尼亞正在對其農業機械進行現代化改造。更嚴格的微量元素殘留標準要求對產品進行配方調整,以符合歐洲食品安全局的限制。能夠快速獲得認證的供應商將有機會在市場上獲得先發優勢。
中東和非洲地區正經歷最快成長,年複合成長率達6.42%。沙烏地阿拉伯的「2030願景」計畫正在資助水耕大型農場,這些農場大量依賴葉面噴布來保護沙漠水資源。肯亞酪梨出口商正在使用低濃度銅葉面噴施混合物,以滿足歐洲嚴格的殘留標準並提高出口接受率。儘管基礎設施仍有不足,但行動低溫運輸單元正在進入城市邊緣地區,並有助於減少廢棄物。南非糧食產業正在試驗使用無人機進行葉面氮肥噴施,以應對尿素價格上漲,並實現了8%的增產。
其他福利:
- Excel格式的市場預測(ME)表
- 3個月的分析師支持
目錄
第1章 引言
- 研究假設和市場定義
- 調查範圍
- 調查方法
第2章 報告
第3章執行摘要和主要發現
第4章:主要產業趨勢
- 主要農作物種植面積
- 田間作物
- 園藝作物
- 平均應用率
- 微量營養素
- 田間作物
- 園藝作物
- 宏量營養素
- 田間作物
- 園藝作物
- 次要大量營養元素
- 田間作物
- 園藝作物
- 微量營養素
- 具有灌溉設施的農田
- 法律規範
- 價值鍊和通路分析
- 市場促進因素
- 平衡施肥計劃的動力日益增強
- 精密農業應用的快速普及
- 擴大高附加價值園藝作物的種植面積
- 擴大與碳權掛鉤的葉面養分管理方案
- 在農場混合葉面肥料和生物活性物質
- 奈米螯合營養配方可降低施用量
- 市場限制
- 硝酸鹽和磷酸鹽原料價格波動;
- 作物在關鍵生長階段後葉面吸收的局限性
- 出口市場對葉面微量元素基準值更加嚴格
- 需要溫控的液體產品的物流挑戰
第5章 市場規模及成長預測(數量與價值)
- 類型
- 合成的
- 直的
- 按營養成分
- 微量營養素
- 含氮
- 磷酸鹽
- 鉀
- 次要大量營養素
- 按營養成分
- 作物類型
- 田間作物
- 園藝作物
- 草坪和觀賞植物
- 地區
- 亞太地區
- 澳洲
- 孟加拉
- 中國
- 印度
- 印尼
- 日本
- 巴基斯坦
- 菲律賓
- 泰國
- 越南
- 亞太其他地區
- 歐洲
- 法國
- 德國
- 義大利
- 荷蘭
- 俄羅斯
- 西班牙
- 烏克蘭
- 英國
- 其他歐洲地區
- 中東和非洲
- 奈及利亞
- 沙烏地阿拉伯
- 南非
- 土耳其
- 其他中東和非洲地區
- 北美洲
- 加拿大
- 墨西哥
- 美國
- 北美其他地區
- 南美洲
- 阿根廷
- 巴西
- 南美洲其他地區
- 亞太地區
第6章 競爭情勢
- 關鍵策略舉措
- 市佔率分析
- 公司概況
- 公司簡介
- Grupa Azoty SA
- Haifa Chemicals Ltd
- ICL Group Ltd
- Indian Farmers Fertiliser Cooperative Ltd
- Sociedad Quimica y Minera de Chile SA
- The Mosaic Company
- UPL Limited
- Yara International ASA
- Nutrien Ltd
- K+S Aktiengesellschaft
- EuroChem Group AG
- Coromandel International Ltd
- CF Industries Holdings Inc.
- Yara International ASA
- Brandt Inc.
第7章:CEO們需要思考的關鍵策略問題
The foliar fertilizer market is expected to grow from USD 21.34 billion in 2025 to USD 22.63 billion in 2026 and is forecast to reach USD 30.32 billion by 2031 at 6.03% CAGR over 2026-2031.
Rapid modernization of crop nutrition, integration of precision-ag platforms, and government incentives that reward balanced fertilization underpin this growth. Asia-Pacific dominates because subsidy programs in China and India accelerate adoption. At the same time, the Middle East and Africa are the fastest-growing regions as desert farming pivots toward water-efficient nutrient delivery. Complex, multi-nutrient blends gain traction as growers look for single-pass solutions, and carbon-credit schemes that reward foliar protocols create new income streams for early adopters. Competitive intensity remains moderate; the top five suppliers command only one-third of sales, so product innovation and regional partnerships remain pivotal.
Global Foliar Fertilizer Market Trends and Insights
Rising push toward balanced fertilization programs
Extension agencies endorse foliar feeding as a targeted method to correct micronutrient shortages without disturbing macronutrient regimes. Yield trials in corn and soybeans show 10-15% gains when foliar zinc and manganese supplement soil-applied nitrogen and phosphorus. Adherence to the 4R (Right Source, Right Rate, Right Time, Right Place) framework reduces leaching, supporting regulatory compliance. Public cost-share programs in the United States reimburse up to 30% of foliar application expenses, motivating faster technology turnover. Suppliers position educational services as part of the sales package, strengthening brand loyalty and raising repeat-purchase rates.
Rapid adoption of precision-ag applications
Variable-rate sprayers, drone scouting, and IoT (Internet of Things) telemetry elevate foliar fertilizer market performance by matching dosage to in-field variability. Data-driven timing cuts over-application by 25% and improves nutrient-use efficiency. Users integrate satellite vegetation indices with weather forecasts to pinpoint the most permeable leaf stages, boosting uptake. Equipment payback periods now average three years, a threshold that persuades medium-sized farms to invest. Hardware vendors partner with fertilizer producers to bundle software licenses with nutrient packages, weaving stronger channel partnerships.
Volatility in raw-material prices for nitrates and phosphates
Ammonium nitrate prices climbed 45% in 2024 due to energy-market turmoil, squeezing margins for liquid foliar producers that rely on high-purity inputs. Forward contracts mitigate some risk, yet small manufacturers lack the credit lines to hedge. Spot sourcing forces many to ration production in peak season, disrupting supply. Industry consolidation could accelerate as bigger firms pursue economy-of-scale procurement. Regulatory reviews of phosphate exports from China inject further uncertainty into long-term planning.
Other drivers and restraints analyzed in the detailed report include:
- Increasing high-value horticultural acreage
- Growth of carbon-credit linked foliar nutrition schemes
- Limited crop-leaf absorption beyond critical phenological windows
For complete list of drivers and restraints, kindly check the Table Of Contents.
Segment Analysis
Straight products account for 50.18% of the foliar fertilizer market share in 2025 because their single-nutrient focus offers low cost and flexible dosing. Yet complex blends show a 6.19% CAGR, indicating a stronger pull from growers who want multi-nutrient convenience. Complex nanochelated formulas extend nutrient residence time, lifting uptake by 20% compared with unchelated salts. Their tank-mix compatibility with biostimulants trims labor because one pass suffices for both nutrition and stress mitigation. Straight iron or zinc sprays remain vital for acute corrections, such as citrus greening defense, underscoring a complementary rather than exclusive relationship. Regulatory dossiers for complex products demand more residue data, creating barriers that deter low-cap ex entrants.
Suppliers upscale chelation plants in Europe and Israel to match this momentum. Marketing positions revolve around "complete crop diets," and subscription supply contracts gain traction in greenhouse hubs. Straight products keep traction in broad-acre cereals where single-deficiency fixes suffice, especially in Argentina and Kazakhstan. Discounting pressure intensifies because commoditized salts face rising raw-material costs without parallel pricing power.
The Foliar Fertilizer Market Report is Segmented by Type (Complex and Straight), Crop Type (Field Crops, Horticultural Crops, and Turf and Ornamental), and Geography (North America, South America, Europe, Asia-Pacific, The Middle East, and Africa). The Market Forecasts are Provided in Terms of Value (USD) and Volume (Metric Tons).
Geography Analysis
Asia-Pacific contributed 43.78% of global revenue in 2025, as government rebate programs in China covered up to 20% of foliar purchase costs. Indian cooperatives such as Indian Farmers Fertiliser Cooperative Limited (IFFCO) scaled nano-urea sprays to 3 million liters in 2025, widening farmer familiarity. Tropical climatic variability also favors split applications, so foliar feeding supplements soil regimes during monsoon leaching events. Distribution advances, including solar-powered cold stores in Vietnam, reduce spoilage for temperature-sensitive solutions. Research partnerships with state universities sharpen product localization, and e-commerce channels reach smallholder clusters. North America offers a mature but innovation-driven arena. Precision-ag connectivity and carbon-offset payments create layered incentives. Pilot projects in Iowa report that foliar sulfur combined with variable-rate nitrogen cuts total synthetic use by 12%, helping maize growers meet sustainability metrics.
Canada's Clean Fuel Regulations credit growers for emission-reducing practices, and foliar methods count toward compliance. Market-share battles hinge on advisory services; companies that bundle remote sensing analytics with product supply win renewals at double the rate of input-only vendors. Europe balances growth with regulatory constraint. The European Union Farm to Fork strategy mandates a 20% fertilizer reduction by 2030, steering funds toward high-efficiency foliar technologies that slash soil losses. Dutch horticulture pioneers foliar magnesium nitrate drip-mist systems that lift greenhouse cucumber yields 15% while maintaining low runoff. Eastern Europe emerges as a volume booster as Poland and Romania upgrade machinery fleets. Micronutrient residue thresholds tighten, forcing reformulation to comply with European Food Safety Authority limits. Suppliers that certify quickly enjoy first-mover shelf access.
The Middle East and Africa grows fastest at 6.42% CAGR. Saudi Vision 2030 funds hydroponic megafarms that lean heavily on foliar inputs to conserve desert water. Kenyan avocado exporters meet strict European residue caps using low-rate copper foliar mixes, boosting export acceptance rates. Infrastructure gaps persist, but mobile cold-chain units now reach peri-urban hubs, reducing spoilage. South Africa's grain sector trials drone-based foliar nitrogen to offset high urea prices, showing 8% yield uplift.
- Grupa Azoty S.A.
- Haifa Chemicals Ltd
- ICL Group Ltd
- Indian Farmers Fertiliser Cooperative Ltd
- Sociedad Quimica y Minera de Chile SA
- The Mosaic Company
- UPL Limited
- Yara International ASA
- Nutrien Ltd
- K+S Aktiengesellschaft
- EuroChem Group AG
- Coromandel International Ltd
- CF Industries Holdings Inc.
- Yara International ASA
- Brandt Inc.
Additional Benefits:
- The market estimate (ME) sheet in Excel format
- 3 months of analyst support
TABLE OF CONTENTS
1 INTRODUCTION
- 1.1 Study Assumptions and Market Definition
- 1.2 Scope of the Study
- 1.3 Research Methodology
2 REPORT OFFERS
3 EXECUTIVE SUMMARY AND KEY FINDINGS
4 KEY INDUSTRY TRENDS
- 4.1 Acreage Of Major Crop Types
- 4.1.1 Field Crops
- 4.1.2 Horticultural Crops
- 4.2 Average Nutrient Application Rates
- 4.2.1 Micronutrients
- 4.2.1.1 Field Crops
- 4.2.1.2 Horticultural Crops
- 4.2.2 Primary Nutrients
- 4.2.2.1 Field Crops
- 4.2.2.2 Horticultural Crops
- 4.2.3 Secondary Macronutrients
- 4.2.3.1 Field Crops
- 4.2.3.2 Horticultural Crops
- 4.2.1 Micronutrients
- 4.3 Agricultural Land Equipped For Irrigation
- 4.4 Regulatory Framework
- 4.5 Value Chain and Distribution Channel Analysis
- 4.6 Market Drivers
- 4.6.1 Rising push toward balanced fertilization programs
- 4.6.2 Rapid adoption of precision-ag applications
- 4.6.3 Increasing high-value horticultural acreage
- 4.6.4 Growth of carbon-credit linked foliar nutrition schemes
- 4.6.5 On-farm biostimulant blending with foliar fertilizers
- 4.6.6 Nanochelated nutrient formulations lowering application rates
- 4.7 Market Restraints
- 4.7.1 Volatility in raw-material prices for nitrates and phosphates
- 4.7.2 Limited crop-leaf absorption beyond critical phenological windows
- 4.7.3 Residue-limit tightening for foliar micronutrients in export markets
- 4.7.4 Logistics bottlenecks for temperature-sensitive liquid products
5 MARKET SIZE AND GROWTH FORECASTS (VALUE AND VOLUME)
- 5.1 Type
- 5.1.1 Complex
- 5.1.2 Straight
- 5.1.2.1 By Nutrient
- 5.1.2.1.1 Micronutrients
- 5.1.2.1.2 Nitrogenous
- 5.1.2.1.3 Phosphatic
- 5.1.2.1.4 Potassic
- 5.1.2.1.5 Secondary Macronutrients
- 5.1.2.1 By Nutrient
- 5.2 Crop Type
- 5.2.1 Field Crops
- 5.2.2 Horticultural Crops
- 5.2.3 Turf and Ornamental
- 5.3 Region
- 5.3.1 Asia-Pacific
- 5.3.1.1 Australia
- 5.3.1.2 Bangladesh
- 5.3.1.3 China
- 5.3.1.4 India
- 5.3.1.5 Indonesia
- 5.3.1.6 Japan
- 5.3.1.7 Pakistan
- 5.3.1.8 Philippines
- 5.3.1.9 Thailand
- 5.3.1.10 Vietnam
- 5.3.1.11 Rest of Asia-Pacific
- 5.3.2 Europe
- 5.3.2.1 France
- 5.3.2.2 Germany
- 5.3.2.3 Italy
- 5.3.2.4 Netherlands
- 5.3.2.5 Russia
- 5.3.2.6 Spain
- 5.3.2.7 Ukraine
- 5.3.2.8 United Kingdom
- 5.3.2.9 Rest of Europe
- 5.3.3 Middle East and Africa
- 5.3.3.1 Nigeria
- 5.3.3.2 Saudi Arabia
- 5.3.3.3 South Africa
- 5.3.3.4 Turkey
- 5.3.3.5 Rest of Middle East and Africa
- 5.3.4 North America
- 5.3.4.1 Canada
- 5.3.4.2 Mexico
- 5.3.4.3 United States
- 5.3.4.4 Rest of North America
- 5.3.5 South America
- 5.3.5.1 Argentina
- 5.3.5.2 Brazil
- 5.3.5.3 Rest of South America
- 5.3.1 Asia-Pacific
6 COMPETITIVE LANDSCAPE
- 6.1 Key Strategic Moves
- 6.2 Market Share Analysis
- 6.3 Company Landscape
- 6.4 Company Profiles (includes Global level Overview, Market level overview, Core Segments, Financials as available, Strategic Information, Market Rank/Share for key companies, Products and Services, and Recent Developments)
- 6.4.1 Grupa Azoty S.A.
- 6.4.2 Haifa Chemicals Ltd
- 6.4.3 ICL Group Ltd
- 6.4.4 Indian Farmers Fertiliser Cooperative Ltd
- 6.4.5 Sociedad Quimica y Minera de Chile SA
- 6.4.6 The Mosaic Company
- 6.4.7 UPL Limited
- 6.4.8 Yara International ASA
- 6.4.9 Nutrien Ltd
- 6.4.10 K+S Aktiengesellschaft
- 6.4.11 EuroChem Group AG
- 6.4.12 Coromandel International Ltd
- 6.4.13 CF Industries Holdings Inc.
- 6.4.14 Yara International ASA
- 6.4.15 Brandt Inc.

