


 |
市場調查報告書
商品編碼
1911709
氮肥:市佔率分析、產業趨勢與統計、成長預測(2026-2031)Nitrogenous Fertilizers - Market Share Analysis, Industry Trends & Statistics, Growth Forecasts (2026 - 2031) |
||||||
※ 本網頁內容可能與最新版本有所差異。詳細情況請與我們聯繫。
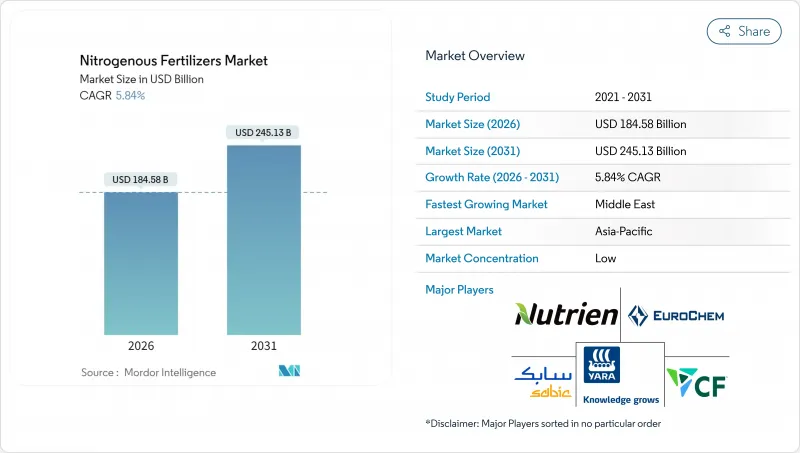
預計到 2026 年,氮肥市場規模將達到 1,845.8 億美元,高於 2025 年的 1,744 億美元。
預計到 2031 年將達到 2,451.3 億美元,2026 年至 2031 年的複合年成長率為 5.84%。
這一成長歸功於全球糧食需求的不斷成長、農業技術的進步以及養分管理方面的創新。政府透過補貼和政策措施提供的支持仍然是關鍵因素。例如,歐盟委員會已暫停對尿素和氨徵收關稅至2024年底,以確保在供應鏈中斷的情況下,化肥的供應、價格可負擔性和永續性。從區域來看,亞太地區憑藉其廣泛的農業活動、強大的政府支持以及精密農業技術的日益普及,正在引領市場成長。競爭格局的特點是全球企業和區域企業並存,全球企業專注於擴大產能、實現原料多元化並採用低碳技術。同時,區域製造商和專業供應商正透過在地化的分銷網路、客製化的產品以及與農業技術平台的合作來擴大市場佔有率。氮肥市場正在向技術主導和在地化發展轉型,為整個價值鏈的創新和策略成長提供了巨大的機會。
全球氮肥市場趨勢及洞察
對主糧作物的需求不斷成長
隨著世界人口成長,糧食需求激增,農業系統面臨越來越大的壓力,必須在有限的土地上實現更高的產量。預計到2050年,全球人口將達到97億,屆時糧食產量需要增加約70%才能滿足日益成長的營養需求。這種需求的激增正在重塑農業實踐,並促使人們更多地使用氮肥來提高作物產量,並在氣候變遷的背景下穩定產量。收入的成長,尤其是在發展中地區,正在推動飲食習慣轉向富含蛋白質的穀物。這導致小麥和水稻等作物的種植強度增加,而這些作物需要施用更多的氮肥。日益加劇的氣候變遷進一步凸顯了穩定產量的必要性,並促進了化學肥料的策略性使用,以穩定產量。在許多地區,人們正在採用一年內輪作玉米、大豆和水稻的多季種植系統,這增加了每公頃的化肥用量。這一趨勢反映出人們的關注點在於最大限度地提高現有農地的生產力,而不是擴大耕地面積。
政府對農業投入品的持續支持
世界各國政府都意識到,價格合理的植物營養素對於農村穩定和糧食安全至關重要。許多國家正在擴大支持項目,例如直接投入補貼、運費回饋和低利率貸款,以確保農民能夠獲得化肥。印度在其2024-2025會計年度預算中將化肥補貼增加到1.75兆盧比(約210億美元),確保農民即使在財政緊張的情況下也能繼續獲得化肥。巴西的「薩夫拉2024-2025計畫」包括一項4,000億雷亞爾(約750億美元)的化肥採購信貸機制。這些舉措顯示私營部門對化肥的需求強勁,並鼓勵對生產能力、分銷基礎設施和技術創新進行投資。一些國家的政府正在推動國內氨生產,以減少對進口的依賴並加強供應鏈。這項政策轉變旨在建立超越價格管制的化肥供應長期韌性。
加強環境法規
旨在減少養分流失和溫室氣體排放的環境政策正在改變世界各地的化肥使用模式。各國正收緊對施肥時間、用量和產品成分的監管,以保護生態系統和水資源。硝酸鹽限量和永續性標準在美國等地區日益普及,迫使農民採用精密農業技術和高效肥料。這些變化正在推動產品開發和施用技術的創新,使化肥使用與環境目標保持一致。隨著監管日益嚴格,氮肥市場將擴大採用既能減少環境影響又能維持農藝性能的先進產品。這一轉變標誌著該行業在尋求平衡生產力和環境保護方面邁出了關鍵的一步。
細分市場分析
到2025年,尿素將佔據氮肥市場43.12%的佔有率,預計到2031年將以6.78%的複合年成長率成長,這主要得益於種植者對其46%氮含量和靈活施用方式的認可。尿素的成本優勢以及在土壤改良和灌溉肥效方面的適應性,鞏固了其在大規模糧食生產系統中的地位。種植者正在升級其設備,採用節能催化劑和排放氣體控制設備,以在保持成本競爭力的同時增強供應保障。持續的投資,例如CF Industries在唐納森維爾的擴建項目,正在提高區域自給自足能力和出口能力,從而鞏固尿素在氮肥市場的主導地位。
在灌溉園藝和高價值經濟作物中,特種肥料越來越受歡迎,因為精準施肥能夠提高利潤。硝酸銨在擁有完善法規和儲存基礎設施的地區仍然十分重要,而無水氨則被用於北美田間作物的直接噴施系統中。隨著環保法規的日益嚴格,對低揮發性和包膜肥料的需求預計將會增加,既能豐富肥料種類,又能維持尿素的核心作用。
預計到2025年,傳統肥料將佔據氮肥市場92.12%的佔有率,預測期內複合年成長率(CAGR)為5.86%。這與整體需求趨勢相符,因為全球面積的增加和價格敏感度普遍有利於散裝顆粒狀產品。大規模集中式工廠受惠於規模經濟,進而降低單位成本,確保在發展中市場的競爭力。廣泛的分銷網路和農民的熟悉度也進一步增強了傳統肥料在大面積農田上的優勢。
特種肥料市場規模小規模,主導控釋和緩釋技術的進步,這些技術能夠提高養分利用效率並最大限度地減少環境損失。用於肥料灌溉和水耕系統的液態肥料在缺水地區具有更大的施用柔軟性。水溶性肥料專為溫室栽培而設計,滿足溫室栽培對精準養分管理的需求。儘管特種肥料價格較高,但預計其應用將推動氮肥市場的成長,尤其是在保護地栽培和集約化水果和蔬菜生產領域,因為在這些領域,其收益遠大於初始成本。
本氮肥市場報告依產品類型(硝酸銨、無水氨及其他)、形態(常規型、特殊型)、施用方法(灌溉施肥、葉面噴布、土壤施用)、作物類型(田間作物、園藝作物及其他)和地區(亞太地區、歐洲、中東和非洲、北美、南美)進行分析。市場預測以價值(美元)和銷售量(公噸)為單位。
區域分析
預計到2025年,亞太地區將佔全球氮肥市場規模的35.42%,反映了該地區廣大的農業用地、較高的種植密度以及有利的補貼政策。中國對糧食安全的重視以及印度小規模農戶的現代化發展,確保了該地區氮肥需求的強勁成長。多種作物輪作制度和高產量雜交品種的日益普及,也使得持續的氮肥投入成為必要。許多區域國家的國內生產能力也降低了對進口的依賴。隨著棕櫚油、水稻和蔬菜種植的密集發展以滿足不斷擴大的都市區的需求,新興東南亞國家的氮肥市場正逐步成長。
預計中東地區將成為成長最快的地區,到2031年複合年成長率將達到6.94%,這得益於其豐富的天然氣原料和接近性連接亞非的航運路線的地理優勢。阿布達比國家石油公司(ADNOC)、沙烏地基礎工業公司(SABIC)和Fertiglobe等企業對藍氨和綠氨工廠的大規模投資旨在同時滿足國內農業計劃和出口市場的需求。政府政策正在推動農業多樣化,以降低對進口的依賴,並鼓勵國內氮肥消費。將碳捕獲解決方案整合到新工廠中,使該地區成為低排放供應商,從而增強了其競爭優勢。
北美和歐洲市場依然成熟,但仍在不斷發展。北美生產商受益於頁岩氣經濟,這增強了他們的出口競爭力,而精密農業的普及也持續推動產量成長。在歐洲,嚴格的環境政策限制了產量,但也刺激了對高效產品和符合「從農場到餐桌」理念的數位化諮詢服務的需求。南美洲市場持續成長,這得益於巴西不斷擴張的農業生產和阿根廷產量的恢復,而非洲市場則擁有長期發展潛力,基礎設施的改善、信貸管道的暢通以及推廣服務的普及推動了化肥的廣泛應用。
其他福利:
- Excel格式的市場預測(ME)表
- 3個月的分析師支持
目錄
第1章 引言
- 研究假設和市場定義
- 調查範圍
- 調查方法
第2章 報告
第3章執行摘要和主要發現
第4章:主要產業趨勢
- 主要農作物種植面積
- 田間作物
- 園藝作物
- 平均施肥量
- 宏量營養素
- 田間作物
- 園藝作物
- 宏量營養素
- 具有灌溉設施的農田
- 法律規範
- 價值鍊和通路分析
- 市場促進因素
- 對主糧作物的需求不斷成長
- 政府對農業投入品的持續支持
- 氨源多樣化
- 最佳化尿素生產能力
- 加速綠色氨先導計畫
- 推出氮利用數位化諮詢平台
- 市場限制
- 天然氣價格波動
- 加強環境法規
- 化肥貿易中的物流瓶頸
- 生物固氮技術的新興替代方案
第5章 市場規模和成長預測(價值和數量)
- 產品
- 硝酸銨
- 無水氨
- 尿素
- 其他
- 形式
- 傳統的
- 特別的
- CRF
- 液體肥料
- SRF
- 水溶性
- 施肥方法
- 施肥和灌溉
- 葉面噴布
- 土壤
- 作物類型
- 田間作物
- 園藝作物
- 草坪和觀賞植物
- 地區
- 亞太地區
- 澳洲
- 孟加拉
- 中國
- 印度
- 印尼
- 日本
- 巴基斯坦
- 菲律賓
- 泰國
- 越南
- 亞太其他地區
- 歐洲
- 法國
- 德國
- 義大利
- 荷蘭
- 俄羅斯
- 西班牙
- 烏克蘭
- 英國
- 其他歐洲地區
- 中東
- 土耳其
- 沙烏地阿拉伯
- 其他中東地區
- 非洲
- 南非
- 奈及利亞
- 其他非洲地區
- 北美洲
- 加拿大
- 墨西哥
- 美國
- 北美其他地區
- 南美洲
- 阿根廷
- 巴西
- 南美洲其他地區
- 亞太地區
第6章 競爭情勢
- 關鍵策略舉措
- 市佔率分析
- 公司簡介
- 公司簡介
- Nutrien Ltd.
- Yara International ASA
- CF Industries Holdings, Inc.
- SABIC Agri-Nutrients Company(Saudi Basic Industries Corporation)
- Koch Fertilizer, LLC(Koch Industries, Inc.)
- EuroChem Group AG
- OCI NV
- Coromandel International Limited(Murugappa Group)
- Indian Farmers Fertiliser Co-operative Limited
- Grupa Azoty SA
- Petronas Chemicals Group Berhad(Petroliam Nasional Berhad)
- Abu Qir Fertilizers and Chemical Industries Company
- PT Pupuk Indonesia(Persero)
第7章:CEO們需要思考的關鍵策略問題
Nitrogenous fertilizers market size in 2026 is estimated at USD 184.58 billion, growing from 2025 value of USD 174.4 billion with 2031 projections showing USD 245.13 billion, growing at 5.84% CAGR over 2026-2031.
This growth is attributed to rising global food demand, advancements in farming practices, and innovations in nutrient management. Government support through subsidies and policy measures remains a critical factor. For instance, the European Commission has suspended tariffs on urea and ammonia until the end of 2024 to ensure the availability, affordability, and sustainability of fertilizers amid supply chain disruptions. Regionally, Asia-Pacific dominates the market due to its extensive agricultural activity, robust government support, and increasing adoption of precision farming technologies. The competitive landscape comprises both global and regional players, while global companies are focusing on capacity expansion, feedstock diversification, and the adoption of low-carbon technologies. Meanwhile, regional producers and specialty suppliers are gaining market share through localized distribution, customized product offerings, and collaborations with agricultural technology platforms. The nitrogenous fertilizers market is evolving into a technology-driven and regionally adaptive industry, offering significant opportunities for innovation and strategic growth across the value chain.
Global Nitrogenous Fertilizers Market Trends and Insights
Rising Demand for Staple Crops
Global population growth is intensifying the demand for food, placing mounting pressure on agricultural systems to deliver higher yields from limited land. As the world's population is projected to reach 9.7 billion by 2050, food production must increase by approximately 70% to meet the growing nutritional needs of this population. This surge in demand is reshaping farming practices, encouraging greater use of nitrogenous fertilizers to boost crop output and stabilize yields amid climate variability. Rising incomes, particularly in developing regions, are shifting dietary preferences toward protein-rich grains, prompting the intensified cultivation of crops like wheat and rice, which require higher nitrogen fertilizer application rates. Climate variability further underscores the need for consistent yields, encouraging the strategic use of fertilizers to stabilize output. In many regions, multiple-cropping systems, which involve rotating maize, soybeans, and rice within a single year, are increasing fertilizer use per hectare. This trend reflects a focus on maximizing productivity on existing farmland rather than expanding acreage.
Sustained Government Support for Agricultural Inputs
Governments worldwide recognize the importance of affordable plant nutrients for rural stability and food security. Many have expanded support programs, including direct input grants, freight rebates, and low-interest loans, to ensure reliable access to fertilizers for farmers. India has increased its fertilizer subsidy budget to INR 1.75 trillion (approximately USD 21 billion) for the fiscal year 2024-25, ensuring continued access for farmers despite fiscal constraints. Brazil's Plano Safra 2024-25 earmarked BRL 400 billion (USD 75 billion) in credit to support fertilizer procurement. These initiatives signal strong demand to the private sector, encouraging investment in production capacity, distribution infrastructure, and innovation. Some governments are promoting domestic ammonia production to reduce their dependency on imports and strengthen their supply chains. This policy shift aims to build long-term resilience in them to fertilizer availability beyond price controls.
Tightening Environmental Regulations
Environmental policies aimed at reducing nutrient runoff and greenhouse gas emissions are reshaping global fertilizer usage. Governments are implementing stricter regulations on application timing, dosage, and product formulations to protect ecosystems and water sources. In regions like the United States, nitrate caps and sustainability benchmarks are becoming increasingly common, prompting farmers to adopt precision methods and more efficient fertilizers. These changes are driving innovation in product development and application technologies, aligning fertilizer use with environmental goals. As regulations tighten, the nitrogenous fertilizers market will increasingly reflect the adoption of advanced products that deliver agronomic performance with reduced environmental impact. This transition represents a significant shift for the industry, striking a balance between productivity and environmental stewardship.
Other drivers and restraints analyzed in the detailed report include:
- Diversification of Ammonia Supply Sources
- Optimization of Urea Production Capacity
- Emergence of Biological Nitrogen-Fixation Alternatives
For complete list of drivers and restraints, kindly check the Table Of Contents.
Segment Analysis
Urea accounted for 43.12% of the nitrogenous fertilizers market share in 2025, with the segment projected to post a 6.78% CAGR to 2031 as growers value its 46% nitrogen concentration and flexible application. Urea's cost advantage and compatibility with both soil incorporation and fertigation underpin its position across large-scale grain systems. Producers are upgrading plants with energy-saving catalysts and emission control units, reinforcing supply security at competitive costs. Continuous investment, such as CF Industries' Donaldsonville expansion, enhances regional self-sufficiency and export capability, sustaining urea's leadership in the nitrogen fertilizer market.
Specialty grades are gaining traction in irrigated horticulture and high-value cash crops, where precise nutrient delivery translates into revenue gains. Ammonium nitrate remains relevant in geographies with established regulations and storage infrastructure, while anhydrous ammonia serves direct injection systems in North American row crops. As environmental scrutiny rises, demand for low-volatility or coated products is set to escalate, adding diversity without displacing urea's central role.
Conventional fertilizers retained a 92.12% share of the nitrogenous fertilizers market size in 2025, expanding at a 5.86% CAGR during the forecast period, broadly in line with overall demand, as global acreage growth and price sensitivity favor bulk granular products. Large centralized plants benefit from economies of scale, which keep unit costs low and ensure competitiveness in developing markets. Widespread dealer networks and farmer familiarity also reinforce the dominance of conventional forms in broad-acre cropping sectors.
Specialty fertilizers represent a smaller segment, led by controlled-release and slow-release technologies that enhance nutrient-use efficiency and minimize environmental losses. Liquid solutions used in fertigation and hydroponic systems broaden application flexibility in water-constrained regions. Water-soluble grades cater to greenhouse operations seeking precise nutrient regimes. Though premium-priced, specialty forms achieve strong adoption where returns justify higher upfront costs, particularly in protected cropping and intensive fruit and vegetable production, promising incremental gains for the nitrogen fertilizer market.
The Nitrogen Fertilizers Market Report is Segmented by Product (Ammonium Nitrate, Anhydrous Ammonia, and Others), Form (Conventional, Specialty), Application Mode (Fertigation, Foliar, and Soil), Crop Type (Field Crops, Horticultural Crops, and Others), and Geography (Asia-Pacific, Europe, Middle East, Africa, North America, and South America). The Market Forecasts are Provided in Terms of Value (USD) and Volume (Metric Tons).
Geography Analysis
The Asia-Pacific region captured 35.42% of the revenue in 2025 of the nitrogenous fertilizers market size, reflecting its vast agricultural land, high cropping intensity, and supportive subsidy frameworks. China's emphasis on food security and India's modernization of smallholder farming guarantee robust baseline demand. Rising adoption of multiple-cropping systems and higher-yielding hybrids requires sustained nitrogen input, and domestic production capacity limits import exposure for many regional players. Emerging Southeast Asian economies are experiencing incremental growth as they intensify palm, rice, and vegetable cultivation to meet the needs of expanding urban centers.
The Middle East delivers the fastest growth at 6.94% CAGR through 2031, leveraging abundant gas feedstock and proximity to shipping lanes that connect Asia and Africa. Large-scale investments in blue and green ammonia plants by ADNOC, SABIC, and Fertiglobe aim to supply both domestic agricultural projects and export markets. Government policies favor agricultural diversification to reduce import dependence, boosting internal consumption of nitrogen fertilizers. Integration of carbon capture solutions in new plants positions the region as a low-emission supplier, strengthening its competitive edge.
North America and Europe maintain mature yet evolving markets. North American producers benefit from shale gas economics that support export competitiveness, while adoption of precision agriculture sustains incremental volume growth. Europe's stringent environmental policy constrains tonnage but spurs demand for enhanced-efficiency products and digital advisory services that align with Farm to Fork objectives. South America grows on the back of Brazilian frontier expansion and Argentine yield recovery, whereas Africa represents long-run potential as infrastructure, credit access, and extension services improve fertilizer penetration.
- Nutrien Ltd.
- Yara International ASA
- CF Industries Holdings, Inc.
- SABIC Agri-Nutrients Company (Saudi Basic Industries Corporation)
- Koch Fertilizer, LLC (Koch Industries, Inc.)
- EuroChem Group AG
- OCI N.V.
- Coromandel International Limited (Murugappa Group)
- Indian Farmers Fertiliser Co-operative Limited
- Grupa Azoty S.A.
- Petronas Chemicals Group Berhad (Petroliam Nasional Berhad)
- Abu Qir Fertilizers and Chemical Industries Company
- PT Pupuk Indonesia (Persero)
Additional Benefits:
- The market estimate (ME) sheet in Excel format
- 3 months of analyst support
TABLE OF CONTENTS
1 INTRODUCTION
- 1.1 Study Assumptions and Market Definition
- 1.2 Scope of the Study
- 1.3 Research Methodology
2 REPORT OFFERS
3 EXECUTIVE SUMMARY AND KEY FINDINGS
4 KEY INDUSTRY TRENDS
- 4.1 Acreage of Major Crop Types
- 4.1.1 Field Crops
- 4.1.2 Horticultural Crops
- 4.2 Average Nutrient Application Rates
- 4.2.1 Primary Nutrients
- 4.2.1.1 Field Crops
- 4.2.1.2 Horticultural Crops
- 4.2.1 Primary Nutrients
- 4.3 Agricultural Land Equipped For Irrigation
- 4.4 Regulatory Framework
- 4.5 Value Chain & Distribution Channel Analysis
- 4.6 Market Drivers
- 4.6.1 Rising Demand for Staple Crops
- 4.6.2 Sustained Government Support for Agricultural Inputs
- 4.6.3 Diversification of Ammonia Supply Sources
- 4.6.4 Optimization of Urea Production Capacity
- 4.6.5 Acceleration of Green Ammonia Pilot Projects
- 4.6.6 Adoption of Digital Advisory Platforms for Nitrogen Use
- 4.7 Market Restraints
- 4.7.1 Volatility in Natural Gas Prices
- 4.7.2 Tightening Environmental Regulations
- 4.7.3 Logistical Bottlenecks in Fertilizer Trade
- 4.7.4 Emergence of Biological Nitrogen-Fixation Alternatives
5 MARKET SIZE AND GROWTH FORECASTS (VALUE AND VOLUME)
- 5.1 Product
- 5.1.1 Ammonium Nitrate
- 5.1.2 Anhydrous Ammonia
- 5.1.3 Urea
- 5.1.4 Others
- 5.2 Form
- 5.2.1 Conventional
- 5.2.2 Speciality
- 5.2.2.1 CRF
- 5.2.2.2 Liquid Fertilizer
- 5.2.2.3 SRF
- 5.2.2.4 Water Soluble
- 5.3 Application Mode
- 5.3.1 Fertigation
- 5.3.2 Foliar
- 5.3.3 Soil
- 5.4 Crop Type
- 5.4.1 Field Crops
- 5.4.2 Horticultural Crops
- 5.4.3 Turf & Ornamental
- 5.5 Region
- 5.5.1 Asia-Pacific
- 5.5.1.1 Australia
- 5.5.1.2 Bangladesh
- 5.5.1.3 China
- 5.5.1.4 India
- 5.5.1.5 Indonesia
- 5.5.1.6 Japan
- 5.5.1.7 Pakistan
- 5.5.1.8 Philippines
- 5.5.1.9 Thailand
- 5.5.1.10 Vietnam
- 5.5.1.11 Rest of Asia-Pacific
- 5.5.2 Europe
- 5.5.2.1 France
- 5.5.2.2 Germany
- 5.5.2.3 Italy
- 5.5.2.4 Netherlands
- 5.5.2.5 Russia
- 5.5.2.6 Spain
- 5.5.2.7 Ukraine
- 5.5.2.8 United Kingdom
- 5.5.2.9 Rest of Europe
- 5.5.3 Middle East
- 5.5.3.1 Turkey
- 5.5.3.2 Saudi Arabia
- 5.5.3.3 Rest of Middle East
- 5.5.4 Africa
- 5.5.4.1 South Africa
- 5.5.4.2 Nigeria
- 5.5.4.3 Rest of Africa
- 5.5.5 North America
- 5.5.5.1 Canada
- 5.5.5.2 Mexico
- 5.5.5.3 United States
- 5.5.5.4 Rest of North America
- 5.5.6 South America
- 5.5.6.1 Argentina
- 5.5.6.2 Brazil
- 5.5.6.3 Rest of South America
- 5.5.1 Asia-Pacific
6 COMPETITIVE LANDSCAPE
- 6.1 Key Strategic Moves
- 6.2 Market Share Analysis
- 6.3 Company Landscape
- 6.4 Company Profiles (Includes Global Level Overview, Market Level Overview, Core Segments, Financials as Available, Strategic Information, Market Rank/Share for Key Companies, Products and Services, and Recent Developments)
- 6.4.1 Nutrien Ltd.
- 6.4.2 Yara International ASA
- 6.4.3 CF Industries Holdings, Inc.
- 6.4.4 SABIC Agri-Nutrients Company (Saudi Basic Industries Corporation)
- 6.4.5 Koch Fertilizer, LLC (Koch Industries, Inc.)
- 6.4.6 EuroChem Group AG
- 6.4.7 OCI N.V.
- 6.4.8 Coromandel International Limited (Murugappa Group)
- 6.4.9 Indian Farmers Fertiliser Co-operative Limited
- 6.4.10 Grupa Azoty S.A.
- 6.4.11 Petronas Chemicals Group Berhad (Petroliam Nasional Berhad)
- 6.4.12 Abu Qir Fertilizers and Chemical Industries Company
- 6.4.13 PT Pupuk Indonesia (Persero)
7 KEY STRATEGIC QUESTIONS FOR FERTILIZER CEOS
 氮肥市場-全球產業規模、佔有率、趨勢、機會、預測:按產品、應用、地區和競爭對手分類,2021-2031年
 氮肥市場:按類型、形態、作物和分銷管道分類-2026-2032年全球預測
 氮肥市場規模、佔有率、趨勢和預測:按類型、作物類型、形態、應用方法和地區分類,2026-2034年
 氮肥市場規模、佔有率和趨勢分析報告:按產品、應用、地區和細分市場預測(2026-2033 年)
 氮肥市場分析及預測(至2035年):類型、產品、應用、技術、最終用戶、形態、製程、功能、設備、解決方案
 全球氮肥市場規模、佔有率、趨勢和成長分析報告(2026-2034年)
 全球氮肥市場報告(2026 年)氮肥市場-2026-2031年預測日本氮肥市場報告:按類型、作物、形態、施用方法和地區分類(2026-2034年)
 氮肥市場規模、佔有率及成長分析(按類型、作物類型、形態和地區分類)-產業預測(2026-2033 年)