


 |
市場調查報告書
商品編碼
1911490
MOSFET功率電晶體:市場佔有率分析、產業趨勢與統計、成長預測(2026-2031年)MOSFET Power Transistors - Market Share Analysis, Industry Trends & Statistics, Growth Forecasts (2026 - 2031) |
||||||
※ 本網頁內容可能與最新版本有所差異。詳細情況請與我們聯繫。
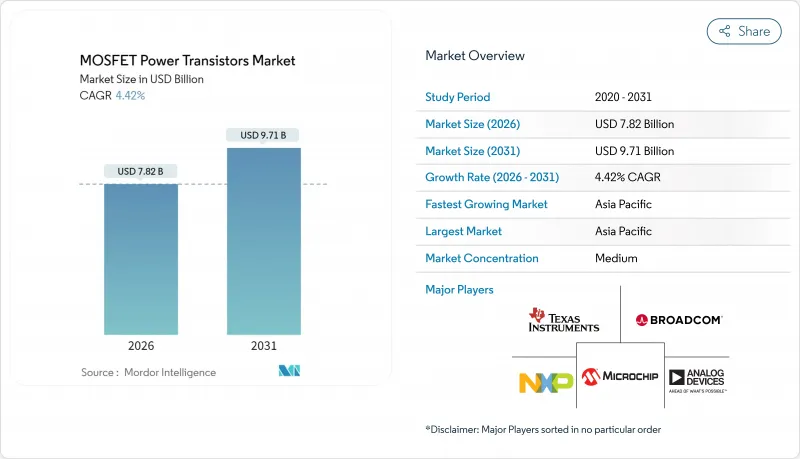
預計 MOSFET 功率電晶體市場在 2026 年的價值將達到 78.2 億美元,從 2025 年的 74.9 億美元成長到 2031 年的 97.1 億美元。
預計2026年至2031年年複合成長率(CAGR)為4.42%。
這一穩步擴張反映了交通電氣化、可再生能源設施擴張以及以人工智慧為中心的資料中心升級所驅動的需求成長。然而,供應瓶頸和製造限制制約了短期內的成長動能。需求集中在電動車、太陽能和風能逆變器以及人工智慧伺服器等高成長終端用戶領域,在這些領域,寬能能隙材料、高壓架構和先進封裝技術帶來了顯著的效率提升。競爭強度仍然適中。主要供應商正利用垂直整合的製造模式、汽車級品質系統和平台組合來鞏固市場佔有率,而靈活的新參與企業則利用其利基生產能力和寬能能隙材料方面的專業知識。政府的「國內製造」激勵措施,特別是美國的《晶片和整合產品法案》(CHIPS Act)以及亞洲和歐洲的類似項目,正在引導採購決策從單純的成本最佳化轉向供應韌性。
全球 MOSFET 功率電晶體市場趨勢與洞察
電動車快速生產推動了牽引MOSFET的採用
隨著電動車產量的擴大,對大電流牽引逆變器的需求日益成長,導致汽車半導體成本從內燃機車型的約400美元/輛上漲至600-800美元/輛。碳化矽MOSFET可實現800V驅動系統,並將充電時間從400V系統的45分鐘縮短至15分鐘,縮短了80%,因此材料成本增加三到四倍也是合理的。英飛凌於2024年12月發布的OptiMOS 7系列元件,可將開關損耗降低30%,並滿足下一代逆變器的熱設計要求。符合AEC-Q101標準的汽車級認證雖然會延長設計週期,但會鞏固現有供應商的市場地位,這些供應商擁有可靠的過往記錄。
政府半導體優惠政策重塑區域製造地
總額達530億美元的《晶片與科學法案》將津貼美國國內半導體製造業,使採購決策從追求最低成本轉向增強韌性。台積電位於亞利桑那州的工廠將獲得66億美元的津貼,並於2028年開始生產功率半導體;英特爾位於俄亥俄州的工廠則將專注於生產車規級MOSFET節點。韓國、日本和歐盟的類似計畫將促進區域叢集的發展,並縮短區域汽車製造商和可再生能源整合商的前置作業時間,但大規模產能的實現要等到2027年以後。
寬能能隙材料的成本溢價阻礙了其廣泛應用。
碳化矽 (SiC) 和氮化鎵 (GaN)晶粒的價格是矽晶片的 3-10 倍,150 毫米 SiC 晶圓的售價為 1500-2000 美元,而矽晶片的售價僅為 50 美元。產量比率徘徊在 60-80% 左右,而特殊的高壓封裝會使每個裝置的成本增加 2-5 美元。雖然採用 200 毫米晶圓可以改善成本曲線,但由於材料特性和資本密集度等因素,在整個預測期內,其絕對價格仍將遠高於傳統矽晶片。
細分市場分析
到2025年,N通道元件將佔總收入的72.55%,凸顯了其低導通電阻和高電子遷移率的優勢,這些優勢在高頻轉換器中至關重要。這一佔有率與MOSFET功率電晶體在牽引逆變器、太陽能MPPT和伺服器VRM市場的主導地位相符。互補/雙通道元件雖然規模較小,但預計在預測期內將以5.48%的最高複合年成長率成長,因為釋放同步整流的優勢,將轉換器損耗降低2-3個百分點。
設計人員正在將互補型MOSFET 組合成半橋結構,用於 DC-DC 轉換器,以最佳化死區期間的導通並降低直通風險。這種結構在 AI 伺服器和電信整流器中得到了越來越廣泛的應用,因為其帶來的功耗節省可以直接轉化為更低的冷卻負載。雖然 P 通道元件在高階應用領域仍佔有一席之地,但其較高的導通電阻使得大部分成長空間被雙通道元件所取代,後者在性能和成本效益之間取得了更好的平衡。
到2025年,矽晶片將佔總收入的68.75%,這主要得益於成熟的200毫米晶圓廠、充足的供應以及每晶粒0.05-0.15美元的經濟效益。這使得矽晶片在600V以下的封裝領域佔據了穩固的地位,儘管人們對碳化矽(SiC)的興趣日益濃厚,但矽晶片在MOSFET功率電晶體市場的佔有率依然強勁。碳化矽5.65%的複合年成長率反映了800V電動車驅動系統、1500V太陽能電池串以及需要結溫高於200°C的工業驅動裝置的需求。
由於具有高導熱性和三倍的擊穿電壓,SiC MOSFET 在高壓範圍內實現了低開關損耗和導通損耗。 GaN 佔據了 650V 和 1-2MHz 的最佳開關頻率範圍,快速充電交流適配器和雷射雷達脈衝產生器的需求不斷成長,但由於晶圓小型化和基板供應的限制,大規模生產在 2031 年之前仍將面臨挑戰。其他化合物半導體將繼續應用於特殊領域,其對收入的貢獻將十分有限。
區域分析
亞太地區將繼續保持領先地位,預計到2025年將佔全球營收的45.20%,複合年成長率(CAGR)預計為7.25%。中國大陸、台灣和韓國擁有成熟的晶圓代工節點以及下游電子組裝叢集,能夠維持區域需求週期。日本正利用政府補貼振興其半導體產業基礎,投資超過130億美元用於功率元件和先進封裝生產線。印度的生產連結獎勵計畫(PLI)計劃正在推動國內電動車和太陽能市場的發展,儘管小規模。
北美正受惠於資料中心的建設和電動車的加速普及。英特爾、Wolfspeed 和安森美半導體正在卡羅來納州和亞利桑那州新增 200 毫米碳化矽 (SiC) 生產線,這將降低對進口的依賴,並有望擴大北美 MOSFET 功率電晶體市場。 《晶片採購和生產法案》(CHIPS Act) 正在推動採購向國內節點轉移,尤其是在關鍵國防零件和汽車認證生產線方面。
歐洲約佔市場佔有率的17.80%,主要由德國汽車巨頭和義大利的專業類比晶片製造廠推動。日益嚴格的環保法規推動了對高效1200V碳化矽元件的需求,這些元件用於可再生能源逆變器和快速充電器。同時,沙烏地阿拉伯和阿拉伯聯合大公國推動了中東地區對大型太陽能發電廠和工業驅動設備的需求,但產能仍依賴進口。拉丁美洲的成長與巴西的區域電動車獎勵和智利的可再生能源競標有關,但與亞太和北美相比,其產量仍然小規模。
其他福利:
- Excel格式的市場預測(ME)表
- 3個月的分析師支持
目錄
第1章 引言
- 研究假設和市場定義
- 調查範圍
第2章調查方法
第3章執行摘要
第4章 市場情勢
- 市場概覽
- 市場促進因素
- 電動車產量激增帶動了對用於牽引和車載充電器的MOSFET的需求。
- 擴大逆變器在太陽能和風能發電等可再生能源領域的應用
- 智慧型手機和穿戴式裝置的出貨量正在迅速成長,而這些裝置都需要低功耗 MOSFET。
- 政府為吸引國內晶圓廠而提供的獎勵措施正在催生利基代工產能合約。
- AI伺服器電源向高壓SiC/GaN階段過渡
- 200mm SiC晶圓成本大幅下降推動了1200V設計方案的普及。
- 市場限制
- 寬能能隙MOSFET的晶粒和封裝成本高成本
- 晶圓產能短缺及前置作業時間長
- 缺乏閘極驅動器介面標準會延緩設計週期。
- 對氟基氣體蝕刻徵收的環境稅推高了生產成本。
- 產業供應鏈分析
- 監管環境
- 技術展望
- 波特五力分析
- 供應商的議價能力
- 買方的議價能力
- 新進入者的威脅
- 替代品的威脅
- 競爭程度
- 宏觀經濟影響評估
第5章 市場規模與成長預測
- 按頻道類型
- N通道
- P頻道
- 互補/對偶
- 材料
- 矽
- 碳化矽(SiC)
- 氮化鎵(GaN)
- 其他材料(GaAs等)
- 按包裝類型
- 分立元件(TO-247/TO-220)
- 表面黏著技術(DPAK、QFN)
- 電源模組
- 晶圓級CSP
- 其他包裝類型
- 按最終用戶行業分類
- 汽車和運輸設備
- 家用電子電器
- 工業和製造業
- 衛生保健
- 航太與國防
- 其他終端用戶產業
- 按地區
- 北美洲
- 美國
- 加拿大
- 墨西哥
- 南美洲
- 巴西
- 阿根廷
- 哥倫比亞
- 南美洲其他地區
- 歐洲
- 英國
- 德國
- 法國
- 義大利
- 西班牙
- 其他歐洲地區
- 亞太地區
- 中國
- 日本
- 韓國
- 印度
- 亞太其他地區
- 中東和非洲
- 中東
- 沙烏地阿拉伯
- 阿拉伯聯合大公國
- 其他中東地區
- 非洲
- 南非
- 埃及
- 其他非洲地區
- 中東
- 北美洲
第6章 競爭情勢
- 市場集中度
- 策略趨勢
- 市佔率分析
- 公司簡介
- Infineon Technologies AG
- STMicroelectronics NV
- ON Semiconductor Corporation
- Texas Instruments Incorporated
- Toshiba Corporation
- Renesas Electronics Corporation
- Mitsubishi Electric Corporation
- Vishay Intertechnology Inc.
- NXP Semiconductors NV
- Analog Devices, Inc.
- Broadcom Inc.
- Microchip Technology Incorporated
- ROHM Co., Ltd.
- Wolfspeed, Inc.
- Alpha and Omega Semiconductor Ltd.
- Littelfuse, Inc.
- Diodes Incorporated
- Nexperia BV
- Fuji Electric Co., Ltd.
- Power Integrations, Inc.
第7章 市場機會與未來展望
MOSFET power transistors market size in 2026 is estimated at USD 7.82 billion, growing from 2025 value of USD 7.49 billion with 2031 projections showing USD 9.71 billion, growing at 4.42% CAGR over 2026-2031.
This measured expansion reflects escalating electrification in transportation, renewable-energy build-outs, and AI-centric data-center upgrades, even as supply bottlenecks and manufacturing constraints temper near-term momentum. Demand concentrates in high-growth end-user arenas-electric vehicles, solar and wind inverters, and AI servers-where wide-bandgap materials, high-voltage architectures, and advanced packaging provide measurable efficiency gains. Competitive intensity remains moderate; top suppliers leverage vertically integrated fabrication, automotive-grade quality systems, and platform portfolios to defend share while nimble entrants exploit niche capacity and wide-bandgap specialization. Government "fab-on-shore" incentives, most prominently the U.S. CHIPS Act and comparable Asian and European programs, reshape sourcing considerations toward supply resilience, nudging procurement decisions away from pure cost-optimization.
Global MOSFET Power Transistors Market Trends and Insights
EV Production Surge Accelerates Traction MOSFET Adoption
Electric-vehicle output scaling propels high-current traction inverter requirements, lifting automotive semiconductor content toward USD 600-800 per car from roughly USD 400 in combustion models. Silicon-carbide MOSFETs enable 800 V drivetrains that trim 80%-charge times to 15 minutes versus 45 minutes on 400 V systems, justifying 3-4 X material premiums. Infineon's OptiMOS 7 family, introduced in December 2024, cuts switching losses by 30% to meet next-generation inverter thermal envelopes. Automotive-grade qualification under AEC-Q101 standards extends design cycles but entrenches incumbent suppliers with proven reliability records.
Government Semiconductor Incentives Reshape Manufacturing Geography
The USD 53 billion CHIPS and Science Act subsidizes domestic U.S. fabrication, shifting sourcing decisions toward resiliency over lowest cost. TSMC's Arizona site, backed by USD 6.6 billion in grants, will commence power semiconductor output in 2028, while Intel's Ohio fabs target automotive-grade MOSFET nodes. Parallel programs in South Korea, Japan, and the European Union foster localized clusters that shorten lead-times for regional automakers and renewable-energy integrators, though meaningful capacity only arrives post-2027.
Wide-Bandgap Cost Premiums Limit Mass-Market Penetration
SiC and GaN dies command 3-10 X silicon prices, with 150 mm SiC wafers selling for USD 1,500-2,000 versus USD 50 slices of silicon. Yields linger around 60-80%, and specialized high-voltage packages add USD 2-5 per device. Cost curves improve with 200 mm adoption, yet material properties and capital intensity keep absolute pricing well above legacy silicon through the forecast window.
Other drivers and restraints analyzed in the detailed report include:
- AI Server Power Architecture Migration Drives SiC Adoption
- Renewable-Energy Inverter Scaling Expands Grid-Tied Applications
- Supply Chain Bottlenecks Extend Lead-Times
For complete list of drivers and restraints, kindly check the Table Of Contents.
Segment Analysis
N-channel devices represented 72.55% of 2025 revenue, underscoring their lower on-resistance and higher electron mobility advantages that remain decisive in high-frequency converters. This share equates to a dominant MOSFET power transistors market position across traction inverters, solar MPPTs, and server VRMs. Complementary/dual devices, while smaller, unlock synchronous rectification benefits that shave 2-3 percentage-point converter losses, propelling a forecast-leading 5.48% CAGR.
Designers pair complementary MOSFETs in half-bridge topologies for DC-DC converters, optimizing conduction during dead-time and trimming shoot-through risk. Adoption scales with AI server and telecom rectifiers, where every watt saved converts to lower cooling loads. Although P-channel devices retain niche high-side roles, their higher on-resistance cedes most growth to dual-channel implementations that balance performance and cost efficiency.
Silicon accounts for 68.75% of 2025 revenue on the back of mature 200 mm fabs, ample supply, and USD 0.05-0.15 per die economics that lock silicon into sub-600 V sockets. Here, the MOSFET power transistors market share for silicon remains sticky despite SiC enthusiasm. Silicon-carbide's 5.65% CAGR reflects 800 V EV drivetrains, 1,500 V solar strings, and industrial drives demanding >200 °C junction capability.
Higher thermal conductivity and three-fold critical electric field tolerance grant SiC MOSFETs lower switching and conduction losses at elevated voltages. GaN occupies the 650 V, 1-2 MHz switching sweet spot, coveted by quick-charge AC adapters and LIDAR pulser stages, yet wafer scaling and substrate availability restrain mass volumes through 2031. Other compound semiconductors remain specialty plays with minimal revenue contribution.
The MOSFET Power Transistors Market Report is Segmented by Channel Type (N-Channel, P-Channel, and Complementary/Dual), Material Technology (Silicon, Silicon-Carbide, Gallium-Nitride, and More), Package Type (Discrete, Surface-Mount, Power Modules, and More), End-User Industry (Automotive, Consumer Electronics, Industrial and Manufacturing, and More), and Geography. The Market Forecasts are Provided in Terms of Value (USD).
Geography Analysis
Asia-Pacific led with 45.20% of 2025 revenue and a 7.25% forecast CAGR. China, Taiwan, and South Korea combine mature foundry nodes with downstream electronics assembly clusters, sustaining localized demand loops. Japan rejuvenates its semiconductor footprint with government subsidies topping USD 13 billion for power device and advanced-packaging lines. India's production-linked incentive (PLI) schemes tap into domestic EV and solar markets, albeit from a small base.
North America benefits from data-center buildouts and accelerating EV adoption. The MOSFET power transistors market size for North America is poised to expand as Intel, Wolfspeed, and onsemi add 200 mm SiC capacity in the Carolinas and Arizona, reducing import reliance. The CHIPS Act tilts sourcing toward domestic nodes, especially for defense-critical and automotive qualification streams.
Europe commands close to 17.80% share, anchored by Germany's automotive giants and Italy's analog specialist fabs. Stricter eco-regulations spur demand for high-efficiency 1,200 V SiC devices in renewable-energy inverters and fast-chargers. Meanwhile, Saudi Arabia and the United Arab Emirates steer Middle East demand toward utility-scale solar farms and industrial drives, yet capacity remains import-oriented. Latin American growth tracks regional EV incentives in Brazil and renewable-energy tenders in Chile, though volume remains modest relative to APAC or NA.
- Infineon Technologies AG
- STMicroelectronics N.V.
- ON Semiconductor Corporation
- Texas Instruments Incorporated
- Toshiba Corporation
- Renesas Electronics Corporation
- Mitsubishi Electric Corporation
- Vishay Intertechnology Inc.
- NXP Semiconductors N.V.
- Analog Devices, Inc.
- Broadcom Inc.
- Microchip Technology Incorporated
- ROHM Co., Ltd.
- Wolfspeed, Inc.
- Alpha and Omega Semiconductor Ltd.
- Littelfuse, Inc.
- Diodes Incorporated
- Nexperia B.V.
- Fuji Electric Co., Ltd.
- Power Integrations, Inc.
Additional Benefits:
- The market estimate (ME) sheet in Excel format
- 3 months of analyst support
TABLE OF CONTENTS
1 INTRODUCTION
- 1.1 Study Assumptions and Market Definition
- 1.2 Scope of the Study
2 RESEARCH METHODOLOGY
3 EXECUTIVE SUMMARY
4 MARKET LANDSCAPE
- 4.1 Market Overview
- 4.2 Market Drivers
- 4.2.1 EV-production boom elevating demand for traction and onboard-charger MOSFETs
- 4.2.2 Renewable-energy inverter build-outs in solar and wind
- 4.2.3 Explosive smartphone and wearable shipments needing low-power MOSFETs
- 4.2.4 Government "fab-on-shore" incentives spawning niche foundry capacity deals
- 4.2.5 AI-server power-supply migration to high-voltage SiC/GaN stages
- 4.2.6 Cost collapse from 200 mm SiC wafers unlocking 1200 V design wins
- 4.3 Market Restraints
- 4.3.1 Wide-bandgap MOSFETs' high die and packaging costs
- 4.3.2 Wafer-capacity shortages and long lead-times
- 4.3.3 Lack of gate-driver interface standard slows design cycles
- 4.3.4 Eco-taxes on fluorinated-gas etching raise production costs
- 4.4 Industry Supply Chain Analysis
- 4.5 Regulatory Landscape
- 4.6 Technological Outlook
- 4.7 Porter's Five Forces Analysis
- 4.7.1 Bargaining Power of Suppliers
- 4.7.2 Bargaining Power of Buyers
- 4.7.3 Threat of New Entrants
- 4.7.4 Threat of Substitutes
- 4.7.5 Degree of Competition
- 4.8 Assessment of Macroeconomic Impact
5 MARKET SIZE AND GROWTH FORECASTS (VALUE)
- 5.1 By Channel Type
- 5.1.1 N-channel
- 5.1.2 P-channel
- 5.1.3 Complementary / Dual
- 5.2 By Material
- 5.2.1 Silicon
- 5.2.2 Silicon-Carbide (SiC)
- 5.2.3 Gallium-Nitride (GaN)
- 5.2.4 Other Materials (GaAs, etc.)
- 5.3 By Package Type
- 5.3.1 Discrete (TO-247/TO-220)
- 5.3.2 Surface-Mount (DPAK, QFN)
- 5.3.3 Power Modules
- 5.3.4 Wafer-Level CSP
- 5.3.5 Other Package Types
- 5.4 By End-user Industry
- 5.4.1 Automotive and Transportation
- 5.4.2 Consumer Electronics
- 5.4.3 Industrial and Manufacturing
- 5.4.4 Healthcare
- 5.4.5 Aerospace and Defense
- 5.4.6 Other End-user Industries
- 5.5 By Geography
- 5.5.1 North America
- 5.5.1.1 United States
- 5.5.1.2 Canada
- 5.5.1.3 Mexico
- 5.5.2 South America
- 5.5.2.1 Brazil
- 5.5.2.2 Argentina
- 5.5.2.3 Colombia
- 5.5.2.4 Rest of South America
- 5.5.3 Europe
- 5.5.3.1 United Kingdom
- 5.5.3.2 Germany
- 5.5.3.3 France
- 5.5.3.4 Italy
- 5.5.3.5 Spain
- 5.5.3.6 Rest of Europe
- 5.5.4 Asia-Pacific
- 5.5.4.1 China
- 5.5.4.2 Japan
- 5.5.4.3 South Korea
- 5.5.4.4 India
- 5.5.4.5 Rest of Asia-Pacific
- 5.5.5 Middle East and Africa
- 5.5.5.1 Middle East
- 5.5.5.1.1 Saudi Arabia
- 5.5.5.1.2 United Arab Emirates
- 5.5.5.1.3 Rest of Middle East
- 5.5.5.2 Africa
- 5.5.5.2.1 South Africa
- 5.5.5.2.2 Egypt
- 5.5.5.2.3 Rest of Africa
- 5.5.5.1 Middle East
- 5.5.1 North America
6 COMPETITIVE LANDSCAPE
- 6.1 Market Concentration
- 6.2 Strategic Moves
- 6.3 Market Share Analysis
- 6.4 Company Profiles (includes Global level Overview, Market level overview, Core Segments, Financials as available, Strategic Information, Market Rank/Share for key companies, Products and Services, and Recent Developments)
- 6.4.1 Infineon Technologies AG
- 6.4.2 STMicroelectronics N.V.
- 6.4.3 ON Semiconductor Corporation
- 6.4.4 Texas Instruments Incorporated
- 6.4.5 Toshiba Corporation
- 6.4.6 Renesas Electronics Corporation
- 6.4.7 Mitsubishi Electric Corporation
- 6.4.8 Vishay Intertechnology Inc.
- 6.4.9 NXP Semiconductors N.V.
- 6.4.10 Analog Devices, Inc.
- 6.4.11 Broadcom Inc.
- 6.4.12 Microchip Technology Incorporated
- 6.4.13 ROHM Co., Ltd.
- 6.4.14 Wolfspeed, Inc.
- 6.4.15 Alpha and Omega Semiconductor Ltd.
- 6.4.16 Littelfuse, Inc.
- 6.4.17 Diodes Incorporated
- 6.4.18 Nexperia B.V.
- 6.4.19 Fuji Electric Co., Ltd.
- 6.4.20 Power Integrations, Inc.
7 MARKET OPPORTUNITIES AND FUTURE OUTLOOK
- 7.1 White-space and Unmet-Need Assessment
 2026年全球雙極型及其他功率電晶體市場報告2026年全球雙極型通用功率電晶體市場報告
 功率電晶體市場報告:按產品、類型、最終用途、應用和地區分類(2026-2034 年)
 功率 MOSFET 市場:按類型、額定功率、應用和地區分類2026年全球雙極功率電晶體市場報告2026年全球功率MOSFET(金屬氧化物半導體場場效電晶體)市場報告2026年全球功率電晶體市場報告
 功率電晶體市場 - 全球產業規模、佔有率、趨勢、機會及預測(按類型、應用、最終用途、地區和競爭格局分類),2021-2031年
 射頻功率LDMOS電晶體市場按功率輸出、頻段、應用、分銷通路和最終用戶分類-2026-2032年全球預測小訊號功率 MOSFET 市場按通道類型、電壓範圍、額定電流、封裝類型、最終用途產業和分銷管道分類,全球預測,2026-2032 年