


 |
市場調查報告書
商品編碼
1911465
機械軸封:市場佔有率分析、產業趨勢與統計、成長預測(2026-2031)Mechanical Seals - Market Share Analysis, Industry Trends & Statistics, Growth Forecasts (2026 - 2031) |
||||||
※ 本網頁內容可能與最新版本有所差異。詳細情況請與我們聯繫。
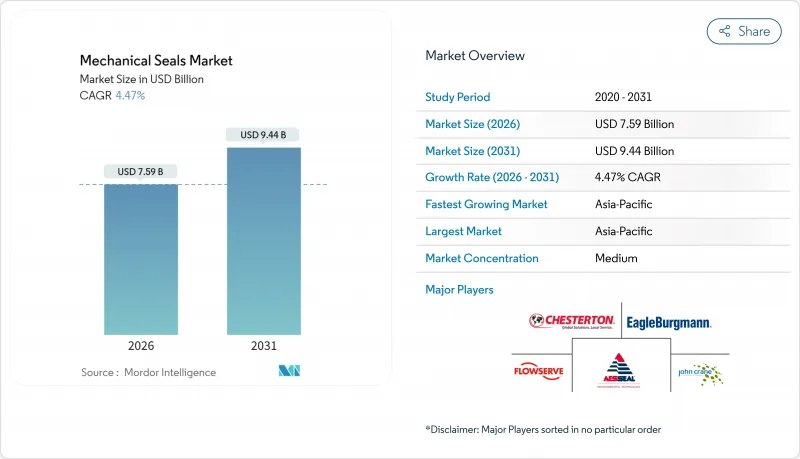
預計到 2026 年,機械密封件市場規模將達到 75.9 億美元,高於 2025 年的 72.7 億美元。預計到 2031 年,該市場規模將達到 94.4 億美元,2026 年至 2031 年的複合年成長率為 4.47%。
由於旋轉設備洩漏預防的重要性日益凸顯,市場對機械密封的需求不斷成長,其中70%的泵浦故障都歸因於密封件相關問題。日益嚴格的逸散性排放法規也推動了市場成長,例如美國環保署 (EPA) 的規定,要求處理壓力超過1.5 psia的揮發性有機化合物的旋轉泵必須採用相容的機械軸封。此外,氫氣和碳排放基礎設施的擴張,以及大規模石化和電力計劃的推進,將在未來十年為機械軸封市場帶來結構性利好。
全球機械密封市場趨勢及展望
石油和天然氣計劃需求不斷成長
大規模的管道和加工設施擴建推動了對密封件的需求,這需要能夠承受超過150巴壓力以及富含硫化氫、二氧化碳和高凝析油組分的天然氣成分的密封件。僅沙烏地阿拉伯主天然氣系統第三期工程就將使管網輸送能力擴大到每日125億立方英尺,這就需要大量用於在酸性氣體條件下保持密封完整性的筒式密封件庫存。阿布達比國家石油公司(ADNOC)因密封件故障提出的280萬美元保固索賠凸顯了此類設備規格不足的代價。 ADNOC與其年產150萬噸二氧化碳捕集裝置相關的乾氣密封件契約,凸顯了該領域的戰略重要性。泵浦製造商和密封件專家正擴大合作開發解決方案,例如EagleBergmann為俄羅斯一條幹線管道提供的高壓密封組件。這些計劃共同推動了機械密封件市場多年穩健成長。
新增發電能力快速成長
核能發電復興、火力發電廠維修以及與可再生能源的混合利用,正在擴大高速泵浦、壓縮機和渦輪輔助系統的裝機量,而所有這些都需要專門設計的密封件。福斯公司2025年的核能訂單連續三個季度超過1億美元,凸顯了碳中和發電領域資本投資的加速成長。聚光型太陽熱能發電計劃正在引入運作約為565°C (1000°F) 的熔鹽迴路,這迫使供應商開發能夠承受極端溫度的石墨和石墨箔襯裡密封面。對於可再生和傳統能源發電設施,電力公司優先考慮能夠在18至24個月的停機週期內免維護運行的密封件,這促使人們傾向於採用具有Plan 32緩衝系統的堅固型盒式密封件設計。這種發展勢頭將在未來十年內支撐機械密封件市場的持續成長。
非接觸式磁性密封(磁性耦合)的快速普及
磁力聯軸器因其能夠消除摩擦、延長使用壽命並降低消費量,在製藥、食品和某些化學工業中得到了廣泛應用。然而,其扭矩容量和散熱方面的限制限制了其應用範圍,使其在低功率應用中難以廣泛使用。此外,某些細分市場對替代產品的需求可能會抑制機械密封市場的成長。
細分市場分析
到2025年,泵浦密封件將佔機械密封市場收入的64.35%,這反映出其在原油輸送、化學反應器和供水設施等眾多應用領域的廣泛採用。供應商正在將內建感測器與雲端儀錶板整合,以記錄振動和溫度資訊,從而實現預測性維護並減少停機時間。壓縮機密封件在天然氣管道和液化天然氣(LNG)設施中發揮至關重要的作用,但由於其應用規模較小,因此需要採用乾氣設計以防止油污染和抑制甲烷外洩。混合器密封件是製藥和食品加工行業間歇式反應器產品線的補充,代表著一個對衛生設計和原位清洗(CIP)兼容彈性體要求較高的細分市場。在泵浦安裝量不斷成長的推動下,該領域預計將實現4.56%的最高複合年成長率,鞏固其在機械密封市場的持續主導地位。
需求利好因素包括中游設施建設的增加和日益嚴格的排放法規,這些因素使得填料密封方式不再具有優勢。與傳統的推式幫浦相比,約翰·克萊恩的USP系列幫浦在五年生命週期內可降低40%的成本。壓縮機密封件供應商正透過提供碳捕獲服務合約來順應脫碳浪潮。攪拌器密封件製造商則專注於提高轉速波動容差和徑向不對中補償能力。所有類別的快速更換計劃都增強了機械密封件行業的韌性,使其在資本支出週期性波動的情況下依然保持強勁勢頭。
機械密封報告按密封類型(泵浦密封、壓縮機密封、混合器密封)、設計類型(組件/推桿式、盒式、剖分式)、終端用戶行業(石油天然氣、發電、化學、用水和污水其他終端用戶行業)和地區(亞太地區、北美、歐洲、南美、中東和非洲)進行細分。市場預測以美元計價。
區域分析
亞太地區佔據機械密封市場36.35%的佔有率,主要得益於石化和天然氣管道大型企劃項目每個現場都需要數千個旋轉密封件。持續4.68%的複合年成長率主要由長期計劃推動,例如印度的煉油廠升級改造和中國的煤化工聯合體項目,這些項目都需要能夠處理磨蝕性和高溫原料的筒式和波紋管密封技術。儘管本地授權生產正在擴大,但複雜的密封表面和塗層仍然依賴進口,這使得全球供應商保持了定價權。服務中心的擴張,例如在新加坡複阻礙翰·克萊恩公司位於巴吞魯日的服務中心,正在增強售後市場收入並提升客戶忠誠度。
在北美,頁岩液化氣物流、液化天然氣出口終端以及美國政府針對碳捕獲的45Q稅額扣抵正在推動市場發展,這些因素都要求使用符合API標準的雙密封件和乾氣密封件。預計到2031年,北美機械密封市場規模將超過21.2億美元,主要得益於與嚴格的甲烷減排法規相符的維修計畫。
在歐洲,嚴格的TA-Luft法規的實施,以及可再生能源的加速普及,使該國成為超低洩漏解決方案的技術試驗場。為了確保合規性,營運商正在加裝與監控系統相連的密封監測探頭,從而推動了對數位化盒式裝置的需求。
北海的氫氣加註站和氨氣燃料庫作業正在推動小眾、高附加價值訂單。雖然機械密封件在歐洲的市佔率小於亞太地區,但由於複雜的規格層級和較長的保固期,歐洲的單價卻位居最高之列。能夠獲得EN 10204材料認證並符合PED和ATEX法規的供應商,在這個法規環境中擁有戰略優勢。
其他福利:
- Excel格式的市場預測(ME)表
- 3個月的分析師支持
目錄
第1章 引言
- 研究假設和市場定義
- 調查範圍
第2章調查方法
第3章執行摘要
第4章 市場情勢
- 市場概覽
- 市場促進因素
- 石油和天然氣計劃需求不斷成長
- 新增發電能力快速成長
- 加強全球逸散排放法規
- 擴大化工和石化聯合企業的產能
- 低溫氫和綠色氨基礎設施的開發
- 市場限制
- 非接觸式磁性密封的快速普及
- 磨料漿料服務的高生命週期成本
- 3D列印密封殼體降低了售後市場需求
- 價值鏈分析
- 波特五力模型
- 供應商的議價能力
- 買方的議價能力
- 新進入者的威脅
- 替代品的威脅
- 競爭對手之間的競爭
第5章 市場規模與成長預測
- 按密封類型
- 幫浦密封件
- 壓縮機密封件
- 攪拌機密封圈
- 依設計類型
- 組件/推桿
- 墨水匣
- 分裂
- 按最終用戶行業分類
- 石油和天然氣
- 發電
- 化學
- 水和污水處理
- 其他終端用戶產業(採礦和礦物加工、食品、製藥等)
- 按地區
- 亞太地區
- 中國
- 印度
- 日本
- 韓國
- ASEAN
- 亞太其他地區
- 北美洲
- 美國
- 加拿大
- 墨西哥
- 歐洲
- 德國
- 英國
- 法國
- 義大利
- 俄羅斯
- 其他歐洲地區
- 南美洲
- 巴西
- 阿根廷
- 南美洲其他地區
- 中東和非洲
- 沙烏地阿拉伯
- 南非
- 其他中東和非洲地區
- 亞太地區
第6章 競爭情勢
- 市場集中度
- 策略趨勢
- 市佔率(%)/排名分析
- 公司簡介
- AW Chesterton Company
- AESSEAL
- Dana Limited
- Eagle Industry Co., Ltd.
- EagleBurgmann
- Flexaseal Engineered Seals and Systems, LLC
- Flowserve Corporation
- Gallagher Seals
- Garlock
- Hutchinson Industries Inc.
- John Crane
- Parker Hannifin Corp
- SKF
- Technetics Group
第7章 市場機會與未來展望
Mechanical Seals Market size in 2026 is estimated at USD 7.59 billion, growing from 2025 value of USD 7.27 billion with 2031 projections showing USD 9.44 billion, growing at 4.47% CAGR over 2026-2031.
Demand tracks the critical need to prevent leakage in rotating equipment, as 70% of pump failures originate with seal issues. Growth is reinforced by tightening fugitive-emission rules, including the U.S. EPA mandate that rotary pumps handling volatile organic compounds above 1.5 psia must employ compliant mechanical seals. Expansion of hydrogen and carbon-capture infrastructure, coupled with large-scale petrochemical and power projects, adds structural tailwinds for the mechanical seals market across the next decade.
Global Mechanical Seals Market Trends and Insights
Growing Demand from Oil and Gas Projects
Massive pipeline and processing expansions elevate seal demand by requiring units designed for pressures surpassing 150 bar and gas compositions rich in H2S, CO2, and high condensate fractions. Saudi Arabia's Master Gas System Phase 3 alone raises network capacity to 12.5 billion cubic feet per day, mandating large inventories of engineered cartridge seals that maintain integrity under sour-gas conditions. ADNOC's historical warranty claims of USD 2.8 million for seal failures illustrate the cost of under-specifying such equipment. Dry-gas seal contracts tied to ADNOC's 1.5 million-tons-per-year carbon-capture facility confirm the segment's strategic importance. Partnerships between pump OEMs and seal specialists are deepening to co-engineer solutions, a trend evidenced by EagleBurgmann's high-pressure seal packages for Russian trunk pipelines. Collectively, these projects underpin robust, multi-year growth for the mechanical seals market.
Surge in New Power-Generation Capacity Additions
Nuclear renaissance, thermal retrofits, and renewable hybrids expand the installed base of high-speed pumps, compressors, and turbine auxiliary systems that all require specialized sealing arrangements. Flowserve recorded nuclear orders topping USD 100 million for the third straight quarter in 2025, highlighting capital acceleration toward carbon-neutral generation. Concentrated solar power projects are introducing molten-salt loops operating near 565 °C, prompting suppliers to develop graphite- and grafoil-lined seal faces that withstand extreme temperatures. Across renewable and conventional builds, utilities prioritize seals that can run maintenance-free across 18- to 24-month outage cycles, lifting preference for robust cartridge designs equipped with Plan 32 buffer fluid systems. This momentum supports a durable uplift in the mechanical seals market across the coming decade.
Rapid Uptake of Non-Contact Magnetic Seals
Magnetic couplings eliminate friction, extend service life, and cut water consumption, attributes that are resonating in pharmaceutical, food, and certain chemical processes. Their applicability remains limited by torque capacity and heat dissipation constraints, restricting penetration to low-power services. Nonetheless, niche substitution pressures may trim incremental growth from the mechanical seals market in selected segments.
Other drivers and restraints analyzed in the detailed report include:
- Tightening Fugitive-Emission Regulations Worldwide
- Capacity Expansion in Chemical and Petrochemical Complexes
- High Lifecycle Cost in Abrasive Slurry Services
For complete list of drivers and restraints, kindly check the Table Of Contents.
Segment Analysis
Pump seals generated 64.35% of the mechanical seals market revenue in 2025, reflecting ubiquitous deployment across crude-oil transfer, chemical reactors, and municipal water stations. Suppliers are pairing embedded sensors with cloud dashboards to log vibration and temperature, enabling predictive maintenance that lowers downtime. Compressor seals occupy a crucial but smaller share focused on gas pipelines and LNG facilities, where dry-gas designs eliminate oil entrainment and curtail methane slip. Mixer seals round out the portfolio by servicing batch reactors in pharma and food processing, a niche that values hygienic designs and CIP-friendly elastomers. Rising pump installations underpin the fastest CAGR at 4.56% for this group, locking in continued dominance within the mechanical seals market.
Demand tailwinds include heightened midstream construction and stricter emission caps that disfavor packing solutions. John Crane's USP-series pumps display a 40% reduction in lifecycle cost versus traditional pusher types over five-year spans. Compressor seal suppliers are capitalizing on decarbonization by bundling carbon-capture service agreements. Mixer-seal makers focus on speed variation tolerance and radial misalignment compensation. Across categories, rapid replacement programs support resilience in the mechanical seals industry despite cyclical capex swings.
The Mechanical Seals Report is Segmented by Seal Type (Pump Seals, Compressor Seals, and Mixer Seals), Design Type (Component/Pusher, Cartridge, and Split), End-User Industry (Oil and Gas, Power Generation, Chemical, Water and Waste-Water, and Other End-User Industries), and Geography (Asia-Pacific, North America, Europe, South America, and Middle-East and Africa). The Market Forecasts are Provided in Terms of Value (USD).
Geography Analysis
Asia-Pacific's 36.35% holding in the mechanical seals market reflects petrochemical and gas-pipeline megaprojects that require thousands of rotary seals per site. Sustained 4.68% CAGR stems from long-lead projects like India's refinery upgrades and China's coal-to-chemicals complexes, each demanding cartridge and bellows technology able to tackle abrasive and high-temperature feeds. Local manufacture under license is expanding, yet complex faces and coatings still rely on imports, preserving pricing power for global suppliers. Service-center expansion, such as John Crane's Baton Rouge-style model replicated in Singapore, shores up aftermarket revenues and lifetime customer loyalty.
North America benefits from shale liquids logistics, LNG export terminals, and the U.S. government's 45Q tax credit for carbon capture, all of which specify API-compliant dual seals and dry-gas seals. The mechanical seals market size in North America is forecast to pass USD 2.12 billion by 2031, supported by retrofit programs that align with stringent methane-reduction rules.
Europe's strict TA-Luft implementation, coupled with accelerating renewables penetration, positions the region as a technology test bed for ultra-low-leakage solutions. Operators add seal-monitoring probes tied to supervisory control systems to ensure compliance, feeding demand for digital-ready cartridge units.
Hydrogen refueling stations and ammonia bunkering ventures in the North Sea drive niche, high-value orders. While overall mechanical seals market share is smaller than Asia-Pacific's, European unit values are highest because of complex specification layers and long warranty terms. Suppliers that can certify materials to EN 10204 and adhere to PED and ATEX regulations maintain strategic advantage in this tightly regulated arena.
- A.W. Chesterton Company
- AESSEAL
- Dana Limited
- Eagle Industry Co., Ltd.
- EagleBurgmann
- Flexaseal Engineered Seals and Systems, LLC
- Flowserve Corporation
- Gallagher Seals
- Garlock
- Hutchinson Industries Inc.
- John Crane
- Parker Hannifin Corp
- SKF
- Technetics Group
Additional Benefits:
- The market estimate (ME) sheet in Excel format
- 3 months of analyst support
TABLE OF CONTENTS
1 Introduction
- 1.1 Study Assumptions and Market Definition
- 1.2 Scope of the Study
2 Research Methodology
3 Executive Summary
4 Market Landscape
- 4.1 Market Overview
- 4.2 Market Drivers
- 4.2.1 Growing Demand from Oil and Gas Projects
- 4.2.2 Surge in New Power-Generation Capacity Additions
- 4.2.3 Tightening Fugitive-Emission Regulations Worldwide
- 4.2.4 Capacity Expansion in Chemical and Petrochemical Complexes
- 4.2.5 Cryogenic Hydrogen and Green-Ammonia Infrastructure Build-Out
- 4.3 Market Restraints
- 4.3.1 Rapid Uptake of Non-Contact Magnetic Seals
- 4.3.2 High Lifecycle Cost in Abrasive Slurry Services
- 4.3.3 3-D Printed Seal Housings Reducing Aftermarket Volumes
- 4.4 Value Chain Analysis
- 4.5 Porter's Five Forces
- 4.5.1 Bargaining Power of Suppliers
- 4.5.2 Bargaining Power of Buyers
- 4.5.3 Threat of New Entrants
- 4.5.4 Threat of Substitutes
- 4.5.5 Competitive Rivalry
5 Market Size and Growth Forecasts (Value)
- 5.1 By Seal Type
- 5.1.1 Pump Seals
- 5.1.2 Compressor Seals
- 5.1.3 Mixer Seals
- 5.2 By Design Type
- 5.2.1 Component / Pusher
- 5.2.2 Cartridge
- 5.2.3 Split
- 5.3 By End-user Industry
- 5.3.1 Oil and Gas
- 5.3.2 Power Generation
- 5.3.3 Chemical
- 5.3.4 Water and Waste-water
- 5.3.5 Other End-user Industries (Mining and Mineral Processing, Food, Pharma, etc.)
- 5.4 By Geography
- 5.4.1 Asia-Pacific
- 5.4.1.1 China
- 5.4.1.2 India
- 5.4.1.3 Japan
- 5.4.1.4 South Korea
- 5.4.1.5 ASEAN
- 5.4.1.6 Rest of Asia-Pacific
- 5.4.2 North America
- 5.4.2.1 United States
- 5.4.2.2 Canada
- 5.4.2.3 Mexico
- 5.4.3 Europe
- 5.4.3.1 Germany
- 5.4.3.2 United Kingdom
- 5.4.3.3 France
- 5.4.3.4 Italy
- 5.4.3.5 Russia
- 5.4.3.6 Rest of Europe
- 5.4.4 South America
- 5.4.4.1 Brazil
- 5.4.4.2 Argentina
- 5.4.4.3 Rest of South America
- 5.4.5 Middle-East and Africa
- 5.4.5.1 Saudi Arabia
- 5.4.5.2 South Africa
- 5.4.5.3 Rest of Middle-East and Africa
- 5.4.1 Asia-Pacific
6 Competitive Landscape
- 6.1 Market Concentration
- 6.2 Strategic Moves
- 6.3 Market Share (%)/Ranking Analysis
- 6.4 Company Profiles (includes Global level Overview, Market level overview, Core Segments, Financials as available, Strategic Information, Market Rank/Share for key companies, Products and Services, and Recent Developments)
- 6.4.1 A.W. Chesterton Company
- 6.4.2 AESSEAL
- 6.4.3 Dana Limited
- 6.4.4 Eagle Industry Co., Ltd.
- 6.4.5 EagleBurgmann
- 6.4.6 Flexaseal Engineered Seals and Systems, LLC
- 6.4.7 Flowserve Corporation
- 6.4.8 Gallagher Seals
- 6.4.9 Garlock
- 6.4.10 Hutchinson Industries Inc.
- 6.4.11 John Crane
- 6.4.12 Parker Hannifin Corp
- 6.4.13 SKF
- 6.4.14 Technetics Group
7 Market Opportunities and Future Outlook
- 7.1 White-space and Unmet-Need Assessment
 攪拌器機械軸封市場:按類型、材料、設計、產業、安裝位置、潤滑方式、壓力、溫度、應用、終端用戶分類,全球預測,2026-2032年雙機械密封市場:依密封配置、材料、安裝類型、壓力等級、溫度範圍、終端用戶產業、應用、通路分類,全球預測,2026-2032年食品飲料產業旋轉密封件市場:按產品類型、材料、溫度範圍、壓力範圍、最終用途和應用分類-全球預測,2026-2032年分離式機械密封市場:按密封結構、材料、設計、應用、最終用途行業和銷售管道- 全球預測,2026-2032年氣動動態密封市場:全球預測(2026-2032 年),依產品類型、材料、運作類型、安裝方式和最終用途產業分類氣體潤滑密封件市場按產品類型、氣體類型、壓力、運行速度、溫度、最終用途產業和應用分類-全球預測,2026-2032年鍋爐機械軸封市場按產品類型、材料、安裝方式、最終用途產業、應用類型和銷售管道,全球預測(2026-2032年)
 2026年全球機械密封市場報告
 2026-2030年全球氣動密封市場刷式密封圈市場按產品類型、材質、應用、最終用途和分銷管道分類 - 全球預測 2026-2032